Lyncourt, NY (New York) Houses and Residents
| Lyncourt: | $112,777 |
| New York: | $400,400 |
Mean price in 2022:
Detached houses: $136,052
Here: $136,052 State: $476,719 Townhouses or other attached units: $143,694
Here: $143,694 State: $699,270 In 2-unit structures: $154,899
Here: $154,899 State: $713,077
Total population: 4,250 (All urban)
Houses: 1,797 (1,682 occupied: 1,110 owner occupied, 631 renter occupied)
| % of renters here: | 36% |
| State: | 46% |
Housing density: 1,451 houses/condos per square mile
Median price asked for vacant for-sale houses and condos in 2022 in this county: $60,373.
Median contract rent in 2022: $824 (lower quartile is $701, upper quartile is $949)
Median rent asked for vacant for-rent units in 2022: $756
Median gross rent in Lyncourt, NY in 2022: $939
Housing units in Lyncourt with a mortgage: 736 (78 second mortgage, 0 home equity loan, 70 both second mortgage and home equity loan)
Houses without a mortgage: 77
Median household income for houses/condos with a mortgage: $77,943
Median household income for apartments without a mortgage: $57,385
Median monthly housing costs: $946
Compare current foreclosures near Lyncourt, NY:
| Photo | Address | Area | Beds / Baths | Price | Details |
|---|---|---|---|---|---|

|
#1
Willumae Dr
Syracuse, NY 13208
|
1,065 sq. feet
|
1 baths 2 beds |
$84,900
|
show details |

|
#2
Spring St
Syracuse, NY 13208
|
2,244 sq. feet
|
2 baths 4 beds |
$219,900
|
show details |

|
#3
Bridge St
Phoenix, NY 13135
|
2,976 sq. feet
|
2 baths 6 beds |
$39,900
|
show details |

|
#4
John St
Syracuse, NY 13208
|
1,925 sq. feet
|
2 baths 3 beds |
show details | |

|
#5
Sutton Dr
Syracuse, NY 13219
|
1,692 sq. feet
|
2 baths 4 beds |
show details | |

|
#6
Fyler Rd
Kirkville, NY 13082
|
3,150 sq. feet
|
3 baths 6 beds |
show details | |

|
#7
Sagamore Dr S
Liverpool, NY 13090
|
1,600 sq. feet
|
1 baths 4 beds |
show details | |

|
#8
Fage Ave
Syracuse, NY 13205
|
1,128 sq. feet
|
1 baths 3 beds |
show details | |

|
#9
S Midler Ave
Syracuse, NY 13206
|
1,002 sq. feet
|
1 baths 3 beds |
show details | |

|
#10
Standish Dr
Syracuse, NY 13212
|
1,650 sq. feet
|
3 baths 4 beds |
show details |
| Photo | Address | Area | Beds / Baths | Price | Details |
|---|---|---|---|---|---|

|
#11
E Colvin St
Syracuse, NY 13210
|
1,008 sq. feet
|
1 baths 3 beds |
show details | |

|
#12
State Route 31
Bridgeport, NY 13030
|
1,654 sq. feet
|
2 baths 3 beds |
show details | |

|
#13
N State St
Syracuse, NY 13208
|
1,273 sq. feet
|
1 baths 3 beds |
show details | |

|
#14
Oswego Rd
Clay, NY 13041
|
1,152 sq. feet
|
1 baths 3 beds |
show details | |

|
#15
1st North St
Syracuse, NY 13208
|
1,448 sq. feet
|
1 baths 3 beds |
show details | |

|
#16
Woodland Ave
Syracuse, NY 13205
|
1,505 sq. feet
|
1 baths 3 beds |
show details | |

|
#17
Norton Ave
Chittenango, NY 13037
|
1,092 sq. feet
|
1 baths 3 beds |
show details | |

|
#18
Parker House Path
Cicero, NY 13039
|
2,274 sq. feet
|
2 baths 3 beds |
show details | |

|
#19
Garden City Dr
Syracuse, NY 13211
|
1,680 sq. feet
|
2 baths 4 beds |
show details | |

|
#20
Balsam St
Liverpool, NY 13088
|
2,172 sq. feet
|
2 baths 3 beds |
show details |
| Photo | Address | Area | Beds / Baths | Price | Details |
|---|---|---|---|---|---|

|
#21
Old Barn Rd
Clay, NY 13041
|
1,786 sq. feet
|
2 baths 4 beds |
show details | |

|
#22
Shanty Creek Rd
Central Square, NY 13036
|
980 sq. feet
|
1 baths 3 beds |
show details | |

|
#23
Wycliffe Rd
Syracuse, NY 13209
|
1,580 sq. feet
|
2 baths 3 beds |
show details | |

|
#24
Old Barn Rd
Clay, NY 13041
|
1,880 sq. feet
|
1 baths 3 beds |
show details | |

|
#25
Everingham Rd
Syracuse, NY 13205
|
1,494 sq. feet
|
1 baths 3 beds |
show details | |

|
#26
Beverly Dr
Syracuse, NY 13219
|
1,294 sq. feet
|
1 baths 4 beds |
show details | |

|
#27
Makyes Rd
Syracuse, NY 13215
|
1,472 sq. feet
|
2 baths 3 beds |
show details | |

|
#28
Cowan Ave N
Syracuse, NY 13209
|
1,092 sq. feet
|
1 baths 3 beds |
show details | |

|
#29
State Route 31
Cicero, NY 13039
|
1,590 sq. feet
|
1 baths 2 beds |
show details | |

|
#30
Skyview Ter
Syracuse, NY 13219
|
1,008 sq. feet
|
1 baths 3 beds |
show details |
| Photo | Address | Area | Beds / Baths | Price | Details |
|---|---|---|---|---|---|

|
#31
Male Ave
Syracuse, NY 13219
|
1,536 sq. feet
|
1 baths 3 beds |
show details | |

|
#32
Orchard St # A
Fayetteville, NY 13066
|
1,502 sq. feet
|
2 baths 2 beds |
show details | |

|
#33
Sandra Ave
Cicero, NY 13039
|
1,200 sq. feet
|
1 baths 3 beds |
show details | |

|
#34
East Ave
Kirkville, NY 13082
|
1,152 sq. feet
|
1 baths 4 beds |
show details | |

|
#35
Bury Dr
Syracuse, NY 13209
|
1,014 sq. feet
|
1 baths 3 beds |
show details | |

|
#36
Jane Dr
Syracuse, NY 13219
|
932 sq. feet
|
1 baths 3 beds |
show details | |

|
#37
Beverly Dr
Syracuse, NY 13219
|
1,152 sq. feet
|
1 baths 3 beds |
show details | |

|
#38
Eastgate Cir
Liverpool, NY 13090
|
2,768 sq. feet
|
2 baths 4 beds |
show details | |

|
#39
Gettman Rd
Syracuse, NY 13209
|
1,195 sq. feet
|
2 baths 3 beds |
show details | |

|
#40
Stonefield Rd
Syracuse, NY 13205
|
1,392 sq. feet
|
2 baths 3 beds |
show details |
| Photo | Address | Area | Beds / Baths | Price | Details |
|---|---|---|---|---|---|

|
#41
Lorenzo Dr
Syracuse, NY 13206
|
1,108 sq. feet
|
1 baths 2 beds |
show details | |

|
#42
Whedon Rd
Camillus, NY 13031
|
1,054 sq. feet
|
1 baths 3 beds |
show details | |

|
#43
Hinsdale Rd
Camillus, NY 13031
|
1,176 sq. feet
|
1 baths 2 beds |
show details | |

|
#44
Vanida Dr
Camillus, NY 13031
|
1,492 sq. feet
|
1 baths 3 beds |
show details | |

|
#45
Pembridge Cir
Syracuse, NY 13215
|
2,281 sq. feet
|
2 baths 4 beds |
show details | |

|
#46
Stetson Cir
Syracuse, NY 13215
|
2,456 sq. feet
|
1 baths 4 beds |
show details | |

|
#47
Cleveland Rd
Syracuse, NY 13215
|
2,331 sq. feet
|
2 baths 4 beds |
show details | |

|
#48
Derby Dr
Syracuse, NY 13215
|
2,087 sq. feet
|
2 baths 4 beds |
show details | |

|
#49
Randall Ave
Nedrow, NY 13120
|
736 sq. feet
|
1 baths 2 beds |
show details | |

|
Check over 1 million property listings on Foreclosure.com!
|
browse all offers | |||

Latest news about housing in Lyncourt, NY collected exclusively by city-data.com from local newspapers, TV, and radio stations

 | Mattydale 9th Best Real Estate Market for First-Time Homebuyers in 2023 (6 replies) |
| Syracuse named one of 12 up-and-coming housing markets (266 replies) |
| CNY Rental Suggestions (26 replies) |
| Ideas for the economic growth and quality of life in Syracuse (376 replies) |
| Functional vs. Beautiful City Design (149 replies) |
| Hancock Field, Syracuse: Old Base Housing (90 replies) |

Median year apartment built: 1963
Household type by relationship:
Households: 3,880- Male householders: 732 (246 living alone), Female householders: 929 (343 living alone)
513 spouses (504 opposite-sex spouses), 176 unmarried partners, (164 opposite-sex unmarried partners), 1,196 children (1,184 natural, 11 adopted, 0 stepchildren), 73 grandchildren, 55 brothers or sisters, 0 parents, 2 foster children, 106 other relatives, 84 non-relatives
- In group quarters: 10
Size of family households: 397 2-persons, 194 3-persons, 130 4-persons, 94 5-persons, 22 6-persons, 15 7-or-more-persons.
Size of nonfamily households: 656 1-person, 235 2-persons.
432 married couples with children.
417 single-parent households (56 men, 361 women).
88.5% of residents of Lyncourt speak English at home.
0.7% of residents speak Spanish at home (56% speak English very well, 44% speak English not well).
4.6% of residents speak other Indo-European language at home (49% speak English very well, 12% speak English well, 9% speak English not well, 30% don't speak English at all).
1.3% of residents speak Asian or Pacific Island language at home (60% speak English very well, 11% speak English well, 30% speak English not well).
4.1% of residents speak other language at home (69% speak English very well, 10% speak English well, 21% speak English not well).
Foreign born population: 272 (7.0%)
(46.3% of them are naturalized citizens)
| Here: | 6.1 |
| State: | 6.3 |
| Here: | 4.2 |
| State: | 3.8 |

- Bedrooms in owner-occupied houses and condos in Lyncourt, New York
- 0no bedroom
- 311 bedroom
- 3752 bedrooms
- 5283 bedrooms
- 1444 bedrooms
- 325+ bedrooms

- Bedrooms in renter-occupied apartments in Lyncourt, New York
- 0no bedroom
- 2031 bedroom
- 2712 bedrooms
- 1553 bedrooms
- 34 bedrooms
- 05+ bedrooms

- Cars and other vehicles available in Lyncourt in owner-occupied houses/condos
- 33no vehicle
- 5091 vehicle
- 5142 vehicles
- 543 vehicles
- 04 vehicles
- 05+ vehicles

- Cars and other vehicles available in Lyncourt in renter-occupied apartments
- 69no vehicle
- 4211 vehicle
- 1162 vehicles
- 263 vehicles
- 04 vehicles
- 05+ vehicles

- Rooms in owner-occupied houses in Lyncourt, New York
- 01 room
- 122 rooms
- 383 rooms
- 794 rooms
- 2665 rooms
- 3126 rooms
- 2017 rooms
- 888 rooms
- 1149+ rooms

- Rooms in renter-occupied apartments in Lyncourt, New York
- 01 room
- 802 rooms
- 1223 rooms
- 1414 rooms
- 1275 rooms
- 06 rooms
- 1487 rooms
- 158 rooms
- 09+ rooms


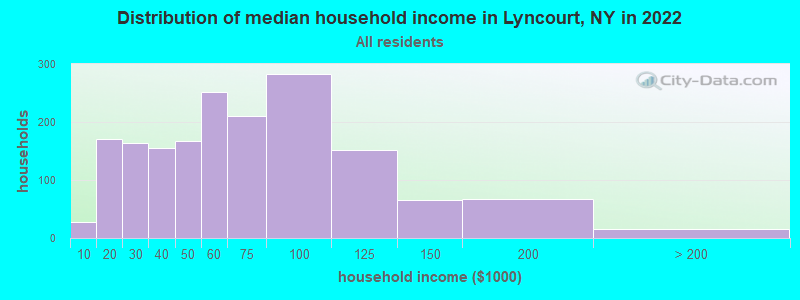
Lyncourt, NY household income distribution

- 27Less than $10,000
- 171$10,000 to $19,999
- 164$20,000 to $29,999
- 156$30,000 to $39,999
- 167$40,000 to $49,999
- 251$50,000 to $59,999
- 211$60,000 to $74,999
- 282$75,000 to $99,999
- 152$100,000 to $124,999
- 65$125,000 to $149,999
- 68$150,000 to $199,999
- 16$200,000 or more
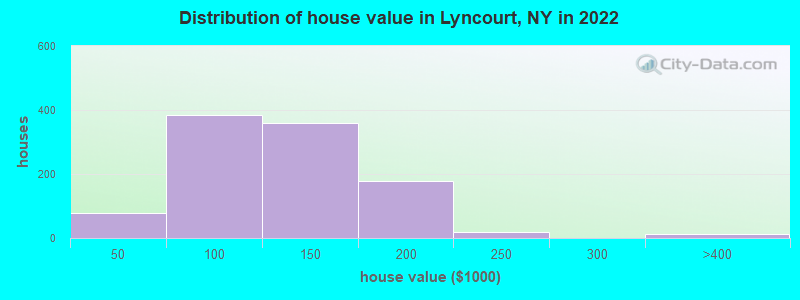
Home value of owner - occupied houses in 2022 in Lyncourt, NY
-
- 46$10,000 to $14,999
- 24$15,000 to $19,999
- 8$40,000 to $49,999
- 13$50,000 to $59,999
- 15$60,000 to $69,999
- 145$80,000 to $89,999
- 201$90,000 to $99,999
- 194$100,000 to $124,999
- 164$125,000 to $149,999
- 178$150,000 to $174,999
- 18$200,000 to $249,999
- 11$300,000 to $399,999
Rent paid by renters in 2022 in Lyncourt, NY
-
- 23$450 to $499
- 13$550 to $599
- 69$650 to $699
- 69$700 to $749
- 46$750 to $799
- 218$800 to $899
- 69$900 to $999
- 79$1,000 to $1,249
- 25$1,250 to $1,499
- 6No cash rent


Percentage of workers working in this county: 99.4%
Number of people working at home: 238 (11.6% of all workers)
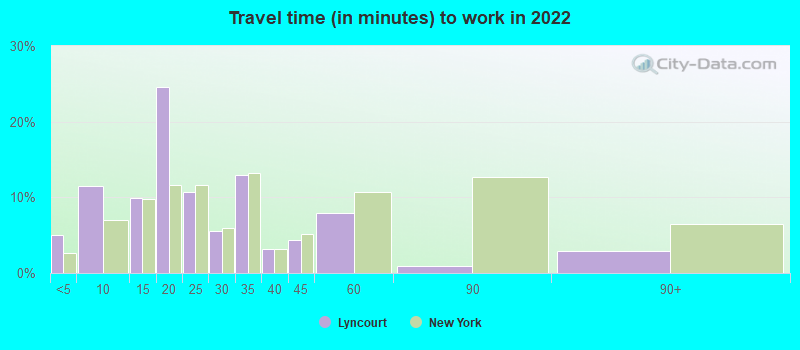
Travel time to work (commute)
- Less than 5 minutes: 114
- 5 to 9 minutes: 159
- 10 to 14 minutes: 534
- 15 to 19 minutes: 551
- 20 to 24 minutes: 318
- 25 to 29 minutes: 10
- 30 to 34 minutes: 28
- 35 to 39 minutes: 14
- 40 to 44 minutes: 0
- 45 to 59 minutes: 52
- 60 to 89 minutes: 11
- 90 or more minutes: 0
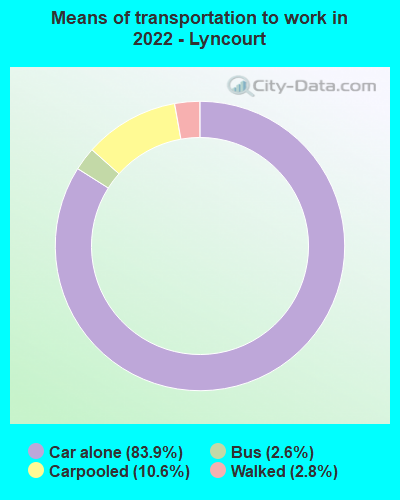
Means of transportation to work:
- Drove a car alone: 1,628 (74.0%)
- Carpooled: 218 (9.9%)
- Bus: 38 (1.7%)
- Walked: 60 (2.7%)
- Worked at home: 238 (10.8%)

- Unemployment by race in 2022
- Unemployment rate for White non-Hispanic residents
- 0.8%Females
- Unemployment rate for Black residents
- 10.8%Males
- Unemployment rate for Asian residents
- 7.2%Males

- Year of entry for the foreign-born population in Lyncourt, New York
- 1772010 or later
- 442000 to 2009
- 571990 to 1999
- 221980 to 1989
- 241970 to 1979
- 130Before 1970

First ancestries reported:
- Italian: 472 (34.7%)
- Irish: 150 (11.0%)
- German: 132 (9.7%)
- Polish: 101 (7.4%)
- French Canadian: 39 (2.9%)
- English: 37 (2.7%)
- Yugoslavian: 29 (2.1%)
- American: 11 (0.8%)
- European: 9 (0.7%)
- Scottish: 8 (0.6%)
- Swedish: 8 (0.6%)
- Dutch: 7 (0.5%)
- Northern European: 7 (0.5%)
- French: 5 (0.4%)
Most common places of birth for foreign-born residents (%):
| Lyncourt: | 49.2% (156) |
| New York: | 2.6% (117,288) |
| Lyncourt: | 11.0% (35) |
| New York: | 0.6% (25,517) |
| Lyncourt: | 11.0% (35) |
| New York: | 0.1% (3,340) |
| Lyncourt: | 10.4% (33) |
| New York: | 0.2% (9,472) |
| Lyncourt: | 5.0% (16) |
| New York: | 1.8% (81,374) |
| Lyncourt: | 2.8% (9) |
| New York: | 0.1% (4,282) |
| Lyncourt: | 2.5% (8) |
| New York: | 0.8% (33,869) |
| Lyncourt: | 2.2% (7) |
| New York: | 0.1% (3,762) |
Place of birth for U.S.-born residents:
- This state: 3,138
- Other state: 436
- Northeast: 151
- Midwest: 49
- South: 156
- West: 81
90.4% of Lyncourt residents lived in the same house 1 years ago.
Out of people who lived in different houses, 44.7% lived in this county.
Out of people who lived in different counties, 0.0% lived in New York.
| Lyncourt: | 90.4% |
| State average: | 89.6% |
Education attainment for males 25 years and older:
- No schooling: 41
- Nursery to 4th grade: 0
- 5th and 6th grade: 7
- 7th and 8th grade: 0
- 9th grade: 0
- 10th grade: 2
- 11th grade: 4
- 12th grade, no diploma: 112
- High school graduate (or equivalency): 351
- Less than 1 year of college: 58
- Some college more than 1 year, no degree: 169
- Associate degree: 191
- Bachelor's degree: 206
- Master's degree: 55
- Professional school degree: 0
- Doctorate degree: 0

Education attainment for females 25 years and older:
- No schooling: 27
- Nursery to 4th grade: 8
- 5th and 6th grade: 9
- 7th and 8th grade: 0
- 9th grade: 3
- 10th grade: 13
- 11th grade: 7
- 12th grade, no diploma: 0
- High school graduate (or equivalency): 608
- Less than 1 year of college: 43
- Some college more than 1 year, no degree: 116
- Associate degree: 199
- Bachelor's degree: 229
- Master's degree: 112
- Professional school degree: 0
- Doctorate degree: 0


Housing units in structures:
- One, detached: 1,075
- One, attached: 119
- Two: 278
- 3 or 4: 52
- 5 to 9: 39
- 10 to 19: 184
- 50 or more: 47
House/condo owner moved in on average 14 years ago
Renter moved in on average 5 years ago

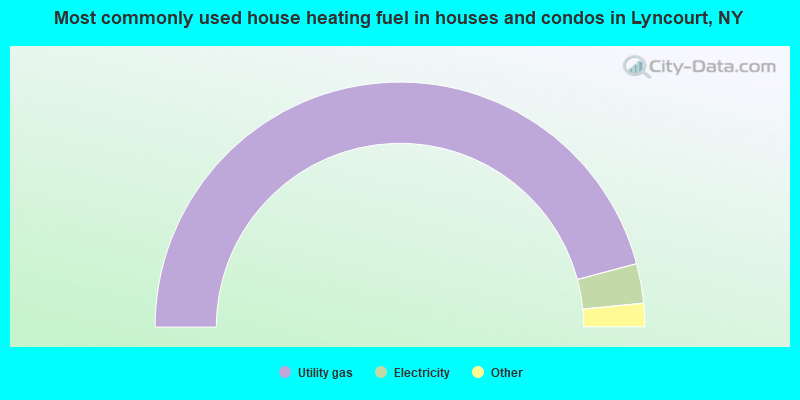
- 91.7%Utility gas
- 5.2%Electricity
- 1.8%Other fuel
- 1.3%Bottled, tank, or LP gas
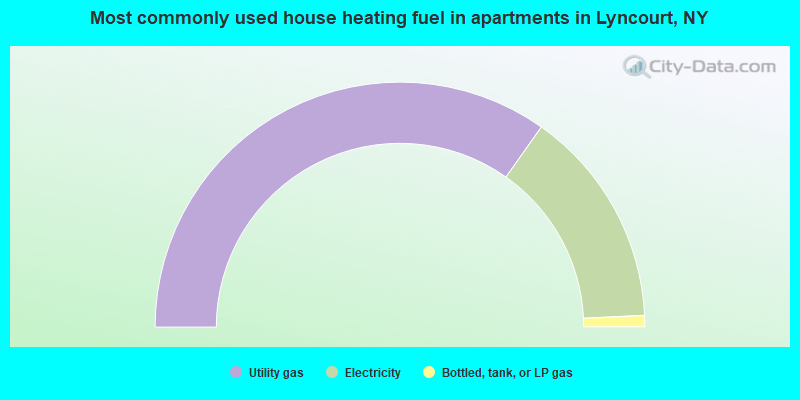
- 69.6%Utility gas
- 28.9%Electricity
- 1.5%Bottled, tank, or LP gas
Private vs. public school enrollment:
| Here: | 3.8% |
| New York: | 15.6% |
| Here: | 3.9% |
| New York: | 15.0% |
| Here: | 22.6% |
| New York: | 39.2% |


