Lyndhurst, OH (Ohio) Houses and Residents
| Lyndhurst: | $197,007 |
| Ohio: | $204,100 |
Mean price in 2022:
Detached houses: $207,179
Here: $207,179 State: $254,366 Townhouses or other attached units: $230,750
Here: $230,750 State: $225,733 In 5-or-more-unit structures: $216,927
Here: $216,927 State: $211,593
Total population: 13,733 (All urban)
Houses: 7,176 (6,648 occupied: 5,128 owner occupied, 1,559 renter occupied)
| % of renters here: | 23% |
| State: | 33% |
Housing density: 1,634 houses/condos per square mile
Median price asked for vacant for-sale houses and condos in 2022: $281,835.
Median contract rent in 2022: $1,245 (lower quartile is $1,055, upper quartile is $1,522)
Median rent asked for vacant for-rent units in 2022: $4,246
Median gross rent in Lyndhurst, OH in 2022: $1,415
Housing units in Lyndhurst with a mortgage: 3,499 (340 second mortgage, 13 home equity loan, 287 both second mortgage and home equity loan)
Houses without a mortgage: 323
Median household income for houses/condos with a mortgage: $106,287
Median household income for apartments without a mortgage: $75,538
Median monthly housing costs: $1,337
Compare current foreclosures near Lyndhurst, OH:
| Photo | Address | Area | Beds / Baths | Price | Details |
|---|---|---|---|---|---|

|
#1
E 128th St
Cleveland, OH 44120
|
1,894 sq. feet
|
1 baths 4 beds |
$44,900
|
show details |

|
#2
Alton Rd
Wickliffe, OH 44092
|
936 sq. feet
|
1 baths 3 beds |
$159,900
|
show details |

|
#3
Wellner Rd
Eastlake, OH 44095
|
1,030 sq. feet
|
2 baths 3 beds |
$194,900
|
show details |

|
#4
Clearview Rd
Chesterland, OH 44026
|
4,317 sq. feet
|
2 baths 4 beds |
$291,200
|
show details |

|
#5
Wilmington Rd
Cleveland, OH 44121
|
1,278 sq. feet
|
1 baths 3 beds |
$134,900
|
show details |

|
#6
E 147th St
Cleveland, OH 44120
|
2,360 sq. feet
|
3 baths 5 beds |
$22,500
|
show details |

|
#7
Miller Ave
Cleveland, OH 44119
|
830 sq. feet
|
1 baths 2 beds |
$149,900
|
show details |

|
#8
E 134th St
Cleveland, OH 44105
|
1,549 sq. feet
|
1 baths 3 beds |
$129,900
|
show details |

|
#9
Arcade Ave
Cleveland, OH 44110
|
2,036 sq. feet
|
2 baths 4 beds |
$8,500
|
show details |

|
#10
E 128th St
Cleveland, OH 44120
|
2,590 sq. feet
|
3 baths 5 beds |
$22,500
|
show details |
| Photo | Address | Area | Beds / Baths | Price | Details |
|---|---|---|---|---|---|

|
#11
Maryland Ave
Cleveland, OH 44105
|
1,908 sq. feet
|
2 baths 4 beds |
$29,900
|
show details |

|
#12
E 97th St
Cleveland, OH 44105
|
- sq. feet
|
1 baths 5 beds |
$62,400
|
show details |

|
#13
Snow Rd
Burton, OH 44021
|
2,200 sq. feet
|
1 baths 4 beds |
$369,900
|
show details |

|
#14
Pawnee Ave
Cleveland, OH 44119
|
1,884 sq. feet
|
2 baths 4 beds |
show details | |

|
#15
Daleford Rd
Cleveland, OH 44120
|
3,164 sq. feet
|
3 baths 6 beds |
show details | |

|
#16
Van Aken Blvd Apt 207
Beachwood, OH 44122
|
798 sq. feet
|
1 baths 2 beds |
show details | |

|
#17
Royal Oak Blvd
Cleveland, OH 44143
|
1,747 sq. feet
|
2 baths 3 beds |
show details | |

|
#18
E 86th St
Cleveland, OH 44106
|
2,319 sq. feet
|
3 baths 4 beds |
show details | |

|
#19
Throckley Ave
Cleveland, OH 44128
|
1,440 sq. feet
|
1 baths 3 beds |
show details | |

|
#20
S Green Rd
Cleveland, OH 44121
|
1,096 sq. feet
|
1 baths 3 beds |
show details |
| Photo | Address | Area | Beds / Baths | Price | Details |
|---|---|---|---|---|---|

|
#21
Southland Dr
Mentor, OH 44060
|
1,170 sq. feet
|
1 baths 3 beds |
show details | |

|
#22
Tampa Ave
Cleveland, OH 44109
|
1,155 sq. feet
|
2 baths 3 beds |
show details | |

|
#23
Glenshire Rd
Bedford, OH 44146
|
1,708 sq. feet
|
2 baths 3 beds |
show details | |

|
#24
W 135th St
Cleveland, OH 44111
|
1,645 sq. feet
|
2 baths 3 beds |
show details | |

|
#25
Oxford Dr
Cleveland, OH 44129
|
1,562 sq. feet
|
1 baths 3 beds |
show details | |

|
#26
Ohio Ave
Cleveland, OH 44128
|
900 sq. feet
|
1 baths 3 beds |
show details | |

|
#27
Genesee Rd
Euclid, OH 44117
|
1,248 sq. feet
|
1 baths 3 beds |
show details | |

|
#28
West 5th
Cleveland, OH 44113
|
3,341 sq. feet
|
4 baths 4 beds |
show details | |

|
#29
Dove Ave
Cleveland, OH 44105
|
1,455 sq. feet
|
2 baths 3 beds |
show details | |

|
#30
Starlight Dr
Independence, OH 44131
|
1,838 sq. feet
|
2 baths 3 beds |
show details |
| Photo | Address | Area | Beds / Baths | Price | Details |
|---|---|---|---|---|---|

|
#31
Bennington Ave
Cleveland, OH 44135
|
960 sq. feet
|
1 baths 3 beds |
show details | |

|
#32
Hillcrest Dr
Euclid, OH 44117
|
1,428 sq. feet
|
2 baths 3 beds |
show details | |

|
#33
E 223rd St
Euclid, OH 44117
|
1,352 sq. feet
|
1 baths 3 beds |
show details | |

|
#34
Thornwood Ave
Cleveland, OH 44108
|
1,228 sq. feet
|
1 baths 3 beds |
show details | |

|
#35
E 137th St
Cleveland, OH 44120
|
1,851 sq. feet
|
1 baths 4 beds |
show details | |

|
#36
Coventry Dr
Cleveland, OH 44134
|
2,234 sq. feet
|
1 baths 3 beds |
show details | |

|
#37
Ellison Rd
Cleveland, OH 44121
|
1,498 sq. feet
|
1 baths 3 beds |
show details | |

|
#38
Akron St
Chagrin Falls, OH 44023
|
1,228 sq. feet
|
1 baths 3 beds |
show details | |

|
#39
Invermere Ave
Cleveland, OH 44128
|
2,444 sq. feet
|
2 baths 3 beds |
show details | |

|
#40
E 79th St
Cleveland, OH 44103
|
1,744 sq. feet
|
1 baths 4 beds |
show details |
| Photo | Address | Area | Beds / Baths | Price | Details |
|---|---|---|---|---|---|

|
#41
E 142nd St
Cleveland, OH 44128
|
711 sq. feet
|
1 baths 2 beds |
show details | |

|
#42
Homewood Dr
Wickliffe, OH 44092
|
1,328 sq. feet
|
1 baths 3 beds |
show details | |

|
#43
S Noble Rd
Cleveland, OH 44121
|
1,020 sq. feet
|
1 baths 3 beds |
show details | |

|
#44
Keyes Ave
Cleveland, OH 44104
|
1,253 sq. feet
|
2 baths 4 beds |
show details | |

|
#45
E 74th St
Cleveland, OH 44103
|
2,552 sq. feet
|
2 baths 6 beds |
show details | |

|
#46
Lucknow Ave
Cleveland, OH 44110
|
1,970 sq. feet
|
2 baths 4 beds |
show details | |

|
#47
Palmetto Ave
Bedford, OH 44146
|
1,068 sq. feet
|
1 baths 3 beds |
show details | |

|
#48
Saratoga Ave
Cleveland, OH 44109
|
1,125 sq. feet
|
1 baths 3 beds |
show details | |

|
#49
Euclid Ave
Cleveland, OH 44112
|
2,215 sq. feet
|
3 baths 3 beds |
show details | |

|
Check over 1 million property listings on Foreclosure.com!
|
browse all offers | |||

Latest news about housing in Lyndhurst, OH collected exclusively by city-data.com from local newspapers, TV, and radio stations

 | Housing Market for $500k+ Homes (38 replies) |
| Downtown Apartments 2020 (46 replies) |
| Georgetown Condos in Lyndhurst (0 replies) |
| Cleveland's Real Estate Market is driving us crazy. (24 replies) |
| Friend looking for apartment in Cleveland - advice? (6 replies) |
| Houses around Cleveland Heights? Or are there better options? (21 replies) |

Median year apartment built: 1965
Household type by relationship:
Households: 13,723- Male householders: 2,835 (692 living alone), Female householders: 3,712 (1,840 living alone)
2,864 spouses (2,864 opposite-sex spouses), 403 unmarried partners, (403 opposite-sex unmarried partners), 3,274 children (3,044 natural, 89 adopted, 140 stepchildren), 126 grandchildren, 39 brothers or sisters, 111 parents, 0 foster children, 45 other relatives, 116 non-relatives
- In group quarters: 194
Size of family households: 2,263 2-persons, 848 3-persons, 461 4-persons, 185 5-persons, 29 6-persons, 24 7-or-more-persons.
Size of nonfamily households: 2,550 1-person, 324 2-persons, 9 4-persons.
1,514 married couples with children.
544 single-parent households (182 men, 362 women).
90.9% of residents of Lyndhurst speak English at home.
0.7% of residents speak Spanish at home (100% speak English very well).
5.2% of residents speak other Indo-European language at home (59% speak English very well, 36% speak English well, 5% speak English not well).
1.2% of residents speak Asian or Pacific Island language at home (68% speak English very well, 4% speak English well, 28% speak English not well).
3.1% of residents speak other language at home (87% speak English very well, 13% speak English well).
Foreign born population: 1,154 (8.4%)
(67.8% of them are naturalized citizens)
| Here: | 7.0 |
| State: | 6.7 |
| Here: | 4.9 |
| State: | 4.4 |

- Bedrooms in owner-occupied houses and condos in Lyndhurst, Ohio
- 0no bedroom
- 1501 bedroom
- 6892 bedrooms
- 2,5893 bedrooms
- 1,6134 bedrooms
- 875+ bedrooms

- Bedrooms in renter-occupied apartments in Lyndhurst, Ohio
- 28no bedroom
- 1911 bedroom
- 6842 bedrooms
- 4023 bedrooms
- 1874 bedrooms
- 675+ bedrooms

- Cars and other vehicles available in Lyndhurst in owner-occupied houses/condos
- 168no vehicle
- 1,8671 vehicle
- 2,6172 vehicles
- 3353 vehicles
- 1114 vehicles
- 325+ vehicles

- Cars and other vehicles available in Lyndhurst in renter-occupied apartments
- 400no vehicle
- 6651 vehicle
- 3962 vehicles
- 983 vehicles
- 04 vehicles
- 05+ vehicles

- Rooms in owner-occupied houses in Lyndhurst, Ohio
- 01 room
- 02 rooms
- 773 rooms
- 2374 rooms
- 5435 rooms
- 1,2206 rooms
- 1,0817 rooms
- 9478 rooms
- 1,0249+ rooms

- Rooms in renter-occupied apartments in Lyndhurst, Ohio
- 281 room
- 82 rooms
- 1223 rooms
- 5204 rooms
- 1945 rooms
- 1886 rooms
- 1517 rooms
- 1558 rooms
- 1949+ rooms


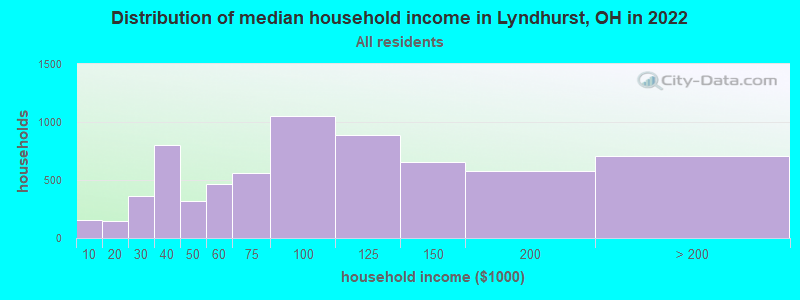
Lyndhurst, OH household income distribution

- 155Less than $10,000
- 147$10,000 to $19,999
- 364$20,000 to $29,999
- 801$30,000 to $39,999
- 315$40,000 to $49,999
- 464$50,000 to $59,999
- 562$60,000 to $74,999
- 1,054$75,000 to $99,999
- 891$100,000 to $124,999
- 656$125,000 to $149,999
- 575$150,000 to $199,999
- 703$200,000 or more
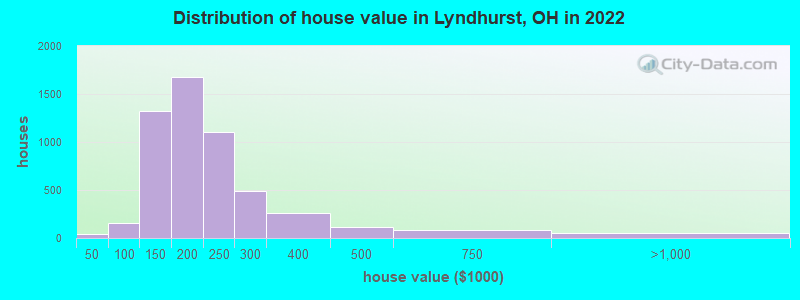
Home value of owner - occupied houses in 2022 in Lyndhurst, OH
-
- 16$10,000 to $14,999
- 22$20,000 to $24,999
- 4$50,000 to $59,999
- 49$60,000 to $69,999
- 55$70,000 to $79,999
- 6$80,000 to $89,999
- 39$90,000 to $99,999
- 522$100,000 to $124,999
- 804$125,000 to $149,999
- 885$150,000 to $174,999
- 796$175,000 to $199,999
- 1,107$200,000 to $249,999
- 489$250,000 to $299,999
- 262$300,000 to $399,999
- 110$400,000 to $499,999
- 78$500,000 to $749,999
- 47$750,000 to $999,999
Rent paid by renters in 2022 in Lyndhurst, OH
-
- 8$350 to $399
- 24$750 to $799
- 189$800 to $899
- 55$900 to $999
- 516$1,000 to $1,249
- 475$1,250 to $1,499
- 279$1,500 to $1,999
- 18$2,000 to $2,499
- 66No cash rent


Percentage of workers working in this county: 85.9%
Number of people working at home: 1,590 (22.1% of all workers)
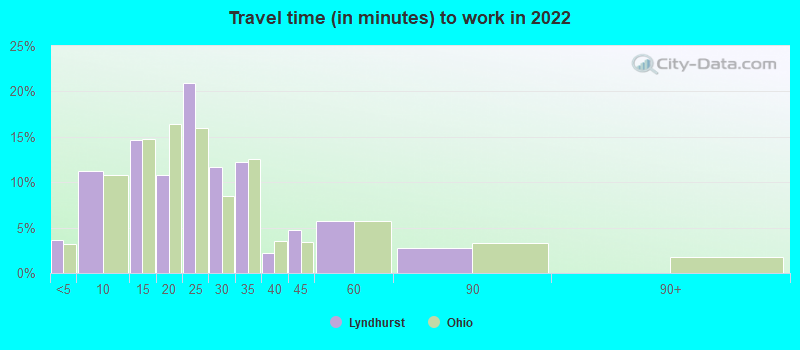
Travel time to work (commute)
- Less than 5 minutes: 137
- 5 to 9 minutes: 521
- 10 to 14 minutes: 883
- 15 to 19 minutes: 1,123
- 20 to 24 minutes: 1,108
- 25 to 29 minutes: 579
- 30 to 34 minutes: 604
- 35 to 39 minutes: 196
- 40 to 44 minutes: 170
- 45 to 59 minutes: 344
- 60 to 89 minutes: 81
- 90 or more minutes: 12
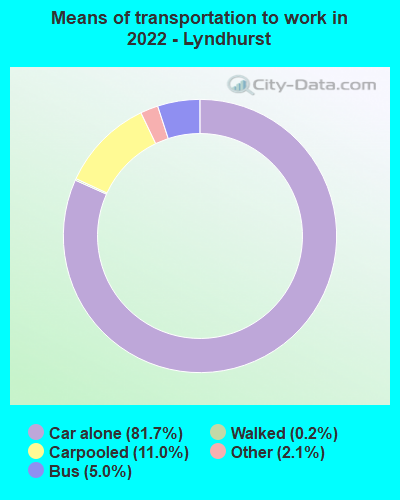
Means of transportation to work:
- Drove a car alone: 3,514 (62.3%)
- Carpooled: 477 (8.5%)
- Bus: 186 (3.3%)
- Taxi: 95 (1.7%)
- Walked: 10 (0.2%)
- Worked at home: 1,590 (28.2%)

- Unemployment by race in 2022
- Unemployment rate for White non-Hispanic residents
- 1.4%Males
- 1.7%Females
- Unemployment rate for Black residents
- 19.2%Males
- 1.8%Females

- Year of entry for the foreign-born population in Lyndhurst, Ohio
- 1972010 or later
- 1082000 to 2009
- 3291990 to 1999
- 971980 to 1989
- 1661970 to 1979
- 412Before 1970
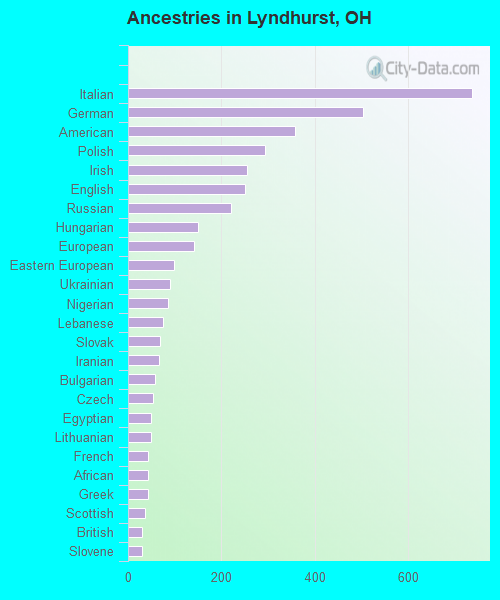
First ancestries reported:
- Italian: 737 (12.4%)
- German: 503 (8.5%)
- American: 358 (6.0%)
- Polish: 293 (4.9%)
- Irish: 256 (4.3%)
- English: 251 (4.2%)
- Russian: 221 (3.7%)
- Hungarian: 149 (2.5%)
- European: 141 (2.4%)
- Eastern European: 98 (1.6%)
- Ukrainian: 91 (1.5%)
- Nigerian: 86 (1.4%)
- Lebanese: 74 (1.2%)
- Slovak: 68 (1.1%)
- Iranian: 66 (1.1%)
- Bulgarian: 58 (1.0%)
- Czech: 54 (0.9%)
- Egyptian: 50 (0.8%)
- Lithuanian: 49 (0.8%)
- French: 43 (0.7%)
- African: 43 (0.7%)
- Greek: 42 (0.7%)
- Scottish: 36 (0.6%)
- British: 29 (0.5%)
- Slovene: 29 (0.5%)
- Serbian: 21 (0.4%)
- Czechoslovakian: 16 (0.3%)
- Dutch: 16 (0.3%)
- Scotch-Irish: 16 (0.3%)
- Swedish: 11 (0.2%)
- Austrian: 10 (0.2%)
- Jamaican: 7 (0.1%)
- Croatian: 6 (0.1%)
- Romanian: 4 (0.07%)
- Portuguese: 3 (0.05%)
- Ugandan: 1 (0.02%)
Most common places of birth for foreign-born residents (%):
| Lyndhurst: | 10.1% (121) |
| Ohio: | 1.7% (9,564) |
| Lyndhurst: | 8.3% (99) |
| Ohio: | 1.2% (7,029) |
| Lyndhurst: | 8.2% (98) |
| Ohio: | 0.8% (4,651) |
| Lyndhurst: | 7.4% (89) |
| Ohio: | 1.5% (8,452) |
| Lyndhurst: | 7.1% (85) |
| Ohio: | 6.2% (35,703) |
| Lyndhurst: | 5.0% (60) |
| Ohio: | 0.7% (4,155) |
| Lyndhurst: | 5.0% (60) |
| Ohio: | 0.9% (5,422) |
| Lyndhurst: | 4.8% (57) |
| Ohio: | 0.2% (1,151) |
| Lyndhurst: | 4.6% (55) |
| Ohio: | 0.6% (3,552) |
| Lyndhurst: | 4.4% (53) |
| Ohio: | 2.2% (12,846) |
| Lyndhurst: | 3.2% (38) |
| Ohio: | 11.6% (66,525) |
| Lyndhurst: | 2.8% (33) |
| Ohio: | 1.2% (6,679) |
| Lyndhurst: | 2.4% (29) |
| Ohio: | 0.2% (1,179) |
| Lyndhurst: | 2.3% (27) |
| Ohio: | 0.7% (3,862) |
| Lyndhurst: | 2.1% (25) |
| Ohio: | 0.7% (3,842) |
| Lyndhurst: | 2.0% (24) |
| Ohio: | 3.1% (17,818) |
| Lyndhurst: | 1.8% (22) |
| Ohio: | 0.5% (2,690) |
| Lyndhurst: | 1.8% (22) |
| Ohio: | 1.0% (5,444) |
| Lyndhurst: | 1.6% (19) |
| Ohio: | 0.4% (2,185) |
| Lyndhurst: | 1.5% (18) |
| Ohio: | 0.3% (1,754) |
Place of birth for U.S.-born residents:
- This state: 9,845
- Other state: 2,586
- Northeast: 1,077
- Midwest: 629
- South: 612
- West: 287
88.8% of Lyndhurst residents lived in the same house 1 years ago.
Out of people who lived in different houses, 32.8% lived in this county.
Out of people who lived in different counties, 64.4% lived in Ohio.
| Lyndhurst: | 88.8% |
| State average: | 87.8% |
Education attainment for males 25 years and older:
- No schooling: 8
- Nursery to 4th grade: 0
- 5th and 6th grade: 0
- 7th and 8th grade: 12
- 9th grade: 21
- 10th grade: 17
- 11th grade: 60
- 12th grade, no diploma: 36
- High school graduate (or equivalency): 586
- Less than 1 year of college: 128
- Some college more than 1 year, no degree: 508
- Associate degree: 343
- Bachelor's degree: 1,749
- Master's degree: 800
- Professional school degree: 457
- Doctorate degree: 79

Education attainment for females 25 years and older:
- No schooling: 16
- Nursery to 4th grade: 7
- 5th and 6th grade: 8
- 7th and 8th grade: 16
- 9th grade: 0
- 10th grade: 28
- 11th grade: 15
- 12th grade, no diploma: 53
- High school graduate (or equivalency): 1,258
- Less than 1 year of college: 291
- Some college more than 1 year, no degree: 605
- Associate degree: 367
- Bachelor's degree: 2,219
- Master's degree: 1,034
- Professional school degree: 258
- Doctorate degree: 165


Housing units in structures:
- One, detached: 5,777
- One, attached: 120
- Two: 38
- 3 or 4: 46
- 5 to 9: 350
- 10 to 19: 64
- 20 to 49: 117
- 50 or more: 658
Housing units lacking complete kitchen facilities in 2022: 2.5%
House/condo owner moved in on average 11 years ago
Renter moved in on average 3 years ago

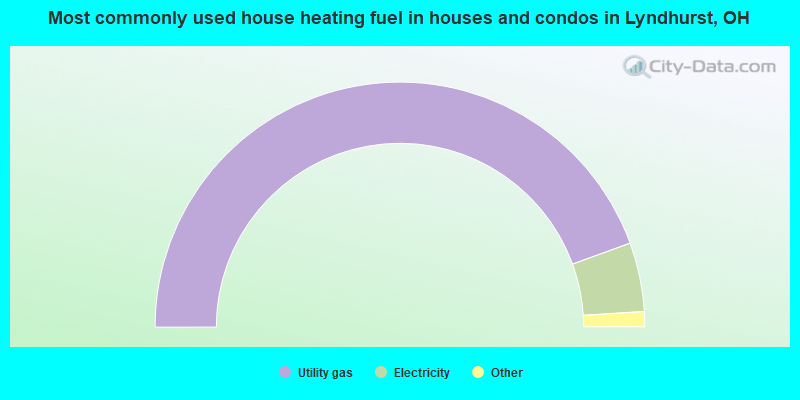
- 88.9%Utility gas
- 9.1%Electricity
- 1.7%Bottled, tank, or LP gas
- 0.3%Coal or coke
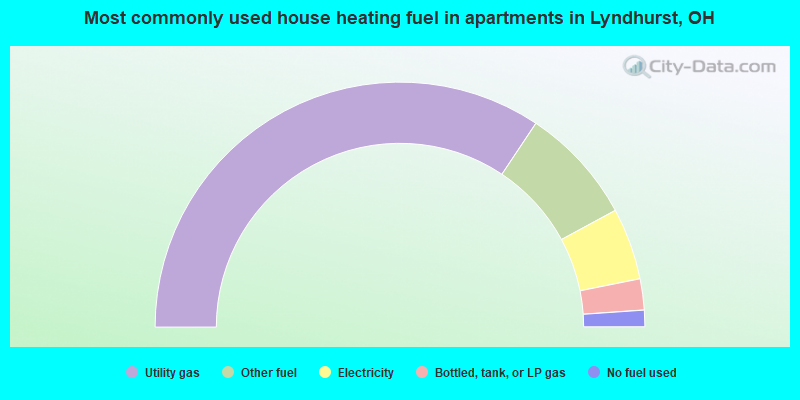
- 68.8%Utility gas
- 15.5%Other fuel
- 9.5%Electricity
- 4.1%Bottled, tank, or LP gas
- 2.2%No fuel used
Private vs. public school enrollment:
| Here: | 49.6% |
| Ohio: | 16.0% |
| Here: | 45.9% |
| Ohio: | 13.1% |
| Here: | 8.3% |
| Ohio: | 22.3% |


