Lynnview, KY (Kentucky) Houses and Residents
| Lynnview: | $138,722 |
| Kentucky: | $196,300 |
Mean price in 2022:
Detached houses: $148,238
Here: $148,238 State: $256,452
Total population: 937 (All urban)
Houses: 336 (313 occupied: 245 owner occupied, 75 renter occupied)
| % of renters here: | 23% |
| State: | 31% |
Housing density: 1,787 houses/condos per square mile
Median price asked for vacant for-sale houses and condos in 2022 in this county: $108,908.
Median contract rent in 2022: $1,020 (lower quartile is $914, upper quartile is $1,181)
Median rent asked for vacant for-rent units in 2022: $1,269
Median gross rent in Lynnview, KY in 2022: $1,216
Housing units in Lynnview with a mortgage: 158 (21 second mortgage, 0 home equity loan, 14 both second mortgage and home equity loan)
Houses without a mortgage: 0
Median household income for houses/condos with a mortgage: $57,392
Median household income for apartments without a mortgage: $51,865
Median monthly housing costs: $981
Compare current foreclosures near Lynnview, KY:
| Photo | Address | Area | Beds / Baths | Price | Details |
|---|---|---|---|---|---|

|
#1
Doe Run Way
New Albany, IN 47150
|
1,380 sq. feet
|
2 baths 3 beds |
$285,000
|
show details |

|
#2
Cedrus Cir
Louisville, KY 40213
|
1,187 sq. feet
|
2 baths 4 beds |
$180,000
|
show details |

|
#3
Melody Way
Louisville, KY 40299
|
1,242 sq. feet
|
1 baths 3 beds |
$300,000
|
show details |

|
#4
Chillicoop Rd
Shepherdsville, KY 40165
|
- sq. feet
|
2 baths 4 beds |
$99,900
|
show details |

|
#5
Cross Rd
Louisville, KY 40204
|
2,696 sq. feet
|
2 baths 2 beds |
show details | |

|
#6
Burrell Dr
Louisville, KY 40216
|
1,170 sq. feet
|
1 baths 3 beds |
show details | |

|
#7
Morris Ave
Jeffersonville, IN 47130
|
1,320 sq. feet
|
1 baths 3 beds |
show details | |

|
#8
Roosevelt Ave
Louisville, KY 40213
|
- sq. feet
|
1 baths 4 beds |
show details | |

|
#9
Fieldstone Ct
New Albany, IN 47150
|
1,276 sq. feet
|
2 baths 3 beds |
show details | |

|
#10
Welch Dr
Louisville, KY 40272
|
740 sq. feet
|
1 baths 2 beds |
show details |
| Photo | Address | Area | Beds / Baths | Price | Details |
|---|---|---|---|---|---|

|
#11
Redbud Dr
New Albany, IN 47150
|
1,080 sq. feet
|
1 baths 3 beds |
show details | |

|
#12
S Bayly Ave
Louisville, KY 40206
|
2,610 sq. feet
|
2 baths 2 beds |
show details | |

|
#13
S 5th St
Louisville, KY 40214
|
1,008 sq. feet
|
1 baths 3 beds |
show details | |

|
#14
Breckenridge Ln
Louisville, KY 40218
|
1,472 sq. feet
|
1 baths 2 beds |
show details | |

|
#15
S Clark Blvd
Clarksville, IN 47129
|
2,304 sq. feet
|
2 baths 3 beds |
show details | |

|
#16
Sunset Ln
Crestwood, KY 40014
|
2,574 sq. feet
|
3 baths 4 beds |
show details | |

|
#17
Eastside Ave
Sellersburg, IN 47172
|
1,266 sq. feet
|
1 baths 3 beds |
show details | |

|
#18
S 42nd St
Louisville, KY 40211
|
1,078 sq. feet
|
1 baths 1 beds |
show details | |

|
#19
Maddie Ln
Shepherdsville, KY 40165
|
- sq. feet
|
2 baths 4 beds |
show details | |

|
#20
W Chestnut St
Louisville, KY 40203
|
1,568 sq. feet
|
3 baths 3 beds |
show details |
| Photo | Address | Area | Beds / Baths | Price | Details |
|---|---|---|---|---|---|

|
#21
Glass Overlook Rd SE
Elizabeth, IN 47117
|
1,453 sq. feet
|
1 baths 1 beds |
show details | |

|
#22
Greenlawn Dr
New Albany, IN 47150
|
1,252 sq. feet
|
1 baths 3 beds |
show details | |

|
#23
Higgins Dr
Jeffersonville, IN 47130
|
850 sq. feet
|
1 baths 3 beds |
show details | |

|
#24
Pennsylvania Ave
Jeffersonville, IN 47130
|
984 sq. feet
|
1 baths 3 beds |
show details | |

|
#25
Probus Dr
Mount Washington, KY 40047
|
1,050 sq. feet
|
1 baths 3 beds |
show details | |

|
#26
Raintree Rdg
Jeffersonville, IN 47130
|
2,628 sq. feet
|
2 baths 3 beds |
show details | |

|
#27
Webster Blvd
Jeffersonville, IN 47130
|
925 sq. feet
|
1 baths 3 beds |
show details | |

|
#28
Holmans Ln
Jeffersonville, IN 47130
|
1,206 sq. feet
|
1 baths 3 beds |
show details | |

|
#29
Cameron Dr
Jeffersonville, IN 47130
|
1,107 sq. feet
|
1 baths 3 beds |
show details | |

|
#30
Pennwood Dr
New Albany, IN 47150
|
2,372 sq. feet
|
2 baths 4 beds |
show details |
| Photo | Address | Area | Beds / Baths | Price | Details |
|---|---|---|---|---|---|

|
#31
Boiling Spring Rd
New Albany, IN 47150
|
960 sq. feet
|
1 baths 2 beds |
show details | |

|
#32
Overlook Rd
Louisville, KY 40229
|
900 sq. feet
|
1 baths 3 beds |
show details | |

|
#33
Dale Rd
Louisville, KY 40229
|
1,093 sq. feet
|
1 baths 4 beds |
show details | |

|
#34
Boaz Ln
Mount Washington, KY 40047
|
2,002 sq. feet
|
2 baths 3 beds |
show details | |

|
#35
Tecumseh Dr
Shepherdsville, KY 40165
|
1,122 sq. feet
|
2 baths 3 beds |
show details | |

|
#36
Blackiston View Dr
Clarksville, IN 47129
|
1,553 sq. feet
|
2 baths 3 beds |
show details | |

|
#37
Julian Dr
New Albany, IN 47150
|
1,620 sq. feet
|
2 baths 3 beds |
show details | |

|
#38
Idlewood Dr
Clarksville, IN 47129
|
988 sq. feet
|
1 baths 3 beds |
show details | |

|
#39
Overlook Rd
Louisville, KY 40229
|
900 sq. feet
|
1 baths 3 beds |
show details | |

|
#40
Wilma Ave
Louisville, KY 40229
|
2,044 sq. feet
|
1 baths 4 beds |
show details |
| Photo | Address | Area | Beds / Baths | Price | Details |
|---|---|---|---|---|---|

|
#41
Garden Ct
Shepherdsville, KY 40165
|
1,521 sq. feet
|
2 baths 3 beds |
show details | |

|
#42
Sunny Hill Dr
Shepherdsville, KY 40165
|
1,507 sq. feet
|
2 baths 3 beds |
show details | |

|
#43
Budd Rd
New Albany, IN 47150
|
2,240 sq. feet
|
1 baths 3 beds |
show details | |

|
#44
Lone Oak Dr
New Albany, IN 47150
|
1,160 sq. feet
|
1 baths 3 beds |
show details | |

|
#45
Idlewood Ct
Clarksville, IN 47129
|
1,256 sq. feet
|
1 baths 3 beds |
show details | |

|
#46
Slate Run Rd
New Albany, IN 47150
|
1,067 sq. feet
|
1 baths 2 beds |
show details | |

|
#47
Cliftwood Dr
Clarksville, IN 47129
|
1,161 sq. feet
|
1 baths 3 beds |
show details | |

|
#48
Cheryl Dr
Clarksville, IN 47129
|
832 sq. feet
|
1 baths 3 beds |
show details | |

|
#49
Pratt St # 1
Jeffersonville, IN 47130
|
1,760 sq. feet
|
2 baths 4 beds |
show details | |

|
Check over 1 million property listings on Foreclosure.com!
|
browse all offers | |||

Latest news about housing in Lynnview, KY collected exclusively by city-data.com from local newspapers, TV, and radio stations

 | I can't believe I might be moving to Louisville! (34 replies) |
| Updated ZIP Code profiles in CD - what's yours like? (11 replies) |

Median year apartment built: 1957
Household type by relationship:
Households: 636- Male householders: 155 (59 living alone), Female householders: 152 (60 living alone)
100 spouses (100 opposite-sex spouses), 17 unmarried partners, (17 opposite-sex unmarried partners), 136 children (121 natural, 5 adopted, 9 stepchildren), 8 grandchildren, 9 brothers or sisters, 10 parents, 0 foster children, 10 other relatives, 31 non-relatives
Size of family households: 102 2-persons, 27 3-persons, 28 4-persons, 2 5-persons, 3 6-persons.
Size of nonfamily households: 126 1-person, 32 2-persons, 2 3-persons.
50 married couples with children.
51 single-parent households (13 men, 38 women).
92.6% of residents of Lynnview speak English at home.
6.9% of residents speak Spanish at home (71% speak English very well, 12% speak English well, 10% speak English not well, 7% don't speak English at all).
0.2% of residents speak other Indo-European language at home (100% speak English very well).
0.5% of residents speak other language at home (100% speak English very well).
Foreign born population: 20 (3.1%)
(30.0% of them are naturalized citizens)
| Here: | 5.7 |
| State: | 6.4 |
| Here: | 5.0 |
| State: | 4.4 |

- Bedrooms in owner-occupied houses and condos in Lynnview, Kentucky
- 3no bedroom
- 61 bedroom
- 632 bedrooms
- 1203 bedrooms
- 434 bedrooms
- 95+ bedrooms

- Bedrooms in renter-occupied apartments in Lynnview, Kentucky
- 0no bedroom
- 01 bedroom
- 302 bedrooms
- 353 bedrooms
- 104 bedrooms
- 05+ bedrooms

- Cars and other vehicles available in Lynnview in owner-occupied houses/condos
- 18no vehicle
- 781 vehicle
- 982 vehicles
- 303 vehicles
- 94 vehicles
- 125+ vehicles

- Cars and other vehicles available in Lynnview in renter-occupied apartments
- 0no vehicle
- 491 vehicle
- 92 vehicles
- 163 vehicles
- 04 vehicles
- 05+ vehicles

- Rooms in owner-occupied houses in Lynnview, Kentucky
- 01 room
- 32 rooms
- 63 rooms
- 344 rooms
- 695 rooms
- 686 rooms
- 407 rooms
- 208 rooms
- 59+ rooms

- Rooms in renter-occupied apartments in Lynnview, Kentucky
- 01 room
- 02 rooms
- 03 rooms
- 184 rooms
- 375 rooms
- 106 rooms
- 107 rooms
- 08 rooms
- 09+ rooms


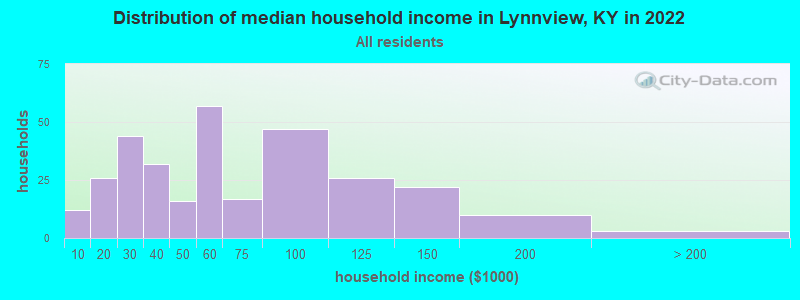
Lynnview, KY household income distribution

- 12Less than $10,000
- 26$10,000 to $19,999
- 44$20,000 to $29,999
- 32$30,000 to $39,999
- 16$40,000 to $49,999
- 57$50,000 to $59,999
- 17$60,000 to $74,999
- 47$75,000 to $99,999
- 26$100,000 to $124,999
- 22$125,000 to $149,999
- 10$150,000 to $199,999
- 3$200,000 or more
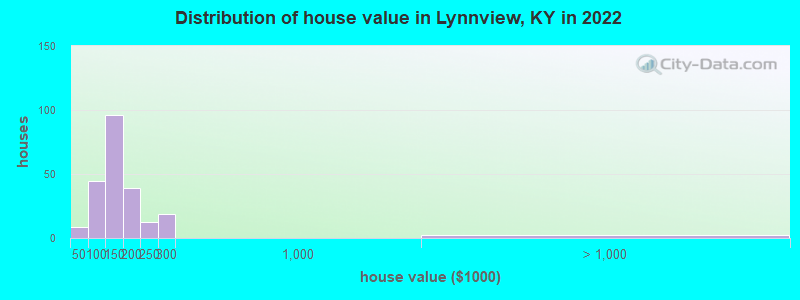
Home value of owner - occupied houses in 2022 in Lynnview, KY
-
- 2Less than $10,000
- 6$40,000 to $49,999
- 1$50,000 to $59,999
- 5$60,000 to $69,999
- 4$70,000 to $79,999
- 11$80,000 to $89,999
- 15$90,000 to $99,999
- 60$100,000 to $124,999
- 35$125,000 to $149,999
- 32$150,000 to $174,999
- 6$175,000 to $199,999
- 12$200,000 to $249,999
- 18$250,000 to $299,999
- 2$2,000,000 or more
Rent paid by renters in 2022 in Lynnview, KY
-
- 1$450 to $499
- 7$700 to $749
- 5$800 to $899
- 15$900 to $999
- 28$1,000 to $1,249
- 6$1,500 to $1,999
- 6No cash rent


Percentage of workers working in this county: 90.9%
Number of people working at home: 53 (15.0% of all workers)
Travel time to work (commute)
- Less than 5 minutes: 5
- 5 to 9 minutes: 41
- 10 to 14 minutes: 55
- 15 to 19 minutes: 39
- 20 to 24 minutes: 78
- 25 to 29 minutes: 33
- 30 to 34 minutes: 21
- 35 to 39 minutes: 6
- 40 to 44 minutes: 6
- 45 to 59 minutes: 0
- 60 to 89 minutes: 10
- 90 or more minutes: 3
Means of transportation to work:
- Drove a car alone: 376 (86.4%)
- Carpooled: 36 (8.3%)
- Bus or trolley bus: 6 (1.4%)
- Walked: 7 (1.6%)
- Other means: 3 (0.7%)
- Worked at home: 7 (1.6%)

- Unemployment by race in 2022
- Unemployment rate for White non-Hispanic residents
- 0.4%Males
- Unemployment rate for Hispanic or Latino residents
- 7.5%Males

- Year of entry for the foreign-born population in Lynnview, Kentucky
- 82010 or later
- 72000 to 2009
- 31990 to 1999
- 21980 to 1989
- 01970 to 1979
- 2Before 1970

First ancestries reported:
- German: 96 (35.1%)
- American: 51 (18.6%)
- English: 30 (11.0%)
- European: 13 (4.8%)
- Irish: 7 (2.6%)
- French: 4 (1.5%)
- Italian: 4 (1.5%)
- Dutch: 3 (1.1%)
- Scotch-Irish: 3 (1.1%)
- Swiss: 2 (0.7%)
- Polish: 1 (0.4%)
Most common places of birth for foreign-born residents (%):
| Lynnview: | 50.0% (11) |
| Kentucky: | 15.8% (29,070) |
| Lynnview: | 40.9% (9) |
| Kentucky: | 8.0% (14,652) |
Place of birth for U.S.-born residents:
- This state: 505
- Other state: 103
- Northeast: 1
- Midwest: 60
- South: 26
- West: 14
89.7% of Lynnview residents lived in the same house 1 years ago.
Out of people who lived in different houses, 44.0% lived in this county.
Out of people who lived in different counties, 33.3% lived in Kentucky.
| Lynnview: | 89.7% |
| State average: | 87.2% |
Education attainment for males 25 years and older:
- No schooling: 0
- Nursery to 4th grade: 0
- 5th and 6th grade: 0
- 7th and 8th grade: 1
- 9th grade: 1
- 10th grade: 6
- 11th grade: 6
- 12th grade, no diploma: 4
- High school graduate (or equivalency): 76
- Less than 1 year of college: 20
- Some college more than 1 year, no degree: 15
- Associate degree: 21
- Bachelor's degree: 46
- Master's degree: 21
- Professional school degree: 0
- Doctorate degree: 0

Education attainment for females 25 years and older:
- No schooling: 4
- Nursery to 4th grade: 0
- 5th and 6th grade: 0
- 7th and 8th grade: 0
- 9th grade: 2
- 10th grade: 3
- 11th grade: 0
- 12th grade, no diploma: 6
- High school graduate (or equivalency): 103
- Less than 1 year of college: 13
- Some college more than 1 year, no degree: 50
- Associate degree: 30
- Bachelor's degree: 40
- Master's degree: 2
- Professional school degree: 0
- Doctorate degree: 0


Housing units in structures:
- One, detached: 334
- Mobile homes: 2
House/condo owner moved in on average 13 years ago
Renter moved in on average 6 years ago

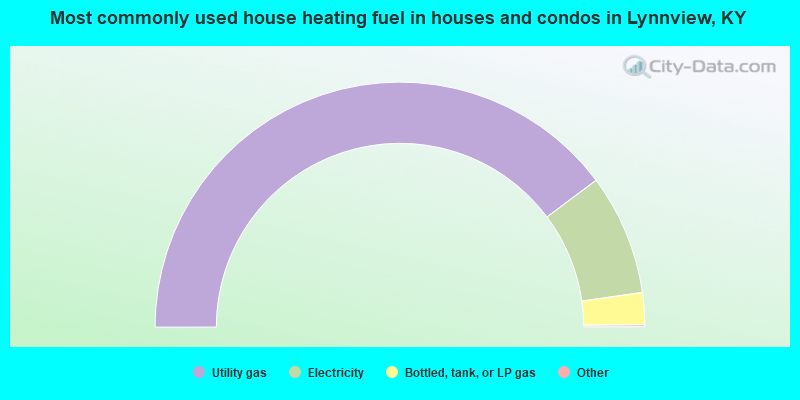
- 79.8%Utility gas
- 16.0%Electricity
- 4.2%Bottled, tank, or LP gas
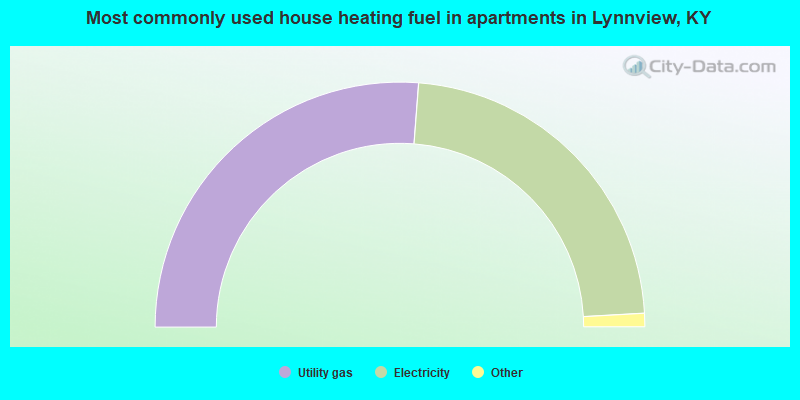
- 53.4%Utility gas
- 46.6%Electricity
Private vs. public school enrollment:
| Here: | 69.0% |
| Kentucky: | 17.2% |
| Here: | 50.0% |
| Kentucky: | 15.2% |
| Here: | 6.8% |
| Kentucky: | 19.6% |


