Lynnville, IA (Iowa) Houses and Residents
| Lynnville: | $136,627 |
| Iowa: | $194,600 |
Total population: 391 (Urban population: 0, Rural population: 384 (all nonfarm))
Houses: 221 (216 occupied: 178 owner occupied, 41 renter occupied)
| % of renters here: | 19% |
| State: | 28% |
Housing density: 367 houses/condos per square mile
Median price asked for vacant for-sale houses and condos in 2022 in this county: $105,956.
Median contract rent in 2022: $430 (lower quartile is $392, upper quartile is $579)
Median rent asked for vacant for-rent units in 2022: $706
Median gross rent in Lynnville, IA in 2022: $542
Housing units in Lynnville with a mortgage: 90 (15 second mortgage, 0 home equity loan, 13 both second mortgage and home equity loan)
Houses without a mortgage: 0
Median household income for houses/condos with a mortgage: $90,498
Median monthly housing costs: $614
Compare current foreclosures near Lynnville, IA:
| Photo | Address | Area | Beds / Baths | Price | Details |
|---|---|---|---|---|---|

|
#1
Terrace Dr
Otley, IA 50214
|
972 sq. feet
|
2 baths 2 beds |
show details | |

|
#2
University St Apt 1
Pella, IA 50219
|
- sq. feet
|
- baths - beds |
show details | |

|
#3
Rock Creek West St
Kellogg, IA 50135
|
- sq. feet
|
- baths - beds |
show details | |

|
#4
Washington St
Pella, IA 50219
|
- sq. feet
|
- baths - beds |
show details | |

|
#5
W 16th St Unit 106
Pella, IA 50219
|
- sq. feet
|
- baths - beds |
show details | |

|
#6
Oskaloosa St
Pella, IA 50219
|
- sq. feet
|
- baths - beds |
show details | |

|
#7
E 15th St N
Newton, IA 50208
|
- sq. feet
|
- baths - beds |
show details | |

|
#8
Hobart St
Grinnell, IA 50112
|
- sq. feet
|
- baths - beds |
show details | |

|
#9
Vintage Ln, Unit 15
Pella, IA 50219
|
- sq. feet
|
- baths - beds |
show details | |

|
#10
S 7th Ave E # 4
Newton, IA 50208
|
- sq. feet
|
- baths - beds |
show details |
| Photo | Address | Area | Beds / Baths | Price | Details |
|---|---|---|---|---|---|

|
#11
S 8th Ave W
Newton, IA 50208
|
- sq. feet
|
- baths - beds |
show details | |

|
#12
S 17th Ave W
Newton, IA 50208
|
- sq. feet
|
- baths - beds |
show details | |

|
#13
E North St
Monroe, IA 50170
|
- sq. feet
|
- baths - beds |
show details | |

|
#14
N 11th Ave E
Newton, IA 50208
|
- sq. feet
|
- baths - beds |
show details | |

|
#15
E 23rd St S
Newton, IA 50208
|
- sq. feet
|
- baths - beds |
show details | |

|
#16
N 6th Ave E
Newton, IA 50208
|
- sq. feet
|
- baths - beds |
show details | |

|
#17
N 2nd Ave E
Newton, IA 50208
|
- sq. feet
|
- baths - beds |
show details | |

|
#18
450th Ave
Grinnell, IA 50112
|
- sq. feet
|
- baths - beds |
show details | |

|
#19
S 28th Ave W
Newton, IA 50208
|
- sq. feet
|
- baths - beds |
show details | |

|
#20
E 3rd St S
Newton, IA 50208
|
- sq. feet
|
- baths - beds |
show details |
| Photo | Address | Area | Beds / Baths | Price | Details |
|---|---|---|---|---|---|

|
#21
S 3rd Ave E
Newton, IA 50208
|
- sq. feet
|
- baths - beds |
show details | |

|
#22
E 5th St N
Newton, IA 50208
|
- sq. feet
|
- baths - beds |
show details | |

|
#23
W 3rd St N
Newton, IA 50208
|
- sq. feet
|
- baths - beds |
show details | |

|
#24
N 4th Ave E
Newton, IA 50208
|
- sq. feet
|
- baths - beds |
show details | |

|
#25
E 17th St N
Newton, IA 50208
|
- sq. feet
|
- baths - beds |
show details | |

|
#26
S 6th Ave E
Newton, IA 50208
|
- sq. feet
|
- baths - beds |
show details | |

|
#27
E 8th St S
Newton, IA 50208
|
- sq. feet
|
- baths - beds |
show details | |

|
#28
Glenway Dr
Newton, IA 50208
|
- sq. feet
|
- baths - beds |
show details | |

|
#29
S 112th Ave E
Reasnor, IA 50232
|
- sq. feet
|
- baths - beds |
show details | |

|
#30
Holiday Ct
Newton, IA 50208
|
- sq. feet
|
- baths - beds |
show details |
| Photo | Address | Area | Beds / Baths | Price | Details |
|---|---|---|---|---|---|

|
#31
Highway 63
Malcom, IA 50157
|
- sq. feet
|
- baths - beds |
show details | |

|
#32
3rd Ave
Grinnell, IA 50112
|
- sq. feet
|
- baths - beds |
show details | |

|
#33
State St
Grinnell, IA 50112
|
- sq. feet
|
- baths - beds |
show details | |

|
#34
Water St
Kellogg, IA 50135
|
- sq. feet
|
- baths - beds |
show details | |

|
#35
State St
Grinnell, IA 50112
|
- sq. feet
|
- baths - beds |
show details | |

|
#36
Washington Pl
Grinnell, IA 50112
|
- sq. feet
|
- baths - beds |
show details | |

|
#37
Washington Pl
Grinnell, IA 50112
|
- sq. feet
|
- baths - beds |
show details | |

|
#38
Lincoln St
Newton, IA 50208
|
- sq. feet
|
- baths - beds |
show details | |

|
#39
N 16th Ave W
Newton, IA 50208
|
- sq. feet
|
- baths - beds |
show details | |

|
Check over 1 million property listings on Foreclosure.com!
|
browse all offers | |||


 | Rural property for rent-around Linnville,sully,etc (0 replies) |

Median year apartment built: 1946
Household type by relationship:
Households: 498- Male householders: 129 (68 living alone), Female householders: 84 (31 living alone)
100 spouses (100 opposite-sex spouses), 11 unmarried partners, (11 opposite-sex unmarried partners), 156 children (152 natural, 0 adopted, 4 stepchildren), 3 grandchildren, 2 brothers or sisters, 2 parents, 0 foster children, 3 other relatives, 7 non-relatives
Size of family households: 69 2-persons, 17 3-persons, 19 4-persons, 7 5-persons, 1 6-persons.
Size of nonfamily households: 103 1-person, 2 2-persons.
62 married couples with children.
5 single-parent households (0 men, 5 women).
99.2% of residents of Lynnville speak English at home.
1.1% of residents speak Spanish at home (20% speak English very well, 80% speak English not well).
0.2% of residents speak other language at home (100% speak English very well).
Foreign born population: 3 (0.6%)
(66.7% of them are naturalized citizens)
| Here: | 6.3 |
| State: | 6.8 |
| Here: | 3.4 |
| State: | 4.2 |

- Bedrooms in owner-occupied houses and condos in Lynnville, Iowa
- 5no bedroom
- 111 bedroom
- 702 bedrooms
- 573 bedrooms
- 284 bedrooms
- 75+ bedrooms

- Bedrooms in renter-occupied apartments in Lynnville, Iowa
- 0no bedroom
- 331 bedroom
- 32 bedrooms
- 43 bedrooms
- 14 bedrooms
- 05+ bedrooms

- Cars and other vehicles available in Lynnville in owner-occupied houses/condos
- 1no vehicle
- 461 vehicle
- 682 vehicles
- 213 vehicles
- 304 vehicles
- 125+ vehicles

- Cars and other vehicles available in Lynnville in renter-occupied apartments
- 12no vehicle
- 81 vehicle
- 132 vehicles
- 63 vehicles
- 14 vehicles
- 05+ vehicles

- Rooms in owner-occupied houses in Lynnville, Iowa
- 51 room
- 02 rooms
- 33 rooms
- 134 rooms
- 205 rooms
- 676 rooms
- 247 rooms
- 158 rooms
- 319+ rooms

- Rooms in renter-occupied apartments in Lynnville, Iowa
- 01 room
- 52 rooms
- 183 rooms
- 124 rooms
- 15 rooms
- 06 rooms
- 07 rooms
- 48 rooms
- 19+ rooms


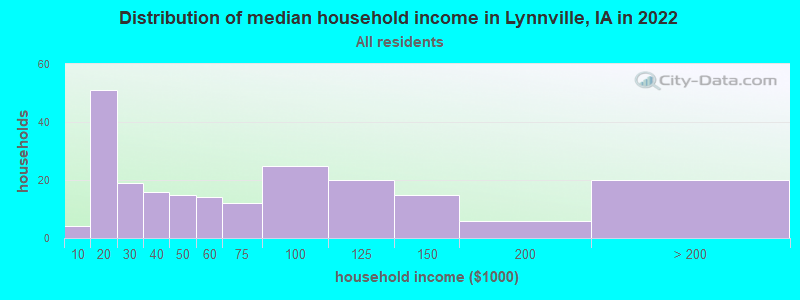
Lynnville, IA household income distribution

- 4Less than $10,000
- 51$10,000 to $19,999
- 19$20,000 to $29,999
- 16$30,000 to $39,999
- 15$40,000 to $49,999
- 14$50,000 to $59,999
- 12$60,000 to $74,999
- 25$75,000 to $99,999
- 20$100,000 to $124,999
- 15$125,000 to $149,999
- 6$150,000 to $199,999
- 20$200,000 or more
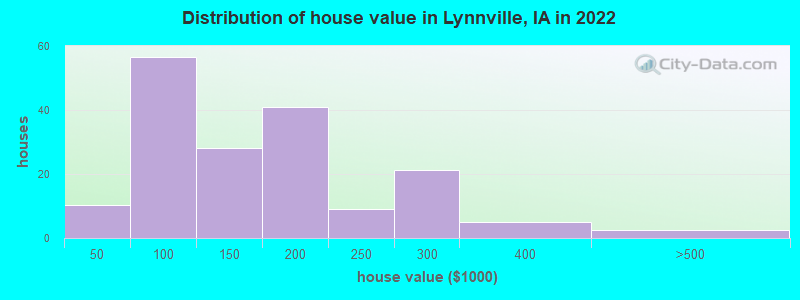
Home value of owner - occupied houses in 2022 in Lynnville, IA
-
- 0Less than $10,000
- 2$10,000 to $14,999
- 0$15,000 to $19,999
- 5$20,000 to $24,999
- 1$40,000 to $49,999
- 8$70,000 to $79,999
- 45$80,000 to $89,999
- 1$90,000 to $99,999
- 15$100,000 to $124,999
- 12$125,000 to $149,999
- 33$150,000 to $174,999
- 7$175,000 to $199,999
- 8$200,000 to $249,999
- 21$250,000 to $299,999
- 4$300,000 to $399,999
- 2$400,000 to $499,999
Rent paid by renters in 2022 in Lynnville, IA
-
- 2$300 to $349
- 10$350 to $399
- 15$400 to $449
- 7$550 to $599
- 5$600 to $649
- 1$750 to $799
- 0$900 to $999


Percentage of workers working in this county: 39.6%
Number of people working at home: 14 (4.8% of all workers)
Travel time to work (commute)
- Less than 5 minutes: 26
- 5 to 9 minutes: 35
- 10 to 14 minutes: 25
- 15 to 19 minutes: 62
- 20 to 24 minutes: 29
- 25 to 29 minutes: 40
- 30 to 34 minutes: 33
- 35 to 39 minutes: 4
- 40 to 44 minutes: 0
- 45 to 59 minutes: 4
- 60 to 89 minutes: 4
- 90 or more minutes: 11
Means of transportation to work:
- Drove a car alone: 165 (80.9%)
- Carpooled: 19 (9.3%)
- Walked: 14 (6.9%)
- Worked at home: 6 (2.9%)

- Unemployment by race in 2022
- Unemployment rate for White non-Hispanic residents
- 1.2%Males
- 0.8%Females

- Year of entry for the foreign-born population in Lynnville, Iowa
- 02010 or later
- 02000 to 2009
- 01990 to 1999
- 01980 to 1989
- 21970 to 1979
- 0Before 1970
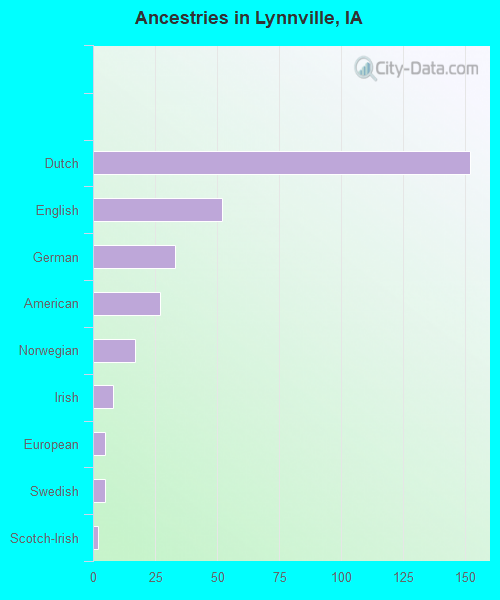
First ancestries reported:
- Dutch: 152 (45.1%)
- English: 52 (15.4%)
- German: 33 (9.8%)
- American: 27 (8.0%)
- Norwegian: 17 (5.0%)
- Irish: 8 (2.4%)
- European: 5 (1.5%)
- Swedish: 5 (1.5%)
- Scotch-Irish: 2 (0.6%)
- French: 1 (0.3%)
- Italian: 1 (0.3%)
- Scottish: 1 (0.3%)
Most common places of birth for foreign-born residents (%):
| Lynnville: | 66.7% (2) |
| Iowa: | 23.3% (41,625) |
Place of birth for U.S.-born residents:
- This state: 435
- Other state: 59
- Northeast: 5
- Midwest: 27
- South: 9
- West: 17
94.7% of Lynnville residents lived in the same house 1 years ago.
Out of people who lived in different houses, 14.7% lived in this county.
Out of people who lived in different counties, 100.0% lived in Iowa.
| Lynnville: | 94.7% |
| State average: | 87.2% |
Education attainment for males 25 years and older:
- No schooling: 2
- Nursery to 4th grade: 0
- 5th and 6th grade: 0
- 7th and 8th grade: 0
- 9th grade: 1
- 10th grade: 0
- 11th grade: 5
- 12th grade, no diploma: 0
- High school graduate (or equivalency): 121
- Less than 1 year of college: 9
- Some college more than 1 year, no degree: 14
- Associate degree: 17
- Bachelor's degree: 32
- Master's degree: 1
- Professional school degree: 2
- Doctorate degree: 0

Education attainment for females 25 years and older:
- No schooling: 1
- Nursery to 4th grade: 0
- 5th and 6th grade: 0
- 7th and 8th grade: 0
- 9th grade: 0
- 10th grade: 0
- 11th grade: 0
- 12th grade, no diploma: 2
- High school graduate (or equivalency): 88
- Less than 1 year of college: 3
- Some college more than 1 year, no degree: 16
- Associate degree: 9
- Bachelor's degree: 20
- Master's degree: 2
- Professional school degree: 0
- Doctorate degree: 0


Housing units in structures:
- One, detached: 183
- One, attached: 3
- Two: 10
- 3 or 4: 19
- Mobile homes: 5
Housing units lacking complete kitchen facilities in 2022: 2.3%
House/condo owner moved in on average 20 years ago
Renter moved in on average 6 years ago

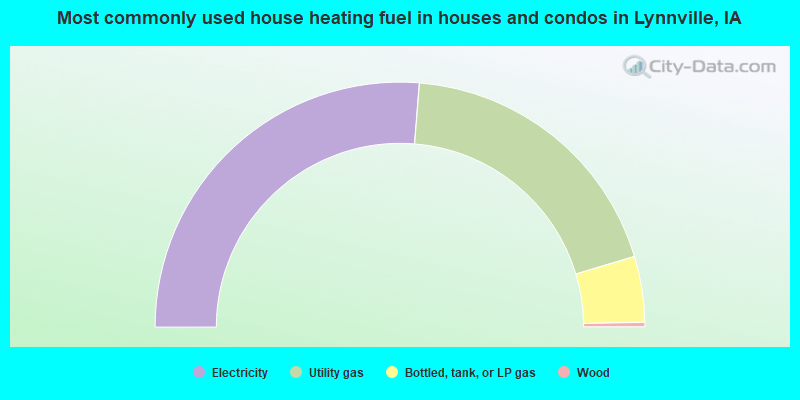
- 52.6%Electricity
- 38.2%Utility gas
- 8.7%Bottled, tank, or LP gas
- 0.6%Wood
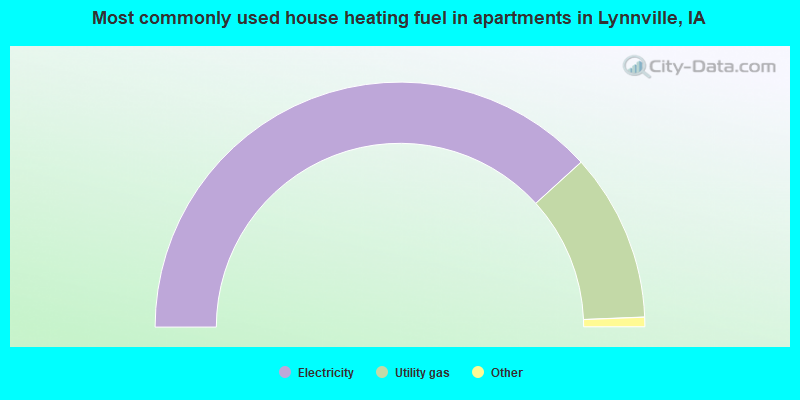
- 77.5%Electricity
- 22.5%Utility gas
Private vs. public school enrollment:
| Here: | 4.0% |
| Iowa: | 10.6% |
| Here: | 5.3% |
| Iowa: | 7.9% |
| Here: | 0.0% |
| Iowa: | 23.9% |


