Lynwood, CA (California) Houses and Residents
| Lynwood: | $568,900 |
| California: | $715,900 |
Mean price in 2022:
Detached houses: $612,533
Here: $612,533 State: $988,808 Townhouses or other attached units: $710,790
Here: $710,790 State: $838,546 In 3-to-4-unit structures: $1,037,285
Here: $1,037,285 State: $824,253 In 5-or-more-unit structures: $627,075
Here: $627,075 State: $730,996 Mobile homes: $1,240,813
Here: $1,240,813 State: $184,506
Total population: 71,839 (Urban population: 69,899, Rural population: 0)
Houses: 15,380 (14,907 occupied: 7,343 owner occupied, 7,564 renter occupied)
| % of renters here: | 51% |
| State: | 44% |
Housing density: 3,169 houses/condos per square mile
Median price asked for vacant for-sale houses and condos in 2022: $1,297,587.
Median contract rent in 2022: $1,435 (lower quartile is $1,196, upper quartile is $1,778)
Median rent asked for vacant for-rent units in 2022: $1,422
Median gross rent in Lynwood, CA in 2022: $1,578
Housing units in Lynwood with a mortgage: 5,458 (222 second mortgage, 3 home equity loan, 159 both second mortgage and home equity loan)
Houses without a mortgage: 97
Median household income for houses/condos with a mortgage: $92,489
Median household income for apartments without a mortgage: $102,984
Median monthly housing costs: $1,638
Compare current foreclosures in Lynwood, CA:
| Photo | Address | Area | Beds / Baths | Price | Details |
|---|---|---|---|---|---|

|
#1
Palm Ave
Lynwood, CA 90262
|
1,454 sq. feet
|
2 baths 2 beds |
show details | |

|
#2
Santa Fe Ave
Lynwood, CA 90262
|
1,124 sq. feet
|
2 baths 3 beds |
show details | |

|
#3
Cedar Ave
Lynwood, CA 90262
|
1,092 sq. feet
|
2 baths 3 beds |
show details | |

|
#4
Virginia St
Lynwood, CA 90262
|
1,548 sq. feet
|
2 baths 3 beds |
show details | |

|
#5
Josephine St
Lynwood, CA 90262
|
1,414 sq. feet
|
1 baths 3 beds |
show details | |

|
#6
Fernwood Ave
Lynwood, CA 90262
|
984 sq. feet
|
1 baths 3 beds |
show details | |

|
#7
Walnut Ave
Lynwood, CA 90262
|
1,023 sq. feet
|
1 baths 3 beds |
show details | |

|
#8
California Ave # B
Lynwood, CA 90262
|
1,836 sq. feet
|
3 baths 7 beds |
show details | |

|
#9
Josephine St
Lynwood, CA 90262
|
860 sq. feet
|
2 baths 4 beds |
show details | |

|
#10
Platt Ave
Lynwood, CA 90262
|
1,311 sq. feet
|
2 baths 3 beds |
show details |
| Photo | Address | Area | Beds / Baths | Price | Details |
|---|---|---|---|---|---|

|
#11
Olanda St
Lynwood, CA 90262
|
1,414 sq. feet
|
2 baths 3 beds |
show details | |

|
#12
Pine Ave
Lynwood, CA 90262
|
1,175 sq. feet
|
2 baths 3 beds |
show details | |

|
#13
Platt Ave
Lynwood, CA 90262
|
1,806 sq. feet
|
2 baths 4 beds |
show details | |

|
#14
108th St
Lynwood, CA 90262
|
1,749 sq. feet
|
2 baths 3 beds |
show details | |

|
#15
Virginia St
Lynwood, CA 90262
|
1,196 sq. feet
|
1 baths 3 beds |
show details | |

|
#16
Lugo Ave
Lynwood, CA 90262
|
728 sq. feet
|
1 baths 2 beds |
show details | |

|
#17
Shirley Ave
Lynwood, CA 90262
|
3,576 sq. feet
|
5 baths 5 beds |
show details | |

|
#18
Alvada St
Lynwood, CA 90262
|
1,051 sq. feet
|
1 baths 2 beds |
show details | |

|
#19
Mulford Ave
Lynwood, CA 90262
|
888 sq. feet
|
3 baths 5 beds |
show details | |

|
#20
Palm Ave
Lynwood, CA 90262
|
1,454 sq. feet
|
1 baths 2 beds |
show details |
| Photo | Address | Area | Beds / Baths | Price | Details |
|---|---|---|---|---|---|

|
#21
Lavinia Ave
Lynwood, CA 90262
|
1,273 sq. feet
|
2 baths 4 beds |
show details | |

|
#22
Le Sage St
Lynwood, CA 90262
|
1,022 sq. feet
|
1 baths 3 beds |
show details | |

|
#23
Josephine St
Lynwood, CA 90262
|
1,897 sq. feet
|
2 baths 3 beds |
show details | |

|
#24
Brewster Ave
Lynwood, CA 90262
|
979 sq. feet
|
1 baths 2 beds |
show details | |

|
#25
Virginia St
Lynwood, CA 90262
|
1,074 sq. feet
|
2 baths 2 beds |
show details | |

|
#26
110th St
Lynwood, CA 90262
|
1,063 sq. feet
|
1 baths 2 beds |
show details | |

|
#27
Tecumseh Ave
Lynwood, CA 90262
|
920 sq. feet
|
1 baths 2 beds |
show details | |

|
#28
Belinda Ct
Lynwood, CA 90262
|
1,737 sq. feet
|
3 baths 4 beds |
show details | |

|
#29
Palm Ave
Lynwood, CA 90262
|
1,030 sq. feet
|
1 baths 3 beds |
show details | |

|
#30
Fernwood Ave
Lynwood, CA 90262
|
1,511 sq. feet
|
2 baths 2 beds |
show details |
| Photo | Address | Area | Beds / Baths | Price | Details |
|---|---|---|---|---|---|

|
#31
Walnut Ave
Lynwood, CA 90262
|
1,348 sq. feet
|
2 baths 3 beds |
show details | |

|
#32
Peach St
Lynwood, CA 90262
|
1,110 sq. feet
|
1 baths 2 beds |
show details | |

|
#33
Cornish Ave
Lynwood, CA 90262
|
1,086 sq. feet
|
1 baths 2 beds |
show details | |

|
#34
Lynwood Rd
Lynwood, CA 90262
|
1,310 sq. feet
|
1 baths 3 beds |
show details | |

|
#35
Long Beach Blvd
Lynwood, CA 90262
|
1,448 sq. feet
|
1 baths 3 beds |
show details | |

|
#36
Cornish Ave
Lynwood, CA 90262
|
1,361 sq. feet
|
2 baths 3 beds |
show details | |

|
#37
Virginia St
Lynwood, CA 90262
|
1,548 sq. feet
|
2 baths 3 beds |
show details | |

|
#38
Duncan Ave
Lynwood, CA 90262
|
2,342 sq. feet
|
3 baths 4 beds |
show details | |

|
#39
Wilson Ave
Lynwood, CA 90262
|
730 sq. feet
|
1 baths 2 beds |
show details | |

|
#40
Peach St
Lynwood, CA 90262
|
1,210 sq. feet
|
1 baths 2 beds |
show details |
| Photo | Address | Area | Beds / Baths | Price | Details |
|---|---|---|---|---|---|

|
#41
Josephine St
Lynwood, CA 90262
|
1,188 sq. feet
|
1 baths 3 beds |
show details | |

|
#42
Cortland St
Lynwood, CA 90262
|
1,637 sq. feet
|
3 baths 3 beds |
show details | |

|
#43
Alma Ave
Lynwood, CA 90262
|
1,083 sq. feet
|
2 baths 3 beds |
show details | |

|
#44
Clark St
Lynwood, CA 90262
|
1,596 sq. feet
|
2 baths 3 beds |
show details | |

|
#45
Lynwood Rd
Lynwood, CA 90262
|
1,741 sq. feet
|
3 baths 5 beds |
show details | |

|
#46
Eve Ave
Lynwood, CA 90262
|
1,032 sq. feet
|
1 baths 2 beds |
show details | |

|
#47
Harris Ave
Lynwood, CA 90262
|
1,579 sq. feet
|
6 baths 8 beds |
show details | |

|
#48
California Ave
Lynwood, CA 90262
|
1,322 sq. feet
|
1 baths 2 beds |
show details | |

|
#49
Arlington Ave
Lynwood, CA 90262
|
1,563 sq. feet
|
2 baths 2 beds |
show details | |

|
Check over 1 million property listings on Foreclosure.com!
|
browse all offers | |||

Latest news about housing in Lynwood, CA collected exclusively by city-data.com from local newspapers, TV, and radio stations

 | The Los Angeles Homeless Containment Thread (9136 replies) |
| CA Cities(Pop 65,000+) by Median Household Income, 2019 (8 replies) |
| Where are young people/Millennials buying homes in Los Angeles Area / South Bay LA? (36 replies) |
| Is South Gate safe? (70 replies) |
| Median price for existing OC house: $760,000 (LA & IE prices rise faster than OC) (115 replies) |
| Buying a house for 300,000 in LA (40 replies) |

Median year apartment built: 1961
Household type by relationship:
Households: 64,081- Male householders: 7,882 (889 living alone), Female householders: 7,025 (629 living alone)
6,364 spouses (6,364 opposite-sex spouses), 2,526 unmarried partners, (2,526 opposite-sex unmarried partners), 24,759 children (23,982 natural, 248 adopted, 529 stepchildren), 2,820 grandchildren, 2,614 brothers or sisters, 2,890 parents, 0 foster children, 3,664 other relatives, 1,480 non-relatives
- In group quarters: 2,057
Size of family households: 1,918 2-persons, 2,855 3-persons, 3,658 4-persons, 2,361 5-persons, 935 6-persons, 1,414 7-or-more-persons.
Size of nonfamily households: 1,518 1-person, 107 2-persons, 141 3-persons.
5,023 married couples with children.
8,498 single-parent households (2,859 men, 5,639 women).
20.2% of residents of Lynwood speak English at home.
77.3% of residents speak Spanish at home (59% speak English very well, 15% speak English well, 16% speak English not well, 10% don't speak English at all).
0.2% of residents speak other Indo-European language at home (87% speak English very well, 13% speak English not well).
0.9% of residents speak Asian or Pacific Island language at home (75% speak English very well, 13% speak English well, 11% speak English not well, 1% don't speak English at all).
0.1% of residents speak other language at home (100% speak English very well).
Foreign born population: 22,980 (35.9%)
(35.1% of them are naturalized citizens)
| Here: | 5.1 |
| State: | 6.0 |
| Here: | 4.0 |
| State: | 3.9 |

- Bedrooms in owner-occupied houses and condos in Lynwood, California
- 0no bedroom
- 01 bedroom
- 2,1892 bedrooms
- 3,9353 bedrooms
- 1,1694 bedrooms
- 505+ bedrooms

- Bedrooms in renter-occupied apartments in Lynwood, California
- 610no bedroom
- 1,4161 bedroom
- 3,4322 bedrooms
- 2,0133 bedrooms
- 464 bedrooms
- 475+ bedrooms

- Cars and other vehicles available in Lynwood in owner-occupied houses/condos
- 0no vehicle
- 9391 vehicle
- 2,2022 vehicles
- 2,2753 vehicles
- 1,4444 vehicles
- 4835+ vehicles

- Cars and other vehicles available in Lynwood in renter-occupied apartments
- 588no vehicle
- 2,5641 vehicle
- 3,3962 vehicles
- 5993 vehicles
- 3204 vehicles
- 975+ vehicles

- Rooms in owner-occupied houses in Lynwood, California
- 01 room
- 02 rooms
- 5733 rooms
- 1,9014 rooms
- 2,1385 rooms
- 1,6836 rooms
- 5687 rooms
- 3468 rooms
- 1349+ rooms

- Rooms in renter-occupied apartments in Lynwood, California
- 6101 room
- 3592 rooms
- 1,3403 rooms
- 2,8204 rooms
- 1,4155 rooms
- 7486 rooms
- 07 rooms
- 2258 rooms
- 479+ rooms


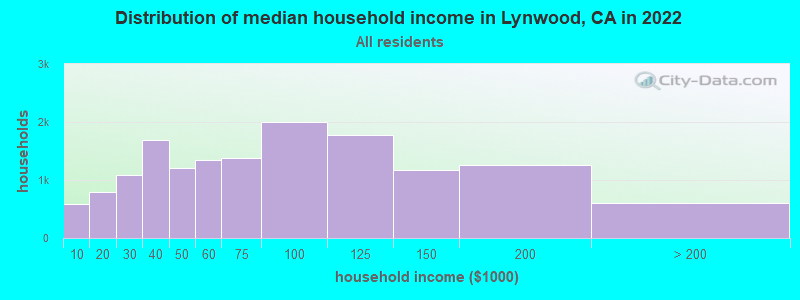
Lynwood, CA household income distribution

- 593Less than $10,000
- 793$10,000 to $19,999
- 1,082$20,000 to $29,999
- 1,685$30,000 to $39,999
- 1,214$40,000 to $49,999
- 1,347$50,000 to $59,999
- 1,381$60,000 to $74,999
- 2,003$75,000 to $99,999
- 1,777$100,000 to $124,999
- 1,164$125,000 to $149,999
- 1,263$150,000 to $199,999
- 605$200,000 or more
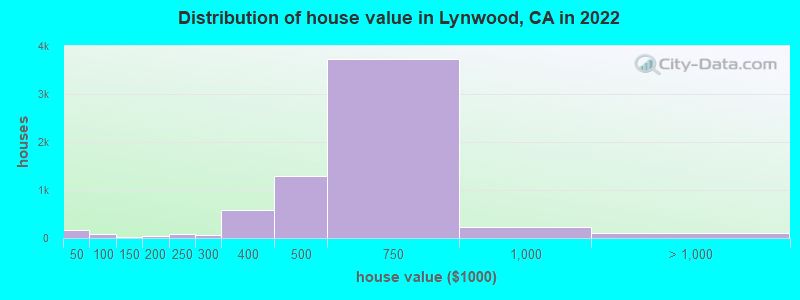
Home value of owner - occupied houses in 2022 in Lynwood, CA
-
- 121Less than $10,000
- 9$25,000 to $29,999
- 25$40,000 to $49,999
- 30$50,000 to $59,999
- 24$70,000 to $79,999
- 20$100,000 to $124,999
- 29$150,000 to $174,999
- 3$175,000 to $199,999
- 75$200,000 to $249,999
- 68$250,000 to $299,999
- 577$300,000 to $399,999
- 1,290$400,000 to $499,999
- 3,734$500,000 to $749,999
- 220$750,000 to $999,999
- 40$1,000,000 to $1,499,999
- 13$1,500,000 to $1,999,999
- 57$2,000,000 or more
Rent paid by renters in 2022 in Lynwood, CA
-
- 32Less than $100
- 6$100 to $149
- 97$200 to $249
- 9$300 to $349
- 93$350 to $399
- 39$450 to $499
- 54$500 to $549
- 27$550 to $599
- 12$600 to $649
- 87$700 to $749
- 54$750 to $799
- 105$800 to $899
- 487$900 to $999
- 1,935$1,000 to $1,249
- 1,708$1,250 to $1,499
- 2,161$1,500 to $1,999
- 559$2,000 to $2,499
- 184$2,500 to $2,999
- 55$3,000 to $3,499
- 117No cash rent


Percentage of workers working in this county: 93.4%
Number of people working at home: 1,146 (4.1% of all workers)
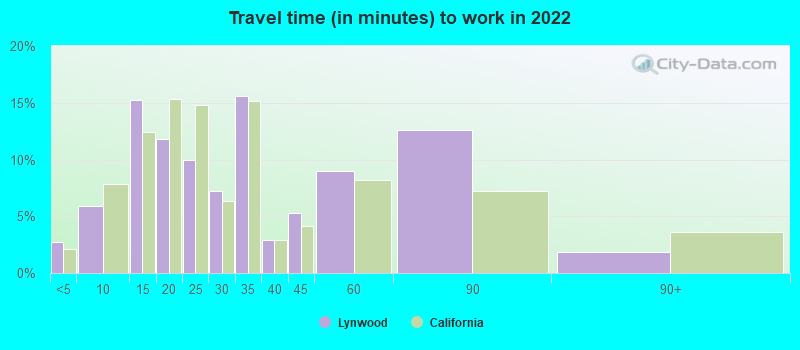
Travel time to work (commute)
- Less than 5 minutes: 368
- 5 to 9 minutes: 1,508
- 10 to 14 minutes: 2,736
- 15 to 19 minutes: 1,972
- 20 to 24 minutes: 5,615
- 25 to 29 minutes: 1,910
- 30 to 34 minutes: 4,760
- 35 to 39 minutes: 299
- 40 to 44 minutes: 1,491
- 45 to 59 minutes: 2,898
- 60 to 89 minutes: 2,879
- 90 or more minutes: 931
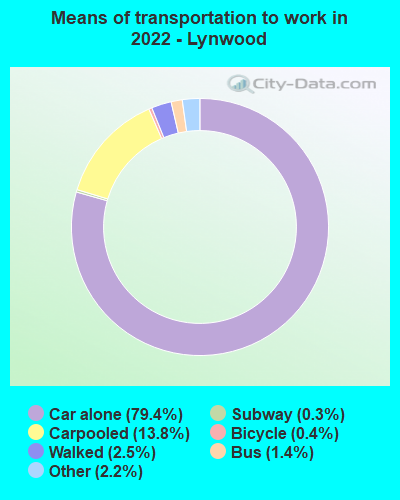
Means of transportation to work:
- Drove a car alone: 9,782 (70.4%)
- Carpooled: 1,878 (13.5%)
- Bus: 159 (1.1%)
- Long-distance train or commuter rail: 19 (0.1%)
- Taxi: 299 (2.2%)
- Bicycle: 55 (0.4%)
- Walked: 335 (2.4%)
- Worked at home: 1,146 (8.3%)

- Unemployment by race in 2022
- Unemployment rate for White non-Hispanic residents
- 25.2%Males
- Unemployment rate for Black residents
- 4.0%Males
- 7.7%Females
- Unemployment rate for American Indian and Alaska Native residents
- 7.3%Males
- 3.7%Females
- Unemployment rate for Asian residents
- 11.1%Males
- Unemployment rate for other race residents
- 8.0%Males
- 8.2%Females
- Unemployment rate for two or more race residents
- 4.0%Males
- 10.5%Females
- Unemployment rate for Hispanic or Latino residents
- 7.5%Males
- 9.3%Females

- Year of entry for the foreign-born population in Lynwood, California
- 3,1822010 or later
- 4,8192000 to 2009
- 5,7621990 to 1999
- 11,1621980 to 1989
- 8,4421970 to 1979
- 1,940Before 1970

First ancestries reported:
- American: 431 (0.9%)
- Nigerian: 202 (0.4%)
- African: 127 (0.3%)
- English: 90 (0.2%)
- Russian: 51 (0.1%)
- Irish: 48 (0.10%)
- Italian: 35 (0.07%)
- British: 34 (0.07%)
- European: 29 (0.06%)
- Iranian: 23 (0.05%)
- German: 22 (0.04%)
- Armenian: 14 (0.03%)
- Dutch: 11 (0.02%)
- French: 9 (0.02%)
- Jamaican: 8 (0.02%)
- Romanian: 7 (0.01%)
- Portuguese: 6 (0.01%)
- Scottish: 6 (0.01%)
- Lebanese: 5 (0.01%)
- Croatian: 4 (0.01%)
- Greek: 3 (0.01%)
- Belizean: 3 (0.01%)
Most common places of birth for foreign-born residents (%):
| Lynwood: | 73.7% (18,211) |
| California: | 37.2% (3,881,193) |
| Lynwood: | 12.8% (3,171) |
| California: | 4.2% (440,287) |
| Lynwood: | 4.5% (1,114) |
| California: | 2.8% (290,436) |
| Lynwood: | 2.9% (711) |
| California: | 0.6% (66,590) |
Place of birth for U.S.-born residents:
- This state: 38,173
- Other state: 1,952
- Northeast: 414
- Midwest: 449
- South: 741
- West: 348
94.4% of Lynwood residents lived in the same house 1 years ago.
Out of people who lived in different houses, 44.8% lived in this county.
Out of people who lived in different counties, 47.3% lived in California.
| Lynwood: | 94.4% |
| State average: | 88.9% |
Education attainment for males 25 years and older:
- No schooling: 3,091
- Nursery to 4th grade: 574
- 5th and 6th grade: 1,030
- 7th and 8th grade: 1,081
- 9th grade: 1,171
- 10th grade: 692
- 11th grade: 1,114
- 12th grade, no diploma: 1,083
- High school graduate (or equivalency): 4,391
- Less than 1 year of college: 956
- Some college more than 1 year, no degree: 1,655
- Associate degree: 720
- Bachelor's degree: 1,530
- Master's degree: 273
- Professional school degree: 43
- Doctorate degree: 53

Education attainment for females 25 years and older:
- No schooling: 1,887
- Nursery to 4th grade: 410
- 5th and 6th grade: 1,638
- 7th and 8th grade: 636
- 9th grade: 663
- 10th grade: 864
- 11th grade: 766
- 12th grade, no diploma: 920
- High school graduate (or equivalency): 5,822
- Less than 1 year of college: 615
- Some college more than 1 year, no degree: 2,189
- Associate degree: 1,207
- Bachelor's degree: 2,019
- Master's degree: 535
- Professional school degree: 0
- Doctorate degree: 0


Housing units in structures:
- One, detached: 8,767
- One, attached: 2,212
- Two: 454
- 3 or 4: 1,033
- 5 to 9: 1,095
- 10 to 19: 613
- 20 to 49: 646
- 50 or more: 426
- Mobile homes: 134
Housing units lacking complete kitchen facilities in 2022: 3.0%
House/condo owner moved in on average 18 years ago
Renter moved in on average 7 years ago

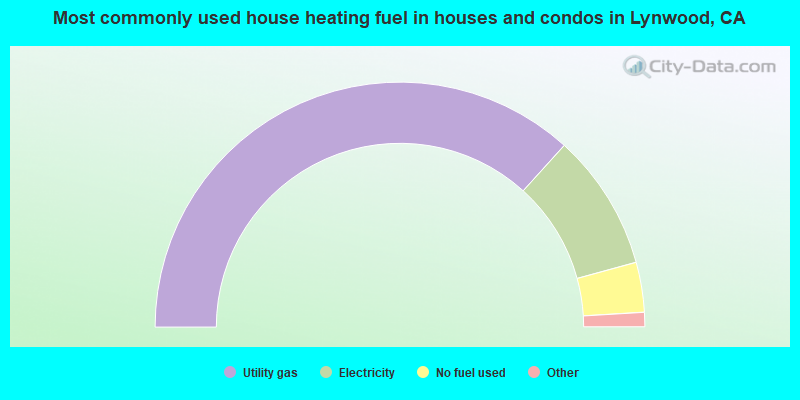
- 73.5%Utility gas
- 18.1%Electricity
- 6.6%No fuel used
- 0.7%Solar energy
- 0.7%Other fuel
- 0.3%Wood
- 0.2%Bottled, tank, or LP gas
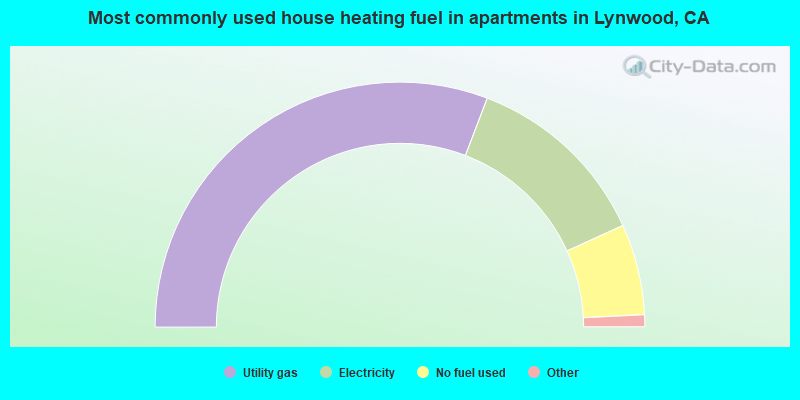
- 61.6%Utility gas
- 24.8%Electricity
- 12.0%No fuel used
- 1.1%Bottled, tank, or LP gas
- 0.4%Other fuel
- 0.1%Solar energy
Private vs. public school enrollment:
| Here: | 2.9% |
| California: | 10.5% |
| Here: | 2.3% |
| California: | 8.5% |
| Here: | 9.8% |
| California: | 15.9% |


