Mahopac, NY (New York) Houses and Residents
| Mahopac: | $453,265 |
| New York: | $400,400 |
Mean price in 2022:
Detached houses: $584,952
Here: $584,952 State: $476,719 Townhouses or other attached units: $368,097
Here: $368,097 State: $699,270 In 2-unit structures: $320,953
Here: $320,953 State: $713,077 In 5-or-more-unit structures: $164,039
Here: $164,039 State: $912,009
Total population: 8,369 (All urban)
Houses: 3,511 (3,238 occupied: 2,628 owner occupied, 714 renter occupied)
| % of renters here: | 21% |
| State: | 46% |
Housing density: 663 houses/condos per square mile
Median price asked for vacant for-sale houses and condos in 2022 in this county: $538,616.
Median contract rent in 2022: $1,881 (lower quartile is $1,532, upper quartile is over $2,000)
Median rent asked for vacant for-rent units in 2022: $2,488
Median gross rent in Mahopac, NY in 2022: $1,995
Housing units in Mahopac with a mortgage: 1,570 (157 second mortgage, 0 home equity loan, 167 both second mortgage and home equity loan)
Houses without a mortgage: 30
Median household income for houses/condos with a mortgage: $128,163
Median household income for apartments without a mortgage: $118,691
Median monthly housing costs: $2,174
Compare current foreclosures in Mahopac, NY:
| Photo | Address | Area | Beds / Baths | Price | Details |
|---|---|---|---|---|---|

|
#1
Walnut Dr
Mahopac, NY 10541
|
2,284 sq. feet
|
2 baths 4 beds |
show details | |

|
#2
Walnut Dr
Mahopac, NY 10541
|
1,921 sq. feet
|
2 baths 4 beds |
show details | |

|
#3
S Lake Blvd
Mahopac, NY 10541
|
3,408 sq. feet
|
3 baths 3 beds |
show details | |

|
#4
Kathryn Ln
Mahopac, NY 10541
|
3,086 sq. feet
|
3 baths 4 beds |
show details | |

|
#5
Woodbine Dr
Mahopac, NY 10541
|
2,971 sq. feet
|
3 baths 4 beds |
show details | |

|
#6
Wayacross Rd
Mahopac, NY 10541
|
3,479 sq. feet
|
3 baths 3 beds |
show details | |

|
#7
Elm Rd
Mahopac, NY 10541
|
1,242 sq. feet
|
1 baths 2 beds |
show details | |

|
#8
Williamsburg Dr
Mahopac, NY 10541
|
1,349 sq. feet
|
2 baths 2 beds |
show details | |

|
#9
Kings Ridge Rd
Mahopac, NY 10541
|
2,180 sq. feet
|
2 baths 3 beds |
show details | |

|
#10
Mc Nair Dr
Mahopac, NY 10541
|
2,084 sq. feet
|
2 baths 4 beds |
show details |
| Photo | Address | Area | Beds / Baths | Price | Details |
|---|---|---|---|---|---|

|
#11
Penelope Ct
Mahopac, NY 10541
|
1,393 sq. feet
|
2 baths 2 beds |
show details | |

|
#12
Spring Dr
Mahopac, NY 10541
|
2,014 sq. feet
|
1 baths 3 beds |
show details | |

|
#13
Fulop Ln
Mahopac, NY 10541
|
2,739 sq. feet
|
3 baths 5 beds |
show details | |

|
#14
Horton Dr
Mahopac, NY 10541
|
2,169 sq. feet
|
2 baths 4 beds |
show details | |

|
#15
Oak Ridge Dr
Mahopac, NY 10541
|
1,964 sq. feet
|
2 baths 4 beds |
show details | |

|
#16
Overlook Dr
Mahopac, NY 10541
|
2,112 sq. feet
|
2 baths 5 beds |
show details | |

|
#17
N Lake Blvd
Mahopac, NY 10541
|
1,203 sq. feet
|
1 baths 3 beds |
show details | |

|
#18
Oaklandview Dr
Mahopac, NY 10541
|
2,247 sq. feet
|
3 baths 4 beds |
show details | |

|
#19
Union Valley Rd
Mahopac, NY 10541
|
3,655 sq. feet
|
3 baths 5 beds |
show details | |

|
#20
Crescent Rd
Mahopac, NY 10541
|
1,260 sq. feet
|
1 baths 3 beds |
show details |
| Photo | Address | Area | Beds / Baths | Price | Details |
|---|---|---|---|---|---|

|
#21
Entrance Way
Mahopac, NY 10541
|
628 sq. feet
|
1 baths 2 beds |
show details | |

|
#22
James Ct
Mahopac, NY 10541
|
2,719 sq. feet
|
2 baths 4 beds |
show details | |

|
#23
Center Dr
Mahopac, NY 10541
|
1,260 sq. feet
|
2 baths 3 beds |
show details | |

|
#24
Provost Pl
Mahopac, NY 10541
|
2,496 sq. feet
|
1 baths 3 beds |
show details | |

|
#25
Charles Pl
Mahopac, NY 10541
|
2,544 sq. feet
|
3 baths 6 beds |
show details | |

|
#26
Nicole Way
Mahopac, NY 10541
|
1,958 sq. feet
|
3 baths 3 beds |
show details | |

|
#27
Daisy Dr
Mahopac, NY 10541
|
1,281 sq. feet
|
2 baths - beds |
show details | |

|
#28
S Ridge Rd
Mahopac, NY 10541
|
- sq. feet
|
- baths - beds |
show details | |

|
#29
Marina 4f
Mahopac, NY 10541
|
- sq. feet
|
- baths - beds |
show details | |

|
#30
Route 6
Mahopac, NY 10541
|
- sq. feet
|
- baths - beds |
show details |
| Photo | Address | Area | Beds / Baths | Price | Details |
|---|---|---|---|---|---|

|
#31
Fox Hill Rd
Mahopac, NY 10541
|
- sq. feet
|
- baths - beds |
show details | |

|
#32
Pike Pl
Mahopac, NY 10541
|
- sq. feet
|
- baths - beds |
show details | |

|
#33
Clark Pl
Mahopac, NY 10541
|
- sq. feet
|
- baths - beds |
show details | |

|
Check over 1 million property listings on Foreclosure.com!
|
browse all offers | |||

Latest news about housing in Mahopac, NY collected exclusively by city-data.com from local newspapers, TV, and radio stations

 | Remodeling Permits in Mahopac NY (2 replies) |
| Lakeland Central SD (29 replies) |
| Help planning a renovation (17 replies) |
| Curing A New York Poor Sap Homesickness... (28 replies) |
| Cost of utilities for a house in Mahopac New York? (2 replies) |
| From NJ back to NY (30 replies) |

Median year apartment built: 1970
Household type by relationship:
Households: 8,783- Male householders: 1,455 (218 living alone), Female householders: 1,779 (406 living alone)
2,206 spouses (2,172 opposite-sex spouses), 118 unmarried partners, (118 opposite-sex unmarried partners), 2,690 children (2,583 natural, 58 adopted, 49 stepchildren), 62 grandchildren, 82 brothers or sisters, 208 parents, 0 foster children, 62 other relatives, 104 non-relatives
- In group quarters: 14
Size of family households: 1,084 2-persons, 614 3-persons, 599 4-persons, 84 5-persons, 40 6-persons.
Size of nonfamily households: 789 1-person, 116 2-persons, 26 4-persons.
1,218 married couples with children.
268 single-parent households (64 men, 204 women).
76.7% of residents of Mahopac speak English at home.
12.3% of residents speak Spanish at home (75% speak English very well, 19% speak English well, 6% speak English not well).
7.2% of residents speak other Indo-European language at home (84% speak English very well, 16% speak English well).
2.7% of residents speak Asian or Pacific Island language at home (71% speak English very well, 29% speak English well).
0.6% of residents speak other language at home (63% speak English very well, 37% speak English well).
Foreign born population: 1,071 (12.2%)
(63.3% of them are naturalized citizens)
| Here: | 6.5 |
| State: | 6.3 |
| Here: | 4.8 |
| State: | 3.8 |

- Bedrooms in owner-occupied houses and condos in Mahopac, New York
- 0no bedroom
- 1161 bedroom
- 4052 bedrooms
- 1,4303 bedrooms
- 5534 bedrooms
- 1245+ bedrooms

- Bedrooms in renter-occupied apartments in Mahopac, New York
- 0no bedroom
- 1771 bedroom
- 2912 bedrooms
- 2363 bedrooms
- 114 bedrooms
- 05+ bedrooms

- Cars and other vehicles available in Mahopac in owner-occupied houses/condos
- 91no vehicle
- 6271 vehicle
- 1,3572 vehicles
- 4243 vehicles
- 304 vehicles
- 995+ vehicles

- Cars and other vehicles available in Mahopac in renter-occupied apartments
- 31no vehicle
- 2601 vehicle
- 4012 vehicles
- 233 vehicles
- 04 vehicles
- 05+ vehicles

- Rooms in owner-occupied houses in Mahopac, New York
- 01 room
- 182 rooms
- 123 rooms
- 3284 rooms
- 3255 rooms
- 5176 rooms
- 6367 rooms
- 2958 rooms
- 4989+ rooms

- Rooms in renter-occupied apartments in Mahopac, New York
- 01 room
- 862 rooms
- 603 rooms
- 2424 rooms
- 845 rooms
- 1736 rooms
- 597 rooms
- 08 rooms
- 119+ rooms


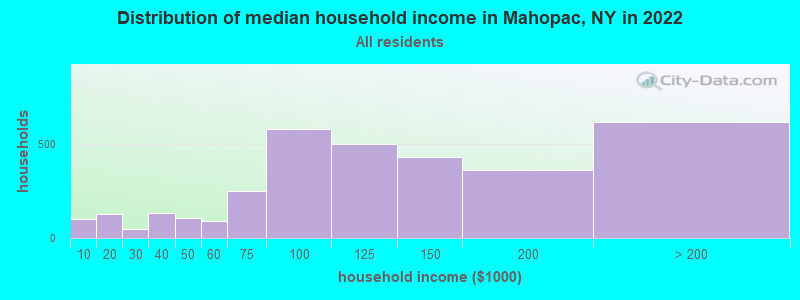
Mahopac, NY household income distribution

- 100Less than $10,000
- 127$10,000 to $19,999
- 47$20,000 to $29,999
- 136$30,000 to $39,999
- 108$40,000 to $49,999
- 92$50,000 to $59,999
- 250$60,000 to $74,999
- 584$75,000 to $99,999
- 502$100,000 to $124,999
- 433$125,000 to $149,999
- 363$150,000 to $199,999
- 620$200,000 or more
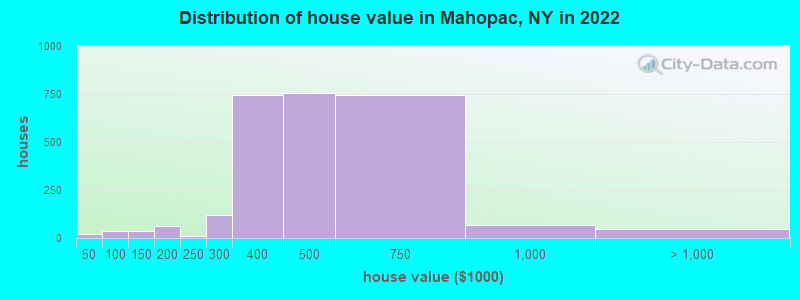
Home value of owner - occupied houses in 2022 in Mahopac, NY
-
- 9Less than $10,000
- 9$20,000 to $24,999
- 19$60,000 to $69,999
- 14$80,000 to $89,999
- 37$125,000 to $149,999
- 55$150,000 to $174,999
- 9$175,000 to $199,999
- 11$200,000 to $249,999
- 117$250,000 to $299,999
- 743$300,000 to $399,999
- 757$400,000 to $499,999
- 745$500,000 to $749,999
- 67$750,000 to $999,999
- 36$1,000,000 to $1,499,999
- 8$2,000,000 or more
Rent paid by renters in 2022 in Mahopac, NY
-
- 21$350 to $399
- 22$700 to $749
- 43$900 to $999
- 133$1,250 to $1,499
- 234$1,500 to $1,999
- 140$2,000 to $2,499
- 44$2,500 to $2,999
- 31$3,000 to $3,499
- 20No cash rent


Percentage of workers working in this county: 36.6%
Number of people working at home: 760 (16.7% of all workers)
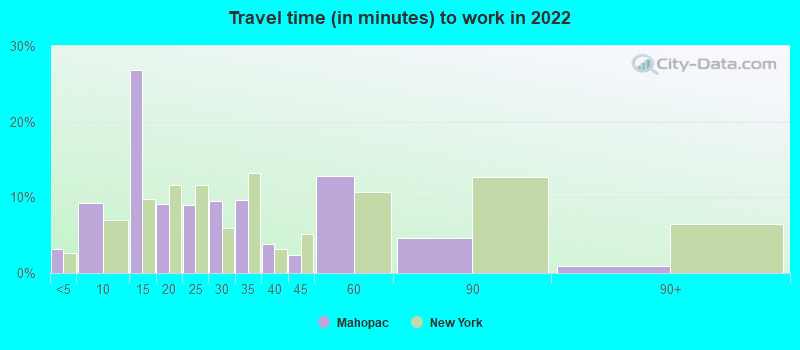
Travel time to work (commute)
- Less than 5 minutes: 60
- 5 to 9 minutes: 201
- 10 to 14 minutes: 320
- 15 to 19 minutes: 297
- 20 to 24 minutes: 353
- 25 to 29 minutes: 135
- 30 to 34 minutes: 218
- 35 to 39 minutes: 198
- 40 to 44 minutes: 291
- 45 to 59 minutes: 1,037
- 60 to 89 minutes: 537
- 90 or more minutes: 273
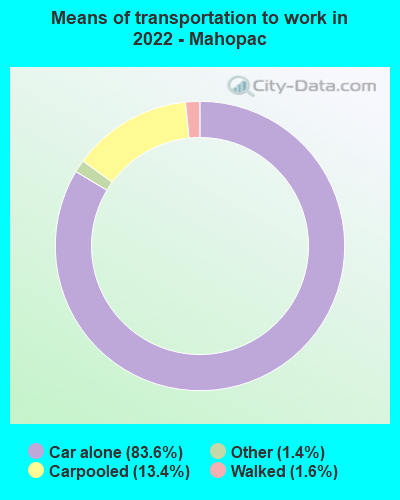
Means of transportation to work:
- Drove a car alone: 1,886 (64.5%)
- Carpooled: 321 (11.0%)
- Taxi: 38 (1.3%)
- Walked: 36 (1.2%)
- Worked at home: 760 (26.0%)

- Unemployment by race in 2022
- Unemployment rate for White non-Hispanic residents
- 1.0%Males
- 6.2%Females

- Year of entry for the foreign-born population in Mahopac, New York
- 3442010 or later
- 1822000 to 2009
- 2471990 to 1999
- 1251980 to 1989
- 1851970 to 1979
- 339Before 1970

First ancestries reported:
- Italian: 1,445 (37.5%)
- Irish: 665 (17.3%)
- German: 130 (3.4%)
- American: 111 (2.9%)
- English: 77 (2.0%)
- Egyptian: 57 (1.5%)
- Greek: 41 (1.1%)
- Polish: 40 (1.0%)
- Slovak: 39 (1.0%)
- Czech: 29 (0.8%)
- Russian: 21 (0.5%)
- Hungarian: 20 (0.5%)
- European: 17 (0.4%)
- Jamaican: 16 (0.4%)
- Eastern European: 14 (0.4%)
- Romanian: 13 (0.3%)
- Swedish: 13 (0.3%)
- Welsh: 13 (0.3%)
- Albanian: 12 (0.3%)
- Icelander: 11 (0.3%)
- Czechoslovakian: 9 (0.2%)
- Canadian: 7 (0.2%)
- British: 5 (0.1%)
Most common places of birth for foreign-born residents (%):
| Mahopac: | 13.9% (159) |
| New York: | 1.8% (81,374) |
| Mahopac: | 11.5% (132) |
| New York: | 11.1% (501,040) |
| Mahopac: | 10.8% (123) |
| New York: | 3.5% (158,432) |
| Mahopac: | 7.1% (81) |
| New York: | 0.2% (8,766) |
| Mahopac: | 5.8% (66) |
| New York: | 2.5% (111,920) |
| Mahopac: | 5.4% (62) |
| New York: | 3.9% (177,448) |
| Mahopac: | 5.0% (57) |
| New York: | 0.1% (2,567) |
| Mahopac: | 4.5% (52) |
| New York: | 3.8% (172,129) |
| Mahopac: | 4.3% (49) |
| New York: | 1.4% (61,245) |
| Mahopac: | 3.5% (40) |
| New York: | 0.2% (8,227) |
| Mahopac: | 3.1% (36) |
| New York: | 0.6% (27,385) |
| Mahopac: | 2.5% (29) |
| New York: | 0.9% (38,713) |
| Mahopac: | 2.5% (29) |
| New York: | 4.8% (214,559) |
| Mahopac: | 2.3% (26) |
| New York: | 0.3% (14,949) |
| Mahopac: | 1.8% (21) |
| New York: | 1.7% (75,802) |
| Mahopac: | 1.8% (21) |
| New York: | 1.8% (82,786) |
| Mahopac: | 1.7% (20) |
| New York: | 0.7% (32,906) |
| Mahopac: | 1.6% (18) |
| New York: | 0.1% (3,487) |
Place of birth for U.S.-born residents:
- This state: 6,551
- Other state: 993
- Northeast: 603
- Midwest: 68
- South: 206
- West: 106
91.8% of Mahopac residents lived in the same house 1 years ago.
Out of people who lived in different houses, 17.2% lived in this county.
Out of people who lived in different counties, 71.0% lived in New York.
| Mahopac: | 91.8% |
| State average: | 89.6% |
Education attainment for males 25 years and older:
- No schooling: 193
- Nursery to 4th grade: 0
- 5th and 6th grade: 0
- 7th and 8th grade: 0
- 9th grade: 0
- 10th grade: 13
- 11th grade: 43
- 12th grade, no diploma: 0
- High school graduate (or equivalency): 843
- Less than 1 year of college: 314
- Some college more than 1 year, no degree: 222
- Associate degree: 302
- Bachelor's degree: 753
- Master's degree: 506
- Professional school degree: 36
- Doctorate degree: 53

Education attainment for females 25 years and older:
- No schooling: 241
- Nursery to 4th grade: 0
- 5th and 6th grade: 0
- 7th and 8th grade: 0
- 9th grade: 31
- 10th grade: 17
- 11th grade: 19
- 12th grade, no diploma: 34
- High school graduate (or equivalency): 694
- Less than 1 year of college: 182
- Some college more than 1 year, no degree: 298
- Associate degree: 385
- Bachelor's degree: 937
- Master's degree: 416
- Professional school degree: 70
- Doctorate degree: 44


Housing units in structures:
- One, detached: 2,466
- One, attached: 286
- Two: 39
- 3 or 4: 136
- 5 to 9: 195
- 10 to 19: 149
- 20 to 49: 83
- 50 or more: 141
- Mobile homes: 14
House/condo owner moved in on average 13 years ago
Renter moved in on average 6 years ago

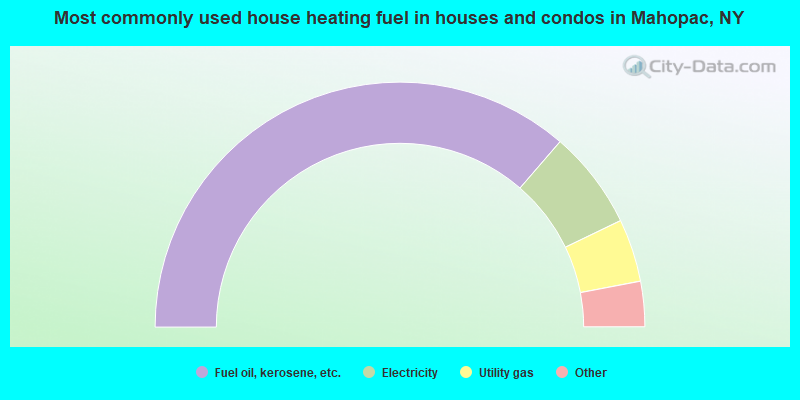
- 72.7%Fuel oil, kerosene, etc.
- 13.0%Electricity
- 8.3%Utility gas
- 3.3%Bottled, tank, or LP gas
- 1.3%Wood
- 0.9%Other fuel
- 0.4%Coal or coke
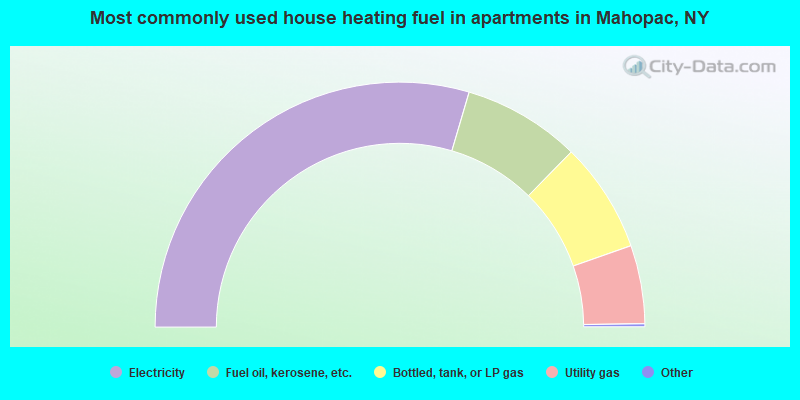
- 59.3%Electricity
- 15.6%Fuel oil, kerosene, etc.
- 14.6%Bottled, tank, or LP gas
- 10.4%Utility gas
Private vs. public school enrollment:
| Here: | 3.8% |
| New York: | 15.6% |
| Here: | 10.2% |
| New York: | 15.0% |
| Here: | 55.9% |
| New York: | 39.2% |


