Malden, MA (Massachusetts) Houses and Residents
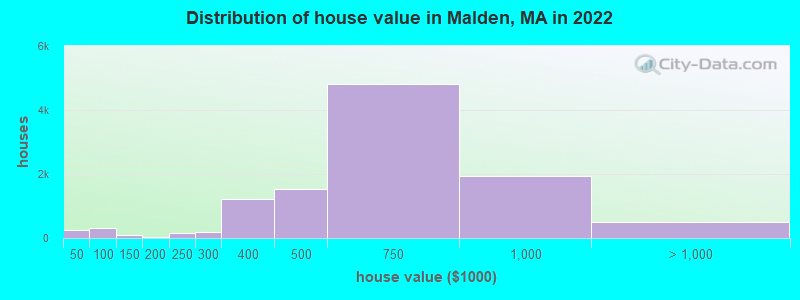
Estimated median house or condo value in 2022: $591,200 (it was $185,100 in 2000 )
Malden:
$591,200Massachusetts:
$534,700
Lower value quartile - upper value quartile: $441,800 - $739,700Mean price in 2022: Detached houses: $700,703 Here:
$700,703State:
$651,570
Townhouses or other attached units: $690,550 Here:
$690,550State:
$617,749
In 2-unit structures: $621,927 Here:
$621,927State:
$594,808
In 3-to-4-unit structures: $420,593 Here:
$420,593State:
$601,912
In 5-or-more-unit structures: $425,426 Here:
$425,426State:
$555,768
Mobile homes: $95,942 Here:
$95,942State:
$170,209
Total population: 60,859 (Urban population: 56,340, Rural population: 0)
Houses: 28,903 (25,834 occupied: 12,183 owner occupied, 13,651 renter occupied )
% of renters here:
53%State:
38%
Housing density: 5,696 houses/condos per square mile
Median price asked for vacant for-sale houses and condos in 2022: $684,048.
Median contract rent in 2022: $1,887 (lower quartile is $1,551, upper quartile is over $2,000)
Median rent asked for vacant for-rent units in 2022: $4,311
Median gross rent in Malden, MA in 2022: over $2,000
Housing units in Malden with a mortgage: 7,320 (1,680 second mortgage, 196 home equity loan, 1,146 both second mortgage and home equity loan )Houses without a mortgage: 251
Median household income for houses/condos with a mortgage: $155,798
Median household income for apartments without a mortgage: $84,019
Median monthly housing costs: $1,983
Data:
Median house or condo value ($)
Median house or condo value ($ change since 2000)
Median house or condo value ($) - White
Median house or condo value ($) - Black or African American
Median house or condo value ($) - Asian
Median house or condo value ($) - Hispanic or Latino
Median house or condo value ($) - American Indian and Alaska Native
Median house or condo value ($) - Multirace
Median house or condo value ($) - Other Race
Median price asked for mobile homes ($)
Household density (households per square mile)
Mean house or condo value by units in structure - 1, detached ($)
Mean house or condo value by units in structure - 1, attached ($)
Mean house or condo value by units in structure - 2 ($)
Mean house or condo value by units in structure by units in structure - 3 or 4 ($)
Mean house or condo value by units in structure - 5 or more ($)
Mean house or condo value by units in structure - Boat, RV, van, etc. ($)
Mean house or condo value by units in structure - Mobile home ($)
Median contract rent ($)
Median contract rent - Lower quartile ($)
Median contract rent - Upper quartile ($)
Median gross rent ($)
Urban houses (%)
Rural houses (%)
Houses occupied (%)
Houses occupied (% change since 2000)
Houses owner occupied (%)
Houses owner occupied (% change since 2000)
Houses renter occupied (%)
Houses renter occupied (% change since 2000)
Vacant housing units - For rent (%)
Vacant housing units - For rent (% change since 2000)
Vacant housing units - For sale only (%)
Vacant housing units - For sale only (% change since 2000)
Vacant housing units - Rented or sold, not occupied (%)
Vacant housing units - Rented or sold, not occupied (% change since 2000)
Vacant housing units - For seasonal, recreational, or occasional use (%)
Vacant housing units - For seasonal, recreational, or occasional use (% change since 2000)
Vacant housing units - For migrant workers (%)
Vacant housing units - For migrant workers (% change since 2000)
Vacant housing units - Other vacant (%)
Vacant housing units - Other vacant (% change since 2000)
Median monthly housing costs ($)
Median household income for houses/condos with a mortgage ($)
Median household income for houses/condos without a mortgage ($)
Median household income ($)
Median household income ($) - White
Median household income ($) - Black or African American
Median household income ($) - Asian
Median household income ($) - Hispanic or Latino
Median household income ($) - American Indian and Alaska Native
Median household income ($) - Multirace
Median household income ($) - Other Race
Mortgage status - with mortgage (%)
Mortgage status - with second mortgage (%)
Mortgage status - with home equity loan (%)
Mortgage status - with both second mortgage and home equity loan (%)
Mortgage status - without a mortgage (%)
Median year house/condo built
Median year apartment built
Household type by relationship - Male householder living alone (%)
Household type by relationship - Male householder not living alone (%)
Household type by relationship - Female householder living alone (%)
Household type by relationship - Female householder not living alone (%)
Household type by relationship - Opposite-Sex spouse (%)
Household type by relationship - Same-Sex spouse (%)
Household type by relationship - Opposite-Sex unmarried partner (%)
Household type by relationship - Same-Sex unmarried partner (%)
Household type by relationship - In group quarters (%)
Size of family households - 2-person household (%)
Size of family households - 3-person household (%)
Size of family households - 4-person household (%)
Size of family households - 5-person household (%)
Size of family households - 6-person household (%)
Size of family households - 7-or-more-person household (%)
Size of nonfamily households - 1-person household (%)
Size of nonfamily households - 2-person household (%)
Size of nonfamily households - 3-person household (%)
Size of nonfamily households - 4-person household (%)
Size of nonfamily households - 5-person household (%)
Size of nonfamily households - 6-person household (%)
Size of nonfamily households - 7-or-moreperson household (%)
Year house built - Built 2010 or later (%)
Year house built - Built 2000 to 2009 (%)
Year house built - Built 1990 to 1999 (%)
Year house built - Built 1980 to 1989 (%)
Year house built - Built 1970 to 1979 (%)
Year house built - Built 1960 to 1969 (%)
Year house built - Built 1950 to 1959 (%)
Year house built - Built 1940 to 1949 (%)
Year house built - Built 1939 or earlier (%)
Median number of rooms in houses and condos
Median number of rooms in apartments
Median number of bedrooms in owner occupied houses
Mean number of bedrooms in owner occupied houses
Median number of bedrooms in renter occupied houses
Mean number of bedrooms in renter occupied houses
Median number of vehichles in owner occupied houses
Mean number of vehichles in owner occupied houses
Median number of vehichles in renter occupied houses
Mean number of vehichles in renter occupied houses
Rooms in owner-occupied houses - 1 room (%)
Rooms in owner-occupied houses - 2 rooms (%)
Rooms in owner-occupied houses - 3 rooms (%)
Rooms in owner-occupied houses - 4 rooms (%)
Rooms in owner-occupied houses - 5 rooms (%)
Rooms in owner-occupied houses - 6 rooms (%)
Rooms in owner-occupied houses - 7 rooms (%)
Rooms in owner-occupied houses - 8 rooms (%)
Rooms in owner-occupied houses - 9+ rooms (%)
Rooms in renter-occupied houses - 1 room (%)
Rooms in renter-occupied houses - 2 rooms (%)
Rooms in renter-occupied houses - 3 rooms (%)
Rooms in renter-occupied houses - 4 rooms (%)
Rooms in renter-occupied houses - 5 rooms (%)
Rooms in renter-occupied houses - 6 rooms (%)
Rooms in renter-occupied houses - 7 rooms (%)
Rooms in renter-occupied houses - 8 rooms (%)
Rooms in renter-occupied houses - 9+ rooms (%)
Bedrooms in owner-occupied houses - no bedrooms (%)
Bedrooms in owner-occupied houses - 1 bedroom (%)
Bedrooms in owner-occupied houses - 2 bedrooms (%)
Bedrooms in owner-occupied houses - 3 bedrooms (%)
Bedrooms in owner-occupied houses - 4 bedrooms (%)
Bedrooms in owner-occupied houses - 5+ bedrooms (%)
Bedrooms in renter-occupied houses - no bedrooms (%)
Bedrooms in renter-occupied houses - 1 bedroom (%)
Bedrooms in renter-occupied houses - 2 bedrooms (%)
Bedrooms in renter-occupied houses - 3 bedrooms (%)
Bedrooms in renter-occupied houses - 4 bedrooms (%)
Bedrooms in renter-occupied houses - 5+ bedrooms (%)
Vehicles available in owner-occupied houses - no vehicle available (%)
Vehicles available in owner-occupied houses - 1 vehicle available(%)
Vehicles available in owner-occupied houses - 2 Vehicles available (%)
Vehicles available in owner-occupied houses - 3 Vehicles available (%)
Vehicles available in owner-occupied houses - 4 Vehicles available (%)
Vehicles available in owner-occupied houses - 5+ Vehicles available (%)
Vehicles available in renter-occupied houses - no vehicle available (%)
Vehicles available in renter-occupied houses - 1 vehicle available (%)
Vehicles available in renter-occupied houses - 2 Vehicles available (%)
Vehicles available in renter-occupied houses - 3 Vehicles available (%)
Vehicles available in renter-occupied houses - 4 Vehicles available (%)
Vehicles available in renter-occupied houses - 5+ Vehicles available (%)
Housing units in structures - 1, detached (%)
Housing units in structures - 1, attached (%)
Housing units in structures - 2 (%)
Housing units in structures - 3 or 4 (%)
Housing units in structures - 5 to 9 (%)
Housing units in structures - 10 to 19 (%)
Housing units in structures - 20 to 49 (%)
Housing units in structures - 50 or more (%)
Housing units in structures - Mobile home (%)
Housing units in structures - Boat, RV, van, etc. (%)
Housing units in structures - Owners - 1, detached (%)
Housing units in structures - Owners - 1, attached (%)
Housing units in structures - Owners - 2 (%)
Housing units in structures - Owners - 3 or 4 (%)
Housing units in structures - Owners - 5 to 9 (%)
Housing units in structures - Owners - 10 to 19 (%)
Housing units in structures - Owners - 20 to 49 (%)
Housing units in structures - Owners - 50 or more (%)
Housing units in structures - Owners - Mobile home (%)
Housing units in structures - Owners - Boat, RV, van, etc. (%)
Housing units in structures - Renters - 1, detached (%)
Housing units in structures - Renters - 1, attached (%)
Housing units in structures - Renters - 2 (%)
Housing units in structures - Renters - 3 or 4 (%)
Housing units in structures - Renters - 5 to 9 (%)
Housing units in structures - Renters - 10 to 19 (%)
Housing units in structures - Renters - 20 to 49 (%)
Housing units in structures - Renters - 50 or more (%)
Housing units in structures - Renters - Mobile home (%)
Housing units in structures - Renters - Boat, RV, van, etc. (%)
House/condo owner moved in on average (years ago)
Renter moved in on average (years ago)
Year householder moved into unit - Moved in 1999 to March 2000 (%)
Year householder moved into unit - Moved in 1999 to March 2000 (%) - White
Year householder moved into unit - Moved in 1999 to March 2000 (%) - Black or African American
Year householder moved into unit - Moved in 1999 to March 2000 (%) - Asian
Year householder moved into unit - Moved in 1999 to March 2000 (%) - Hispanic or Latino
Year householder moved into unit - Moved in 1999 to March 2000 (%) - American Indian and Alaska Native
Year householder moved into unit - Moved in 1999 to March 2000 (%) - Multirace
Year householder moved into unit - Moved in 1999 to March 2000 (%) - Other Race
Year householder moved into unit - Moved in 1995 to 1998 (%)
Year householder moved into unit - Moved in 1995 to 1998 (%) - White
Year householder moved into unit - Moved in 1995 to 1998 (%) - Black or African American
Year householder moved into unit - Moved in 1995 to 1998 (%) - Asian
Year householder moved into unit - Moved in 1995 to 1998 (%) - Hispanic or Latino
Year householder moved into unit - Moved in 1995 to 1998 (%) - American Indian and Alaska Native
Year householder moved into unit - Moved in 1995 to 1998 (%) - Multirace
Year householder moved into unit - Moved in 1995 to 1998 (%) - Other Race
Year householder moved into unit - Moved in 1990 to 1994 (%)
Year householder moved into unit - Moved in 1990 to 1994 (%) - White
Year householder moved into unit - Moved in 1990 to 1994 (%) - Black or African American
Year householder moved into unit - Moved in 1990 to 1994 (%) - Asian
Year householder moved into unit - Moved in 1990 to 1994 (%) - Hispanic or Latino
Year householder moved into unit - Moved in 1990 to 1994 (%) - American Indian and Alaska Native
Year householder moved into unit - Moved in 1990 to 1994 (%) - Multirace
Year householder moved into unit - Moved in 1990 to 1994 (%) - Other Race
Year householder moved into unit - Moved in 1980 to 1989 (%)
Year householder moved into unit - Moved in 1980 to 1989 (%) - White
Year householder moved into unit - Moved in 1980 to 1989 (%) - Black or African American
Year householder moved into unit - Moved in 1980 to 1989 (%) - Asian
Year householder moved into unit - Moved in 1980 to 1989 (%) - Hispanic or Latino
Year householder moved into unit - Moved in 1980 to 1989 (%) - American Indian and Alaska Native
Year householder moved into unit - Moved in 1980 to 1989 (%) - Multirace
Year householder moved into unit - Moved in 1980 to 1989 (%) - Other Race
Year householder moved into unit - Moved in 1970 to 1979 (%)
Year householder moved into unit - Moved in 1970 to 1979 (%) - White
Year householder moved into unit - Moved in 1970 to 1979 (%) - Black or African American
Year householder moved into unit - Moved in 1970 to 1979 (%) - Asian
Year householder moved into unit - Moved in 1970 to 1979 (%) - Hispanic or Latino
Year householder moved into unit - Moved in 1970 to 1979 (%) - American Indian and Alaska Native
Year householder moved into unit - Moved in 1970 to 1979 (%) - Multirace
Year householder moved into unit - Moved in 1970 to 1979 (%) - Other Race
Year householder moved into unit - Moved in 1969 or earlier (%)
Year householder moved into unit - Moved in 1969 or earlier (%) - White
Year householder moved into unit - Moved in 1969 or earlier (%) - Black or African American
Year householder moved into unit - Moved in 1969 or earlier (%) - Asian
Year householder moved into unit - Moved in 1969 or earlier (%) - Hispanic or Latino
Year householder moved into unit - Moved in 1969 or earlier (%) - American Indian and Alaska Native
Year householder moved into unit - Moved in 1969 or earlier (%) - Multirace
Year householder moved into unit - Moved in 1969 or earlier (%) - Other Race
Housing units lacking complete plumbing facilities (%)
Housing units lacking complete kitchen facilities (%)
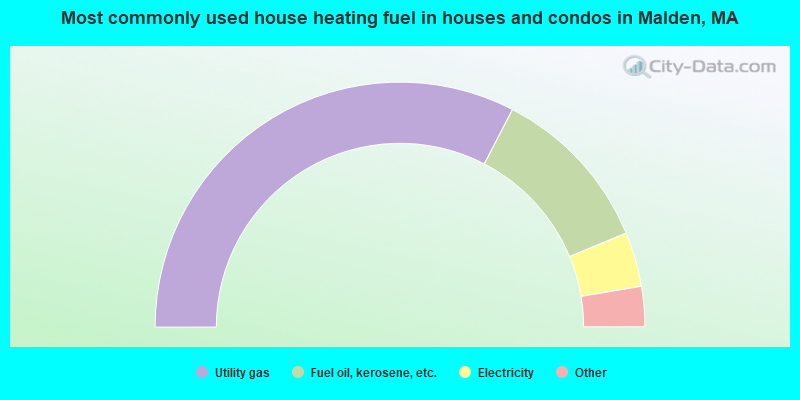
House heating fuel used in houses and condos - Utility gas (%)
House heating fuel used in houses and condos - Bottled, tank, or LP gas (%)
House heating fuel used in houses and condos - Electricity (%)
House heating fuel used in houses and condos - Fuel oil, kerosene, etc. (%)
House heating fuel used in houses and condos - Coal or coke (%)
House heating fuel used in houses and condos - Wood (%)
House heating fuel used in houses and condos - Solar energy (%)
House heating fuel used in houses and condos - Other fuel (%)
House heating fuel used in houses and condos - No fuel used (%)
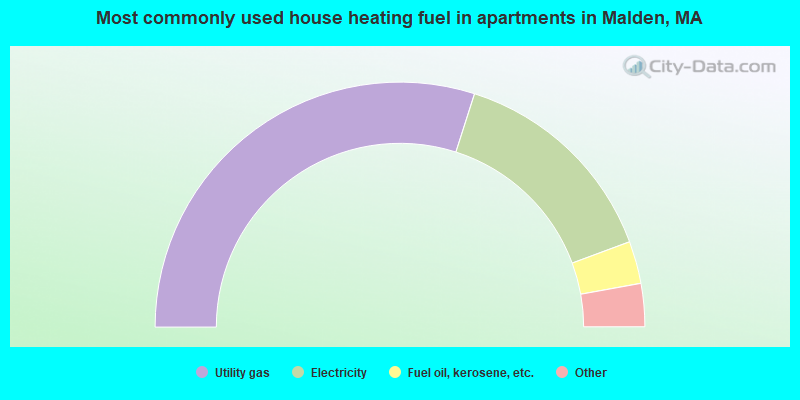
House heating fuel used in apartments - Utility gas (%)
House heating fuel used in apartments - Bottled, tank, or LP gas (%)
House heating fuel used in apartments - Electricity (%)
House heating fuel used in apartments - Fuel oil, kerosene, etc. (%)
House heating fuel used in apartments - Coal or coke (%)
House heating fuel used in apartments - Wood (%)
House heating fuel used in apartments - Solar energy (%)
House heating fuel used in apartments - Other fuel (%)
House heating fuel used in apartments - No fuel used (%)
Latest news about housing in Malden, MA collected exclusively by city-data.com from local newspapers, TV, and radio stations
Median year house/condo built: 1941Median year apartment built: 1961Household type by relationship:
Households: 64,718
Male householders: 14,416 (3,535 living alone ), Female householders: 11,418 (3,202 living alone )11,388 spouses (11,008 opposite-sex spouses ), 2,474 unmarried partners , (2,474 opposite-sex unmarried partners ), 15,879 children (15,164 natural , 199 adopted , 516 stepchildren ), 675 grandchildren , 1,574 brothers or sisters , 2,270 parents , 0 foster children , 1,270 other relatives , 3,075 non-relatives In group quarters: 279
Size of family households: 5,562 2-persons , 3,528 3-persons , 3,753 4-persons , 1,717 5-persons , 745 6-persons , 329 7-or-more-persons .
Size of nonfamily households: 6,737 1-person , 2,674 2-persons , 789 3-persons .
8,019 married couples with children. single-parent households (932 men , 1,505 women ).
49.0% of residents of Malden speak English at home. of residents speak Spanish at home (59% speak English very well , 27% speak English well , 12% speak English not well , 2% don't speak English at all ).of residents speak other Indo-European language at home (52% speak English very well , 23% speak English well , 16% speak English not well , 9% don't speak English at all ).of residents speak Asian or Pacific Island language at home (38% speak English very well , 32% speak English well , 19% speak English not well , 11% don't speak English at all ).of residents speak other language at home (39% speak English very well , 43% speak English well , 15% speak English not well , 2% don't speak English at all ).
Foreign born population: 27,145 (41.9%)of them are naturalized citizens )
Median number of rooms in houses and condos:
Median number of rooms in apartments
Owner-occupied Renter-occupied
Rooms in owner-occupied houses in Malden, Massachusetts
98 1 room 0 2 rooms 1,181 3 rooms 1,247 4 rooms 1,707 5 rooms 4,282 6 rooms 1,231 7 rooms 1,047 8 rooms 1,390 9+ rooms
Rooms in renter-occupied apartments in Malden, Massachusetts
1,383 1 room 1,175 2 rooms 2,877 3 rooms 3,035 4 rooms 3,112 5 rooms 1,510 6 rooms 105 7 rooms 362 8 rooms 92 9+ rooms
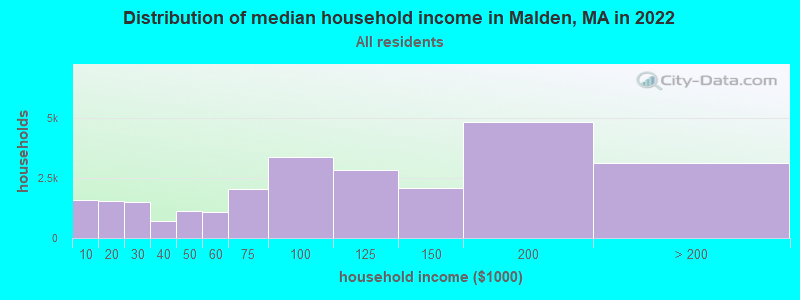
Malden, MA household income distribution 1,570 Less than $10,0001,531 $10,000 to $19,9991,493 $20,000 to $29,999719 $30,000 to $39,9991,117 $40,000 to $49,9991,088 $50,000 to $59,9992,038 $60,000 to $74,9993,391 $75,000 to $99,9992,828 $100,000 to $124,9992,086 $125,000 to $149,9994,838 $150,000 to $199,9993,135 $200,000 or more
Home value of owner - occupied houses in 2022 in Malden, MA 71 Less than $10,00024 $20,000 to $24,99938 $25,000 to $29,9994 $30,000 to $34,999113 $40,000 to $49,99922 $50,000 to $59,99948 $60,000 to $69,99961 $80,000 to $89,99966 $90,000 to $99,99983 $100,000 to $124,99935 $175,000 to $199,999142 $200,000 to $249,999174 $250,000 to $299,9991,205 $300,000 to $399,9991,523 $400,000 to $499,9994,812 $500,000 to $749,9991,951 $750,000 to $999,999334 $1,000,000 to $1,499,99915 $1,500,000 to $1,999,999142 $2,000,000 or moreRent paid by renters in 2022 in Malden, MA 51 Less than $100261 $100 to $149103 $150 to $19998 $200 to $249470 $250 to $299262 $300 to $349180 $350 to $399156 $400 to $44930 $450 to $499145 $500 to $54918 $550 to $599176 $600 to $649102 $650 to $699145 $700 to $74969 $750 to $79991 $800 to $899196 $900 to $999793 $1,000 to $1,249905 $1,250 to $1,4995,011 $1,500 to $1,9993,629 $2,000 to $2,4991,307 $2,500 to $2,999301 $3,000 to $3,499225 $3,500 or more496 No cash rent
Percentage of workers working in this county: 58.0%Number of people working at home: 6,322 (17.1% of all workers )
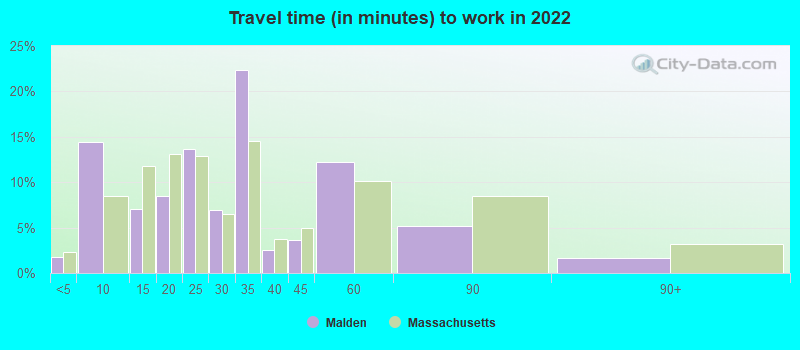
Travel time to work (commute)
Less than 5 minutes: 2325 to 9 minutes: 1,62410 to 14 minutes: 3,05915 to 19 minutes: 2,41920 to 24 minutes: 3,71525 to 29 minutes: 1,55530 to 34 minutes: 7,28235 to 39 minutes: 1,08140 to 44 minutes: 1,56045 to 59 minutes: 4,23260 to 89 minutes: 2,96090 or more minutes: 871
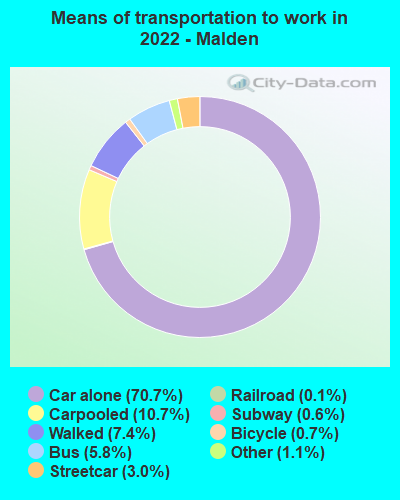
Means of transportation to work:
Drove a car alone: 8,455 (46.8%)Carpooled: 1,332 (7.4%)Bus : 552 (3.1%)Subway or elevated rail : 353 (2.0%)Long-distance train or commuter rail : 49 (0.3%)Light rail, streetcar or trolley : 20 (0.1%)Taxi: 166 (0.9%)Bicycle: 103 (0.6%)Walked: 918 (5.1%)Worked at home: 6,736 (37.3%)
Unemployment by race in 2022
Unemployment rate for White non-Hispanic residents 4.7% Males1.4% FemalesUnemployment rate for Black residents 7.6% Males2.7% FemalesUnemployment rate for Asian residents 6.1% Males2.8% FemalesUnemployment rate for other race residents 3.8% FemalesUnemployment rate for two or more race residents 4.2% Males10.7% FemalesUnemployment rate for Hispanic or Latino residents 5.4% Males5.8% Females
Year of entry for the foreign-born population in Malden, Massachusetts
12,868 2010 or later 5,977 2000 to 2009 4,514 1990 to 1999 4,613 1980 to 1989 1,349 1970 to 1979 1,290 Before 1970
First ancestries reported:
Brazilian: 2,724 (7.1%)
Haitian: 2,603 (6.8%)
Italian: 2,270 (5.9%)
Irish: 2,203 (5.7%)
American: 1,626 (4.2%)
Ethiopian: 1,120 (2.9%)
English: 541 (1.4%)
Albanian: 415 (1.1%)
Moroccan: 409 (1.1%)
Yugoslavian: 374 (1.0%)
Polish: 345 (0.9%)
African: 306 (0.8%)
Turkish: 302 (0.8%)
Jamaican: 281 (0.7%)
German: 267 (0.7%)
French Canadian: 265 (0.7%)
Portuguese: 238 (0.6%)
Serbian: 203 (0.5%)
Ukrainian: 187 (0.5%)
French: 180 (0.5%)
Russian: 161 (0.4%)
Arab: 150 (0.4%)
Bulgarian: 121 (0.3%)
Greek: 111 (0.3%)
Armenian: 89 (0.2%)
Syrian: 80 (0.2%)
Scottish: 79 (0.2%)
Iranian: 74 (0.2%)
European: 72 (0.2%)
Eastern European: 71 (0.2%)
Canadian: 61 (0.2%)
Cape Verdean: 54 (0.1%)
Liberian: 51 (0.1%)
British West Indian: 41 (0.1%)
Egyptian: 41 (0.1%)
Ghanaian: 40 (0.1%)
Finnish: 39 (0.1%)
British: 33 (0.09%)
Trinidadian and Tobagonian: 31 (0.08%)
Palestinian: 29 (0.08%)
Guyanese: 28 (0.07%)
Pennsylvania German: 23 (0.06%)
Nigerian: 22 (0.06%)
Dutch: 19 (0.05%)
Dutch West Indian: 18 (0.05%)
Hungarian: 9 (0.02%)
Kenyan: 8 (0.02%)
Czech: 7 (0.02%)
Slavic: 6 (0.02%)
Swedish: 2 (0.01%)
Scandinavian: 2 (0.01%)
Most common places of birth for foreign-born residents (%): China, excluding Hong Kong and Taiwan Malden:
22.7% (6,330)Massachusetts:
8.4% (103,233)
Brazil Malden:
15.0% (4,183)Massachusetts:
7.6% (92,959)
Haiti Malden:
9.7% (2,691)Massachusetts:
4.9% (60,432)
India Malden:
6.6% (1,834)Massachusetts:
6.8% (82,934)
Vietnam Malden:
5.2% (1,446)Massachusetts:
3.0% (37,197)
El Salvador Malden:
3.3% (933)Massachusetts:
3.7% (45,667)
Ethiopia Malden:
2.8% (775)Massachusetts:
0.4% (5,467)
Bosnia and Herzegovina Malden:
2.4% (679)Massachusetts:
0.2% (1,916)
Nepal Malden:
2.4% (662)Massachusetts:
0.6% (6,789)
Morocco Malden:
2.3% (651)Massachusetts:
0.7% (8,562)
Albania Malden:
1.9% (522)Massachusetts:
1.1% (13,076)
Serbia Malden:
1.8% (511)Massachusetts:
0.1% (1,277)
Colombia Malden:
1.7% (461)Massachusetts:
2.3% (27,810)
Guatemala Malden:
1.5% (423)Massachusetts:
2.7% (32,733)
Place of birth for U.S.-born residents:
This state: 25,475Other state: 11,255Northeast: 5,213Midwest: 1,436South: 3,127West: 1,479 84.3% of Malden residents lived in the same house 1 years ago.
Out of people who lived in different houses, 35.3% lived in this county.
Out of people who lived in different counties, 68.0% lived in Massachusetts.
Malden:
84.3%State average:
87.7%
Education attainment for males 25 years and older:
No schooling: 765Nursery to 4th grade: 3055th and 6th grade: 537th and 8th grade: 1339th grade: 8710th grade: 19811th grade: 63812th grade, no diploma: 1,047High school graduate (or equivalency): 5,864Less than 1 year of college: 988Some college more than 1 year, no degree: 2,199Associate degree: 1,466Bachelor's degree: 5,855Master's degree: 2,630Professional school degree: 236Doctorate degree: 1,657
Education attainment for females 25 years and older:
No schooling: 1,612Nursery to 4th grade: 05th and 6th grade: 2927th and 8th grade: 2629th grade: 2210th grade: 21111th grade: 13012th grade, no diploma: 1,208High school graduate (or equivalency): 5,018Less than 1 year of college: 740Some college more than 1 year, no degree: 1,885Associate degree: 1,859Bachelor's degree: 5,437Master's degree: 4,460Professional school degree: 458Doctorate degree: 647
Housing units in structures:
One, detached: 7,439One, attached: 1,404Two: 5,5693 or 4: 3,9845 to 9: 1,19510 to 19: 95020 to 49: 2,71450 or more: 5,116Mobile homes: 249Boats, RVs, vans, etc.: 283Housing units lacking complete plumbing facilities in 2022: 0.2%Housing units lacking complete kitchen facilities in 2022: 1.0%House/condo owner moved in on average 14 years ago
Renter moved in on average 3 years ago
Private vs. public school enrollment:
Students in private schools in grades 1 to 8 (elementary and middle school): 404 Here:
8.8%Massachusetts:
10.3%
Students in private schools in grades 9 to 12 (high school): 277 Here:
11.3%Massachusetts:
12.3%
Students in private undergraduate colleges: 1,518 Here:
46.4%Massachusetts:
51.2%