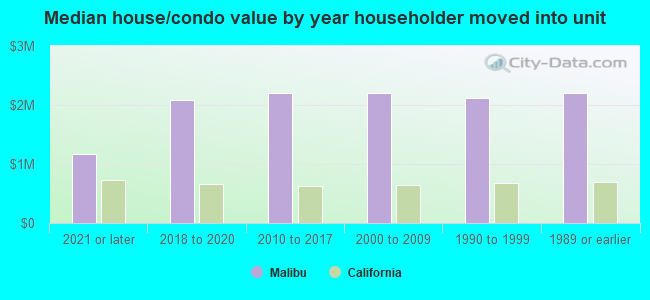
Malibu, CA (California) Houses and Residents
| Malibu: | $2,200,493 |
| California: | $715,900 |
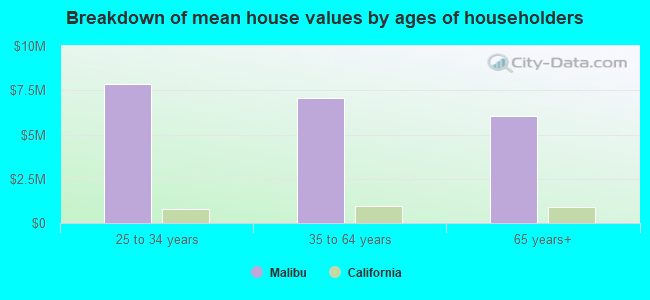
Mean price in 2022:
Detached houses: $5,643,476
Here: $5,643,476 State: $988,808 Townhouses or other attached units: $2,126,421
Here: $2,126,421 State: $838,546 In 2-unit structures: $5,954,975
Here: $5,954,975 State: $1,138,100 In 3-to-4-unit structures: $2,206,579
Here: $2,206,579 State: $824,253 In 5-or-more-unit structures: $2,179,081
Here: $2,179,081 State: $730,996 Mobile homes: $1,474,588
Here: $1,474,588 State: $184,506
Total population: 12,958 (Urban population: 11,142, Rural population: 1,372 (all nonfarm))
Houses: 6,813 (4,452 occupied: 3,419 owner occupied, 1,050 renter occupied)
| % of renters here: | 23% |
| State: | 44% |
Housing density: 343 houses/condos per square mile
Median price asked for vacant for-sale houses and condos in 2022: $4,074,114.
Median contract rent in 2022: over $2,000
Median rent asked for vacant for-rent units in 2022: $3,387
Median gross rent in Malibu, CA in 2022: over $2,000
Housing units in Malibu with a mortgage: 1,995 (402 second mortgage, 12 home equity loan, 372 both second mortgage and home equity loan)
Houses without a mortgage: 44
Median household income for houses/condos with a mortgage: $235,939
Median household income for apartments without a mortgage: $152,404
Median monthly housing costs: $3,759
Compare current foreclosures near Malibu, CA:
| Photo | Address | Area | Beds / Baths | Price | Details |
|---|---|---|---|---|---|

|
#1
Pacific Coast Hwy
Malibu, CA 90265
|
2,020 sq. feet
|
3 baths 3 beds |
show details | |

|
#2
Victoria Point Rd
Malibu, CA 90265
|
3,362 sq. feet
|
3 baths 3 beds |
show details | |

|
#3
Sea Vista Dr
Malibu, CA 90265
|
5,225 sq. feet
|
6 baths 5 beds |
show details | |

|
#4
Decker Edison Rd
Malibu, CA 90265
|
3,750 sq. feet
|
4 baths 2 beds |
show details | |

|
#5
Victoria Point Rd
Malibu, CA 90265
|
3,362 sq. feet
|
3 baths 3 beds |
show details | |

|
#6
Sea Vista Dr
Malibu, CA 90265
|
5,225 sq. feet
|
6 baths 5 beds |
show details | |

|
#7
Decker Edison Rd
Malibu, CA 90265
|
3,750 sq. feet
|
4 baths 2 beds |
show details | |

|
#8
Ebbtide Ln
Malibu, CA 90265
|
1,075 sq. feet
|
2 baths 2 beds |
show details | |

|
#9
Coastline Dr Apt 2
Malibu, CA 90265
|
- sq. feet
|
- baths - beds |
show details | |

|
#10
Mulholland Hwy
Malibu, CA 90265
|
- sq. feet
|
- baths - beds |
show details |
| Photo | Address | Area | Beds / Baths | Price | Details |
|---|---|---|---|---|---|

|
#11
Pacific Coast Hwy Ste 2b
Malibu, CA 90265
|
- sq. feet
|
- baths - beds |
show details | |

|
#12
Pacific Coast Hwy
Malibu, CA 90265
|
- sq. feet
|
- baths - beds |
show details | |

|
#13
W Moon Shadows Dr
Malibu, CA 90265
|
- sq. feet
|
- baths - beds |
show details | |

|
#14
Piuma Rd
Malibu, CA 90265
|
- sq. feet
|
- baths - beds |
show details | |

|
#15
Pacific Coast Hwy # 775
Malibu, CA 90265
|
- sq. feet
|
- baths - beds |
show details | |

|
#16
Calvin Ave
Tarzana, CA 91356
|
5,107 sq. feet
|
4 baths 6 beds |
show details | |

|
#17
Vicky Ave
Canoga Park, CA 91304
|
1,639 sq. feet
|
3 baths 4 beds |
show details | |

|
#18
Church St
Simi Valley, CA 93065
|
1,303 sq. feet
|
2 baths 3 beds |
show details | |

|
#19
Cozycroft Ave
Winnetka, CA 91306
|
1,342 sq. feet
|
2 baths 4 beds |
show details | |

|
#20
Melvin Ave
Tarzana, CA 91356
|
1,208 sq. feet
|
1 baths 3 beds |
show details |
| Photo | Address | Area | Beds / Baths | Price | Details |
|---|---|---|---|---|---|

|
#21
Aquarius Ave
Agoura Hills, CA 91301
|
2,347 sq. feet
|
3 baths 5 beds |
show details | |

|
#22
Woodlake Ave
Woodland Hills, CA 91367
|
843 sq. feet
|
1 baths 2 beds |
show details | |

|
#23
La Barca Dr
Tarzana, CA 91356
|
3,571 sq. feet
|
3 baths 5 beds |
show details | |

|
#24
Aetna St
Woodland Hills, CA 91367
|
2,401 sq. feet
|
3 baths 3 beds |
show details | |

|
#25
Covello St
West Hills, CA 91307
|
2,504 sq. feet
|
3 baths 5 beds |
show details | |

|
#26
Shoup Ave
West Hills, CA 91307
|
1,975 sq. feet
|
2 baths 4 beds |
show details | |

|
#27
Coulter Ct
Simi Valley, CA 93065
|
1,596 sq. feet
|
2 baths 5 beds |
show details | |

|
#28
Gilmore St
Winnetka, CA 91306
|
1,350 sq. feet
|
2 baths 3 beds |
show details | |

|
#29
Old Topanga Canyon Rd
Topanga, CA 90290
|
3,305 sq. feet
|
3 baths 3 beds |
show details | |

|
#30
Philiprimm St
Woodland Hills, CA 91367
|
3,164 sq. feet
|
3 baths 5 beds |
show details |
| Photo | Address | Area | Beds / Baths | Price | Details |
|---|---|---|---|---|---|

|
#31
El Medio Ave
Pacific Palisades, CA 90272
|
4,724 sq. feet
|
3 baths 4 beds |
show details | |

|
#32
Roosevelt Ct
Simi Valley, CA 93065
|
3,691 sq. feet
|
3 baths 4 beds |
show details | |

|
#33
Calmfield Ave
Agoura Hills, CA 91301
|
1,924 sq. feet
|
2 baths 4 beds |
show details | |

|
#34
W Sunset Blvd Apt 302
Pacific Palisades, CA 90272
|
1,396 sq. feet
|
2 baths 2 beds |
show details | |

|
#35
Gifford St
Winnetka, CA 91306
|
2,004 sq. feet
|
2 baths 3 beds |
show details | |

|
#36
Loire Valley Dr
Simi Valley, CA 93065
|
5,100 sq. feet
|
5 baths 4 beds |
show details | |

|
#37
Alonzo Ave
Encino, CA 91316
|
5,538 sq. feet
|
3 baths 5 beds |
show details | |

|
#38
Victory Blvd
Woodland Hills, CA 91367
|
1,276 sq. feet
|
2 baths 3 beds |
show details | |

|
#39
Hooper Ave
Simi Valley, CA 93065
|
1,676 sq. feet
|
2 baths 3 beds |
show details | |

|
#40
Marigold Pl
Thousand Oaks, CA 91360
|
2,105 sq. feet
|
2 baths 3 beds |
show details |
| Photo | Address | Area | Beds / Baths | Price | Details |
|---|---|---|---|---|---|

|
#41
Justice St
Canoga Park, CA 91304
|
3,042 sq. feet
|
3 baths 4 beds |
show details | |

|
#42
Cantlay St
West Hills, CA 91307
|
3,014 sq. feet
|
3 baths 4 beds |
show details | |

|
#43
Azure Hills Dr
Simi Valley, CA 93065
|
3,187 sq. feet
|
3 baths 4 beds |
show details | |

|
#44
Adirondack Ct
Simi Valley, CA 93065
|
2,388 sq. feet
|
2 baths 4 beds |
show details | |

|
#45
Nadir St
Canoga Park, CA 91304
|
1,875 sq. feet
|
2 baths 4 beds |
show details | |

|
#46
Bear Creek Ct
Newbury Park, CA 91320
|
1,771 sq. feet
|
2 baths 3 beds |
show details | |

|
#47
Amarelle St
Newbury Park, CA 91320
|
2,742 sq. feet
|
3 baths 4 beds |
show details | |

|
#48
Plumeria Cir
Thousand Oaks, CA 91360
|
1,493 sq. feet
|
2 baths 3 beds |
show details | |

|
#49
Darnoch Way
West Hills, CA 91307
|
1,538 sq. feet
|
2 baths 4 beds |
show details | |

|
Check over 1 million property listings on Foreclosure.com!
|
browse all offers | |||

Latest news about housing in Malibu, CA collected exclusively by city-data.com from local newspapers, TV, and radio stations


Median year apartment built: 1969
Household type by relationship:
Households: 10,465- Male householders: 2,474 (700 living alone), Female householders: 1,831 (627 living alone)
2,218 spouses (2,188 opposite-sex spouses), 222 unmarried partners, (222 opposite-sex unmarried partners), 2,670 children (2,458 natural, 8 adopted, 203 stepchildren), 225 grandchildren, 10 brothers or sisters, 49 parents, 0 foster children, 321 other relatives, 310 non-relatives
- In group quarters: 130
Size of family households: 1,368 2-persons, 538 3-persons, 506 4-persons, 337 5-persons, 47 6-persons, 11 7-or-more-persons.
Size of nonfamily households: 1,424 1-person, 243 2-persons, 21 3-persons, 4 4-persons.
1,362 married couples with children.
441 single-parent households (277 men, 164 women).
84.2% of residents of Malibu speak English at home.
7.2% of residents speak Spanish at home (78% speak English very well, 16% speak English well, 5% speak English not well, 1% don't speak English at all).
8.0% of residents speak other Indo-European language at home (94% speak English very well, 6% speak English well).
2.3% of residents speak Asian or Pacific Island language at home (47% speak English very well, 41% speak English well, 12% speak English not well).
0.2% of residents speak other language at home (100% speak English very well).
Foreign born population: 1,614 (15.4%)
(70.8% of them are naturalized citizens)
| Here: | 6.2 |
| State: | 6.0 |
| Here: | 5.1 |
| State: | 3.9 |
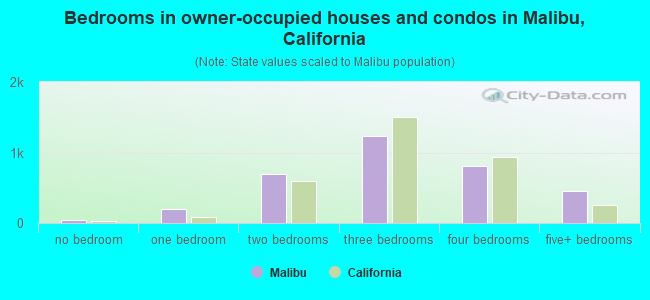
- Bedrooms in owner-occupied houses and condos in Malibu, California
- 38no bedroom
- 1951 bedroom
- 7012 bedrooms
- 1,2343 bedrooms
- 8034 bedrooms
- 4495+ bedrooms
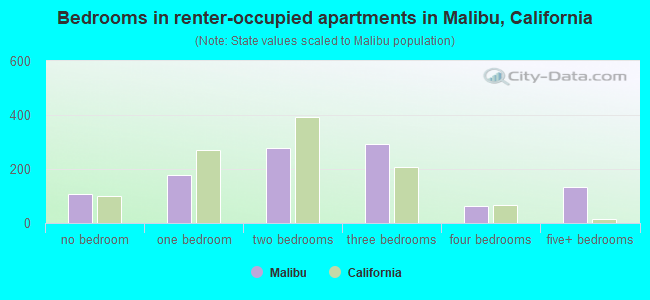
- Bedrooms in renter-occupied apartments in Malibu, California
- 106no bedroom
- 1771 bedroom
- 2782 bedrooms
- 2913 bedrooms
- 634 bedrooms
- 1355+ bedrooms
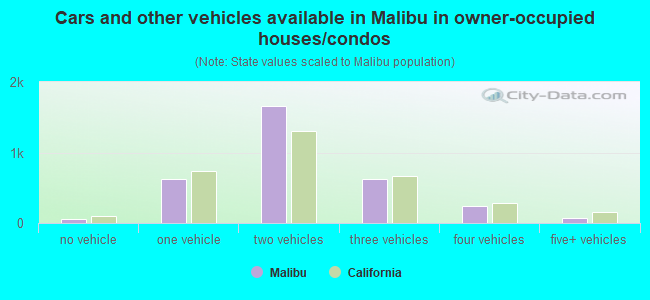
- Cars and other vehicles available in Malibu in owner-occupied houses/condos
- 54no vehicle
- 5461 vehicle
- 1,7962 vehicles
- 6443 vehicles
- 2754 vehicles
- 1055+ vehicles
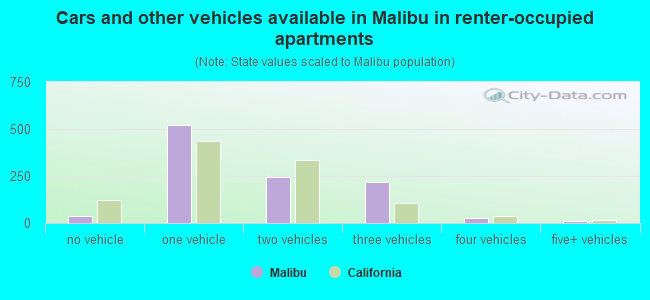
- Cars and other vehicles available in Malibu in renter-occupied apartments
- 35no vehicle
- 5211 vehicle
- 2432 vehicles
- 2163 vehicles
- 244 vehicles
- 115+ vehicles
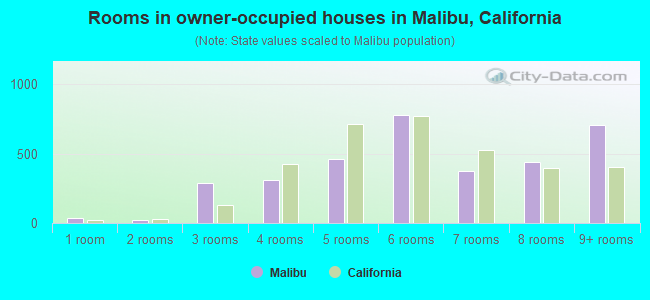
- Rooms in owner-occupied houses in Malibu, California
- 381 room
- 252 rooms
- 2893 rooms
- 3114 rooms
- 4615 rooms
- 7796 rooms
- 3747 rooms
- 4388 rooms
- 7059+ rooms
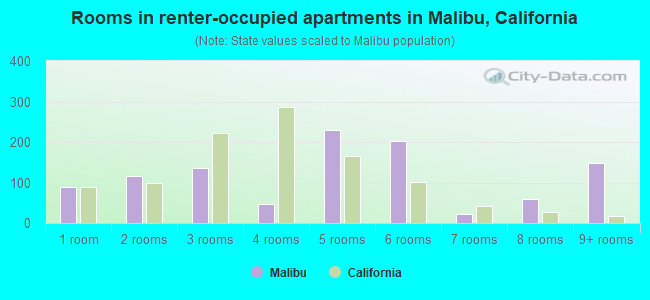
- Rooms in renter-occupied apartments in Malibu, California
- 891 room
- 1172 rooms
- 1373 rooms
- 484 rooms
- 2295 rooms
- 2036 rooms
- 217 rooms
- 598 rooms
- 1479+ rooms
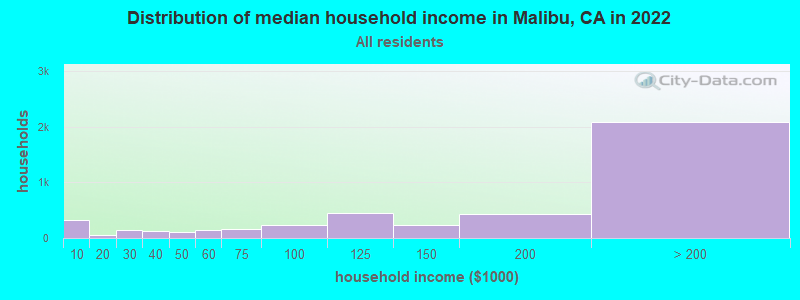
Malibu, CA household income distribution

- 316Less than $10,000
- 57$10,000 to $19,999
- 152$20,000 to $29,999
- 117$30,000 to $39,999
- 109$40,000 to $49,999
- 142$50,000 to $59,999
- 156$60,000 to $74,999
- 242$75,000 to $99,999
- 444$100,000 to $124,999
- 235$125,000 to $149,999
- 440$150,000 to $199,999
- 2,087$200,000 or more
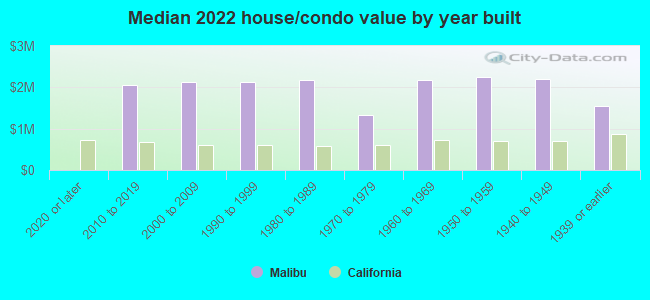
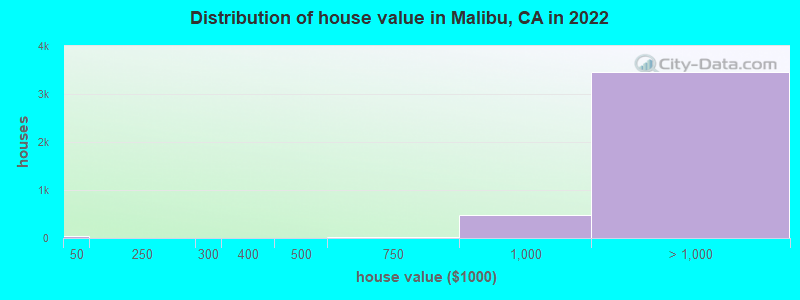
Home value of owner - occupied houses in 2022 in Malibu, CA
-
- 16Less than $10,000
- 10$10,000 to $14,999
- 7$30,000 to $34,999
- 6$250,000 to $299,999
- 7$400,000 to $499,999
- 14$500,000 to $749,999
- 476$750,000 to $999,999
- 481$1,000,000 to $1,499,999
- 360$1,500,000 to $1,999,999
- 2,606$2,000,000 or more
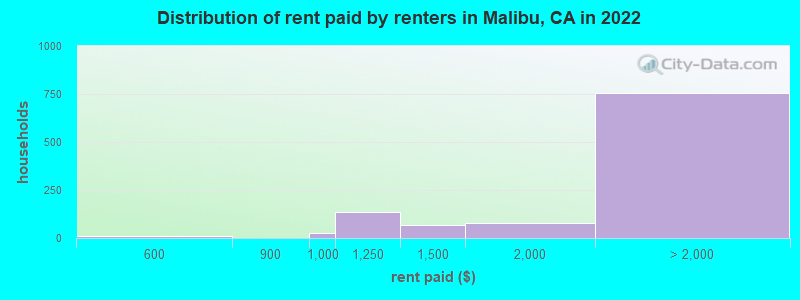
Rent paid by renters in 2022 in Malibu, CA
-
- 11$550 to $599
- 25$900 to $999
- 135$1,000 to $1,249
- 69$1,250 to $1,499
- 79$1,500 to $1,999
- 99$2,000 to $2,499
- 47$2,500 to $2,999
- 60$3,000 to $3,499
- 416$3,500 or more
- 130No cash rent
Percentage of workers working in this county: 94.7%
Number of people working at home: 2,116 (45.9% of all workers)
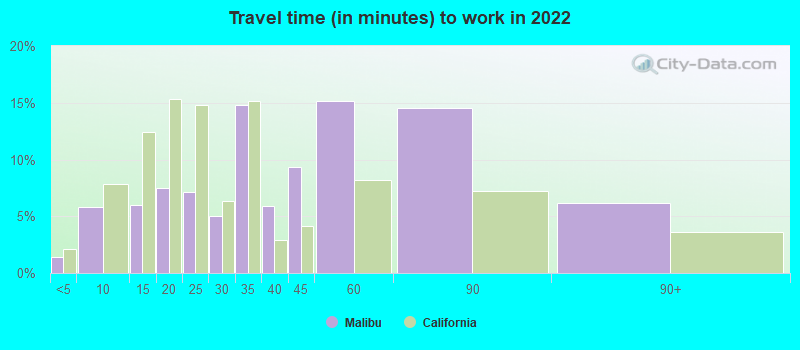
Travel time to work (commute)
- Less than 5 minutes: 27
- 5 to 9 minutes: 435
- 10 to 14 minutes: 282
- 15 to 19 minutes: 303
- 20 to 24 minutes: 148
- 25 to 29 minutes: 131
- 30 to 34 minutes: 335
- 35 to 39 minutes: 142
- 40 to 44 minutes: 133
- 45 to 59 minutes: 444
- 60 to 89 minutes: 308
- 90 or more minutes: 131
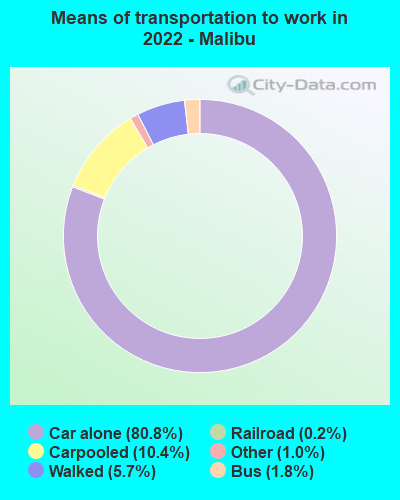
Means of transportation to work:
- Drove a car alone: 8,550 (66.8%)
- Carpooled: 1,218 (9.5%)
- Bus: 174 (1.4%)
- Light rail, streetcar or trolley: 14 (0.1%)
- Taxi: 119 (0.9%)
- Bicycle: 6 (0.0%)
- Walked: 649 (5.1%)
- Worked at home: 2,116 (16.5%)
- Unemployment by race in 2022
- Unemployment rate for White non-Hispanic residents
- 2.5%Males
- 5.3%Females
- Unemployment rate for Asian residents
- 5.6%Males
- Unemployment rate for two or more race residents
- 17.4%Females
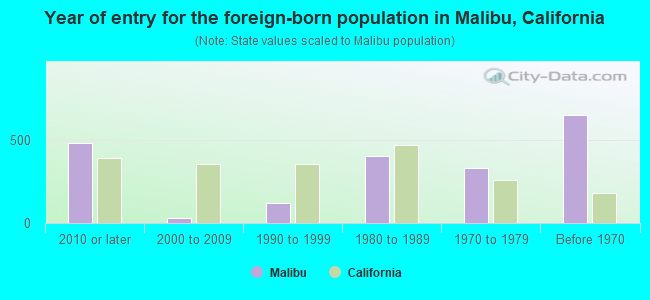
- Year of entry for the foreign-born population in Malibu, California
- 4822010 or later
- 282000 to 2009
- 1181990 to 1999
- 4031980 to 1989
- 3291970 to 1979
- 650Before 1970
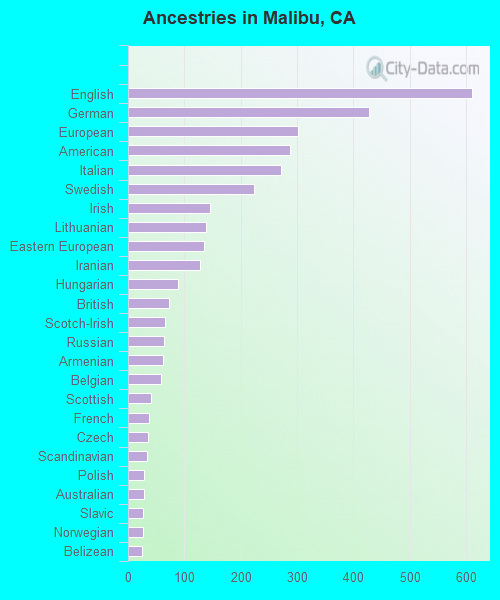
First ancestries reported:
- English: 610 (13.5%)
- German: 428 (9.5%)
- European: 301 (6.7%)
- American: 287 (6.4%)
- Italian: 272 (6.0%)
- Swedish: 223 (4.9%)
- Irish: 145 (3.2%)
- Lithuanian: 138 (3.1%)
- Eastern European: 135 (3.0%)
- Iranian: 128 (2.8%)
- Hungarian: 89 (2.0%)
- British: 73 (1.6%)
- Scotch-Irish: 66 (1.5%)
- Russian: 63 (1.4%)
- Armenian: 62 (1.4%)
- Belgian: 58 (1.3%)
- Scottish: 40 (0.9%)
- French: 37 (0.8%)
- Czech: 36 (0.8%)
- Scandinavian: 33 (0.7%)
- Polish: 29 (0.6%)
- Australian: 28 (0.6%)
- Slavic: 27 (0.6%)
- Norwegian: 26 (0.6%)
- Belizean: 25 (0.6%)
- Northern European: 23 (0.5%)
- South African: 19 (0.4%)
- Danish: 18 (0.4%)
- Portuguese: 18 (0.4%)
- Swiss: 16 (0.4%)
- Greek: 13 (0.3%)
- Dutch: 5 (0.1%)
- French Canadian: 5 (0.1%)
- Ukrainian: 5 (0.1%)
Most common places of birth for foreign-born residents (%):
| Malibu: | 15.2% (245) |
| California: | 2.0% (206,004) |
| Malibu: | 10.8% (175) |
| California: | 0.6% (60,582) |
| Malibu: | 7.1% (115) |
| California: | 37.2% (3,881,193) |
| Malibu: | 6.1% (99) |
| California: | 0.6% (57,953) |
| Malibu: | 5.3% (85) |
| California: | 0.2% (20,614) |
| Malibu: | 5.2% (84) |
| California: | 0.3% (33,960) |
| Malibu: | 4.6% (75) |
| California: | 0.1% (12,221) |
| Malibu: | 4.3% (70) |
| California: | 0.3% (31,439) |
| Malibu: | 3.6% (58) |
| California: | 0.4% (40,224) |
| Malibu: | 3.1% (50) |
| California: | 5.2% (539,184) |
| Malibu: | 3.0% (49) |
| California: | 6.6% (684,672) |
| Malibu: | 2.9% (46) |
| California: | 0.2% (23,338) |
| Malibu: | 2.3% (37) |
| California: | 0.7% (73,304) |
| Malibu: | 2.0% (32) |
| California: | 1.2% (127,477) |
| Malibu: | 1.9% (31) |
| California: | 3.0% (315,248) |
| Malibu: | 1.7% (28) |
| California: | 0.2% (25,462) |
| Malibu: | 1.7% (27) |
| California: | 0.5% (53,260) |
| Malibu: | 1.5% (25) |
| California: | 7.8% (818,297) |
Place of birth for U.S.-born residents:
- This state: 5,204
- Other state: 3,358
- Northeast: 1,203
- Midwest: 1,274
- South: 453
- West: 419
87.0% of Malibu residents lived in the same house 1 years ago.
Out of people who lived in different houses, 38.3% lived in this county.
Out of people who lived in different counties, 36.3% lived in California.
| Malibu: | 87.0% |
| State average: | 88.9% |
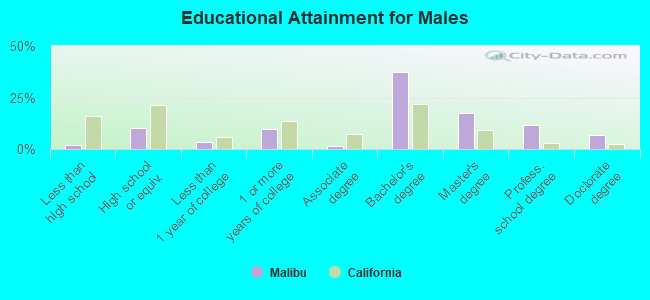
Education attainment for males 25 years and older:
- No schooling: 23
- Nursery to 4th grade: 2
- 5th and 6th grade: 9
- 7th and 8th grade: 0
- 9th grade: 0
- 10th grade: 0
- 11th grade: 0
- 12th grade, no diploma: 35
- High school graduate (or equivalency): 405
- Less than 1 year of college: 144
- Some college more than 1 year, no degree: 386
- Associate degree: 57
- Bachelor's degree: 1,481
- Master's degree: 696
- Professional school degree: 455
- Doctorate degree: 260
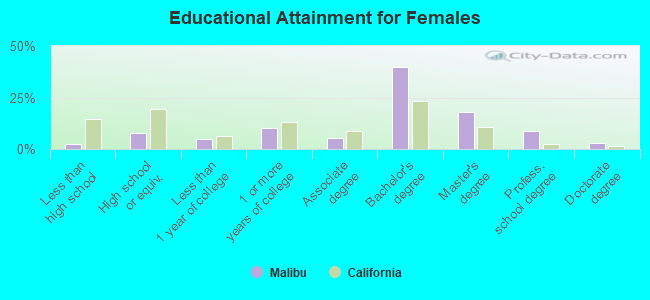
Education attainment for females 25 years and older:
- No schooling: 29
- Nursery to 4th grade: 6
- 5th and 6th grade: 0
- 7th and 8th grade: 0
- 9th grade: 0
- 10th grade: 6
- 11th grade: 0
- 12th grade, no diploma: 66
- High school graduate (or equivalency): 312
- Less than 1 year of college: 208
- Some college more than 1 year, no degree: 418
- Associate degree: 214
- Bachelor's degree: 1,657
- Master's degree: 740
- Professional school degree: 365
- Doctorate degree: 125


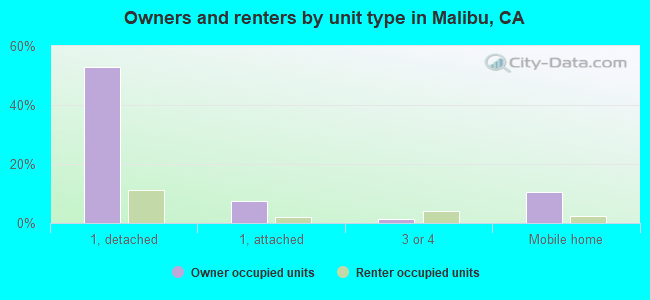
Housing units in structures:
- One, detached: 4,398
- One, attached: 410
- Two: 74
- 3 or 4: 281
- 5 to 9: 123
- 10 to 19: 160
- 20 to 49: 203
- 50 or more: 296
- Mobile homes: 864
Median worth of mobile homes: $1,290,563
Housing units lacking complete kitchen facilities in 2022: 1.8%
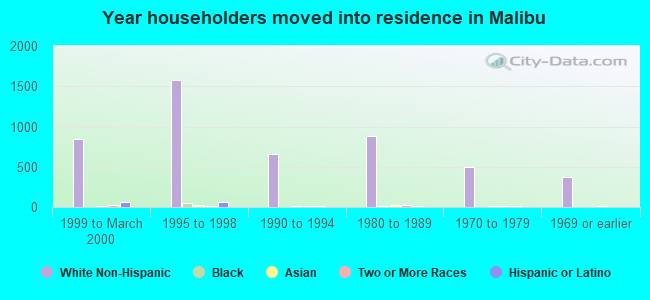
House/condo owner moved in on average 14 years ago
Renter moved in on average 3 years ago
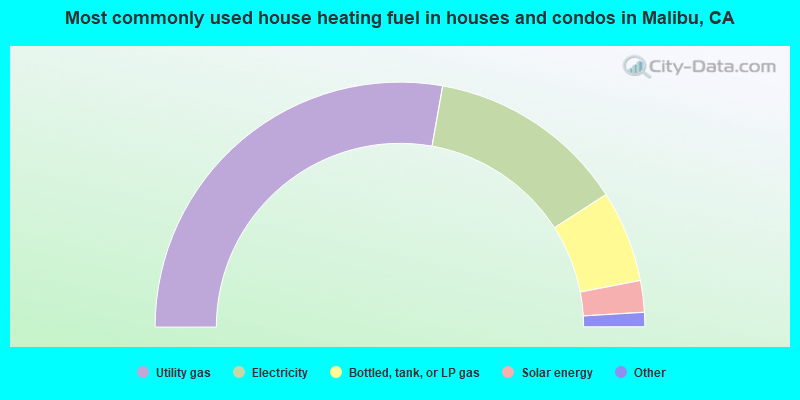
- 55.7%Utility gas
- 26.3%Electricity
- 12.1%Bottled, tank, or LP gas
- 4.2%Solar energy
- 1.5%No fuel used
- 0.3%Other fuel
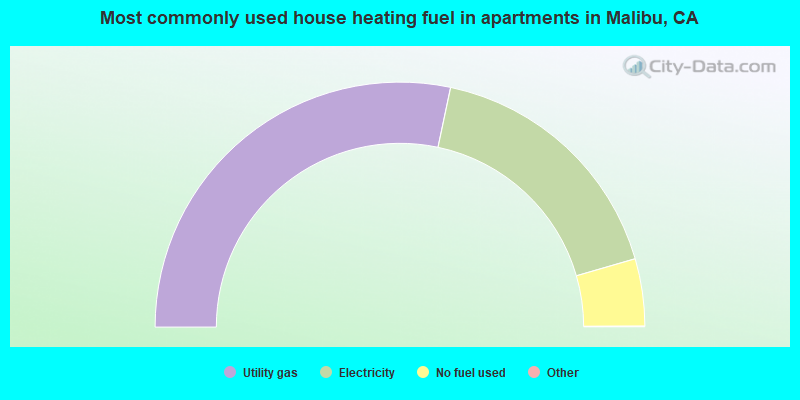
- 56.7%Utility gas
- 34.4%Electricity
- 8.9%No fuel used
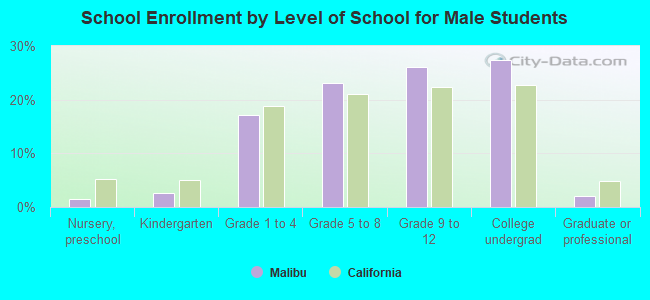
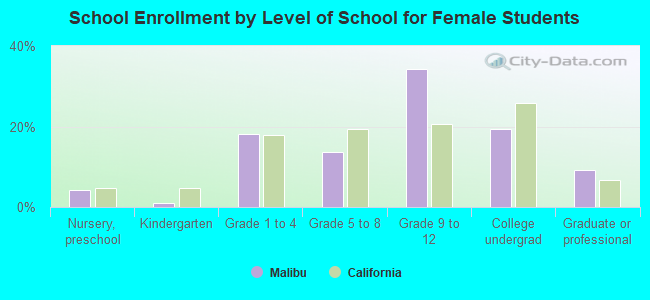
Private vs. public school enrollment:
| Here: | 50.3% |
| California: | 10.5% |
| Here: | 46.7% |
| California: | 8.5% |
| Here: | 35.3% |
| California: | 15.9% |