Malmstrom AFB, MT (Montana) Houses and Residents
| Malmstrom AFB: | |
| Montana: |
Total population: 3,472 (All urban)
Houses: 1,239 (1,172 occupied: 17 owner occupied, 1,170 renter occupied)
| % of renters here: | 99% |
| State: | 31% |
Housing density: 240 houses/condos per square mile
Median price asked for vacant for-sale houses and condos in 2022 in this county: $173,033.
Median contract rent in 2022: $1,112 (lower quartile is $1,015, upper quartile is $1,341)
Median rent asked for vacant for-rent units in 2022: $1,272
Median gross rent in Malmstrom AFB, MT in 2022: $1,131
Housing units in Malmstrom AFB with a mortgage: 0 (0 second mortgage, 0 home equity loan, 0 both second mortgage and home equity loan)
Houses without a mortgage: 0
Compare current foreclosures near Malmstrom AFB, MT:
| Photo | Address | Area | Beds / Baths | Price | Details |
|---|---|---|---|---|---|

|
#1
25th St SW
Great Falls, MT 59404
|
1,910 sq. feet
|
2 baths 2 beds |
$99,000
|
show details |

|
#2
W Ulm Rd
Ulm, MT 59485
|
1,440 sq. feet
|
2 baths 5 beds |
show details | |

|
#3
15th Ave S
Great Falls, MT 59405
|
1,203 sq. feet
|
2 baths 5 beds |
show details | |

|
#4
4th Ave SW
Great Falls, MT 59404
|
480 sq. feet
|
1 baths 1 beds |
show details | |

|
#5
1st Ave N
Great Falls, MT 59401
|
773 sq. feet
|
1 baths 1 beds |
show details | |

|
#6
5th Ave SW
Great Falls, MT 59404
|
1,164 sq. feet
|
1 baths 2 beds |
show details | |

|
#7
4th Ave N
Great Falls, MT 59401
|
1,066 sq. feet
|
1 baths 3 beds |
show details | |

|
#8
2nd Ave N
Great Falls, MT 59401
|
1,271 sq. feet
|
2 baths 4 beds |
show details | |

|
#9
Banjo Hill Ln
Great Falls, MT 59404
|
924 sq. feet
|
1 baths 3 beds |
show details | |

|
#10
Central Ave W
Great Falls, MT 59404
|
2,217 sq. feet
|
2 baths 5 beds |
show details |
| Photo | Address | Area | Beds / Baths | Price | Details |
|---|---|---|---|---|---|

|
#11
Serenity Ln
Great Falls, MT 59404
|
1,680 sq. feet
|
2 baths 2 beds |
show details | |

|
#12
51st St S
Great Falls, MT 59405
|
1,120 sq. feet
|
1 baths 3 beds |
show details | |

|
#13
2nd Ave SW
Great Falls, MT 59404
|
1,151 sq. feet
|
1 baths 2 beds |
show details | |

|
#14
Washington Blvd
Great Falls, MT 59404
|
1,764 sq. feet
|
1 baths 4 beds |
show details | |

|
#15
19th Ave NW
Great Falls, MT 59404
|
1,662 sq. feet
|
2 baths 3 beds |
show details | |

|
#16
Lamplighter Ln
Great Falls, MT 59405
|
1,538 sq. feet
|
2 baths 2 beds |
show details | |

|
#17
E Highwood Rd
Belt, MT 59412
|
2,080 sq. feet
|
2 baths 3 beds |
show details | |

|
#18
14th Ave S
Great Falls, MT 59405
|
1,512 sq. feet
|
2 baths 3 beds |
show details | |

|
#19
7th St Ne, Trlr 74
Great Falls, MT 59404
|
1,547 sq. feet
|
2 baths 4 beds |
show details | |

|
#20
7th St Ne, Trlr 132
Great Falls, MT 59404
|
1,620 sq. feet
|
2 baths 3 beds |
show details |
| Photo | Address | Area | Beds / Baths | Price | Details |
|---|---|---|---|---|---|

|
#21
6th Ave N
Great Falls, MT 59401
|
1,529 sq. feet
|
2 baths 3 beds |
show details | |

|
#22
3rd Ave S
Great Falls, MT 59405
|
1,300 sq. feet
|
2 baths 2 beds |
show details | |

|
#23
2nd Ave S
Great Falls, MT 59405
|
2,828 sq. feet
|
1 baths 3 beds |
show details | |

|
#24
1st Ave S
Great Falls, MT 59401
|
1,375 sq. feet
|
2 baths 3 beds |
show details | |

|
#25
50th St S
Great Falls, MT 59405
|
1,916 sq. feet
|
2 baths 3 beds |
show details | |

|
#26
5th Ave N
Great Falls, MT 59401
|
1,470 sq. feet
|
2 baths 2 beds |
show details | |

|
#27
2nd Ave S
Great Falls, MT 59405
|
1,032 sq. feet
|
2 baths 3 beds |
show details | |

|
#28
8th Ave N
Great Falls, MT 59401
|
1,208 sq. feet
|
1 baths 3 beds |
show details | |

|
#29
5th Ave S
Great Falls, MT 59405
|
1,788 sq. feet
|
2 baths 3 beds |
show details | |

|
#30
7th Ave S
Great Falls, MT 59405
|
1,264 sq. feet
|
1 baths 3 beds |
show details |
| Photo | Address | Area | Beds / Baths | Price | Details |
|---|---|---|---|---|---|

|
#31
Ella Ave
Great Falls, MT 59405
|
- sq. feet
|
4 baths 8 beds |
show details | |

|
#32
2nd Ave N, Apt 203
Great Falls, MT 59405
|
- sq. feet
|
- baths - beds |
show details | |

|
#33
Windsor Ln
Great Falls, MT 59404
|
- sq. feet
|
- baths - beds |
show details | |

|
#34
Ella Ave
Great Falls, MT 59405
|
- sq. feet
|
8 baths - beds |
show details | |

|
#35
4th Ave N Apt 15
Great Falls, MT 59405
|
- sq. feet
|
- baths - beds |
show details | |

|
#36
9th Ave S
Great Falls, MT 59405
|
- sq. feet
|
- baths - beds |
show details | |

|
#37
6th St S Apt 1
Great Falls, MT 59405
|
- sq. feet
|
- baths - beds |
show details | |

|
#38
Avenue D NW
Great Falls, MT 59404
|
- sq. feet
|
- baths - beds |
show details | |

|
#39
Division Rd, Apt 108
Great Falls, MT 59404
|
- sq. feet
|
- baths - beds |
show details | |

|
#40
2nd Ave S
Great Falls, MT 59405
|
- sq. feet
|
- baths - beds |
show details |
| Photo | Address | Area | Beds / Baths | Price | Details |
|---|---|---|---|---|---|

|
#41
Poplar Dr
Great Falls, MT 59404
|
- sq. feet
|
- baths - beds |
show details | |

|
#42
Truman Ave
Great Falls, MT 59404
|
- sq. feet
|
- baths - beds |
show details | |

|
#43
Skyline Ct
Great Falls, MT 59404
|
- sq. feet
|
- baths - beds |
show details | |

|
Check over 1 million property listings on Foreclosure.com!
|
browse all offers | |||


 | Current info on Great Falls (10 replies) |
| Any Help Apreciated - seek relocation advice near a VA medical facility (24 replies) |
| Need informations about Montana for a novel ! (23 replies) |
| Moving to Great Falls - Malmstrom AFB (26 replies) |
| What's Wrong With Great Falls? (28 replies) |
| What are the three biggest problems with Montana??? (238 replies) |

Household type by relationship:
Households: 4,303- Male householders: 764 (15 living alone), Female householders: 403 (33 living alone)
1,020 spouses (999 opposite-sex spouses), 15 unmarried partners, (15 opposite-sex unmarried partners), 1,439 children (1,340 natural, 0 adopted, 98 stepchildren), 0 grandchildren, 22 brothers or sisters, 21 parents, 0 foster children, 0 other relatives, 0 non-relatives
- In group quarters: 617
Size of family households: 389 2-persons, 242 3-persons, 256 4-persons, 139 5-persons, 54 6-persons, 5 7-or-more-persons.
Size of nonfamily households: 52 1-person, 16 2-persons.
1,237 married couples with children.
68 single-parent households (27 men, 41 women).
90.2% of residents of Malmstrom AFB speak English at home.
4.8% of residents speak Spanish at home (85% speak English very well, 15% speak English well).
2.9% of residents speak other Indo-European language at home (94% speak English very well, 6% speak English well).
1.2% of residents speak Asian or Pacific Island language at home (50% speak English very well, 50% speak English well).
0.2% of residents speak other language at home (100% speak English very well).
Foreign born population: 84 (2.0%)
(69.0% of them are naturalized citizens)
| Here: | -666666666.0 |
| State: | 6.4 |
| Here: | 6.6 |
| State: | 4.2 |

- Bedrooms in owner-occupied houses and condos in Malmstrom AFB, Montana
- 0no bedroom
- 171 bedroom
- 02 bedrooms
- 03 bedrooms
- 04 bedrooms
- 05+ bedrooms

- Bedrooms in renter-occupied apartments in Malmstrom AFB, Montana
- 4no bedroom
- 171 bedroom
- 2312 bedrooms
- 4713 bedrooms
- 4234 bedrooms
- 245+ bedrooms

- Cars and other vehicles available in Malmstrom AFB in owner-occupied houses/condos
- 0no vehicle
- 01 vehicle
- 02 vehicles
- 173 vehicles
- 04 vehicles
- 05+ vehicles

- Cars and other vehicles available in Malmstrom AFB in renter-occupied apartments
- 32no vehicle
- 2531 vehicle
- 7472 vehicles
- 1383 vehicles
- 04 vehicles
- 05+ vehicles

- Rooms in owner-occupied houses in Malmstrom AFB, Montana
- 01 room
- 02 rooms
- 173 rooms
- 04 rooms
- 05 rooms
- 06 rooms
- 07 rooms
- 08 rooms
- 09+ rooms

- Rooms in renter-occupied apartments in Malmstrom AFB, Montana
- 01 room
- 172 rooms
- 213 rooms
- 544 rooms
- 1405 rooms
- 3336 rooms
- 3337 rooms
- 1868 rooms
- 859+ rooms

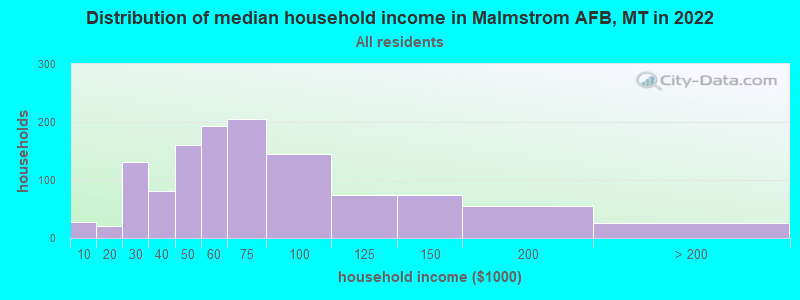
Malmstrom AFB, MT household income distribution

- 28Less than $10,000
- 20$10,000 to $19,999
- 131$20,000 to $29,999
- 81$30,000 to $39,999
- 161$40,000 to $49,999
- 193$50,000 to $59,999
- 205$60,000 to $74,999
- 145$75,000 to $99,999
- 74$100,000 to $124,999
- 75$125,000 to $149,999
- 56$150,000 to $199,999
- 26$200,000 or more
Rent paid by renters in 2022 in Malmstrom AFB, MT
-
- 12$200 to $249
- 29$400 to $449
- 7$700 to $749
- 38$800 to $899
- 78$900 to $999
- 507$1,000 to $1,249
- 204$1,250 to $1,499
- 179$1,500 to $1,999
- 21$2,000 to $2,499
- 85No cash rent


Percentage of workers working in this county: 100.0%
Number of people working at home: 120 (4.8% of all workers)
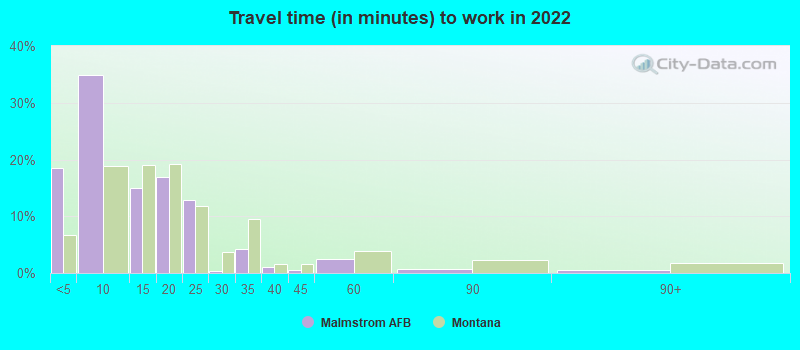
Travel time to work (commute)
- Less than 5 minutes: 548
- 5 to 9 minutes: 1,112
- 10 to 14 minutes: 226
- 15 to 19 minutes: 237
- 20 to 24 minutes: 59
- 25 to 29 minutes: 3
- 30 to 34 minutes: 14
- 35 to 39 minutes: 18
- 40 to 44 minutes: 0
- 45 to 59 minutes: 144
- 60 to 89 minutes: 153
- 90 or more minutes: 70
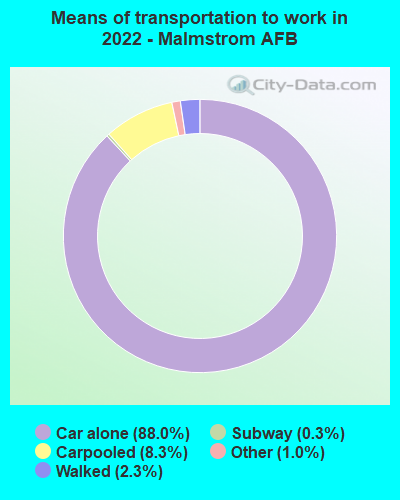
Means of transportation to work:
- Drove a car alone: 2,311 (81.0%)
- Carpooled: 258 (9.0%)
- Bus: 1 (0.0%)
- Long-distance train or commuter rail: 7 (0.2%)
- Taxi: 34 (1.2%)
- Walked: 66 (2.3%)
- Worked at home: 120 (4.2%)

- Unemployment by race in 2022
- Unemployment rate for White non-Hispanic residents
- 7.6%Males
- 2.8%Females
- Unemployment rate for other race residents
- 4.9%Females
- Unemployment rate for Hispanic or Latino residents
- 1.9%Females

- Year of entry for the foreign-born population in Malmstrom AFB, Montana
- 482010 or later
- 262000 to 2009
- 121990 to 1999
- 551980 to 1989
- 111970 to 1979
- 9Before 1970

First ancestries reported:
- American: 596 (25.7%)
- German: 299 (12.9%)
- Irish: 202 (8.7%)
- English: 79 (3.4%)
- Italian: 75 (3.2%)
- Scottish: 50 (2.2%)
- European: 42 (1.8%)
- Polish: 31 (1.3%)
- Norwegian: 21 (0.9%)
- French: 18 (0.8%)
- Scandinavian: 15 (0.6%)
- Dutch: 12 (0.5%)
- Czech: 8 (0.3%)
- Welsh: 8 (0.3%)
- Romanian: 7 (0.3%)
- Hungarian: 5 (0.2%)
- Northern European: 5 (0.2%)
- British: 3 (0.1%)
Most common places of birth for foreign-born residents (%):
| Malmstrom AFB: | 40.0% (42) |
| Montana: | 7.0% (1,735) |
| Malmstrom AFB: | 17.1% (18) |
| Montana: | 1.6% (385) |
| Malmstrom AFB: | 14.3% (15) |
| Montana: | 2.7% (666) |
| Malmstrom AFB: | 12.4% (13) |
| Montana: | 9.3% (2,310) |
| Malmstrom AFB: | 5.7% (6) |
| Montana: | 1.5% (368) |
| Malmstrom AFB: | 3.8% (4) |
| Montana: | 3.0% (738) |
Place of birth for U.S.-born residents:
- This state: 699
- Other state: 3,122
- Northeast: 207
- Midwest: 658
- South: 1,342
- West: 1,017
73.1% of Malmstrom AFB residents lived in the same house 1 years ago.
Out of people who lived in different houses, 14.1% lived in this county.
Out of people who lived in different counties, 25.0% lived in Montana.
| Malmstrom AFB: | 73.1% |
| State average: | 86.7% |
Education attainment for males 25 years and older:
- No schooling: 0
- Nursery to 4th grade: 0
- 5th and 6th grade: 0
- 7th and 8th grade: 24
- 9th grade: 0
- 10th grade: 0
- 11th grade: 0
- 12th grade, no diploma: 0
- High school graduate (or equivalency): 90
- Less than 1 year of college: 73
- Some college more than 1 year, no degree: 166
- Associate degree: 147
- Bachelor's degree: 211
- Master's degree: 64
- Professional school degree: 14
- Doctorate degree: 0

Education attainment for females 25 years and older:
- No schooling: 0
- Nursery to 4th grade: 0
- 5th and 6th grade: 0
- 7th and 8th grade: 0
- 9th grade: 0
- 10th grade: 0
- 11th grade: 0
- 12th grade, no diploma: 5
- High school graduate (or equivalency): 121
- Less than 1 year of college: 68
- Some college more than 1 year, no degree: 161
- Associate degree: 127
- Bachelor's degree: 187
- Master's degree: 177
- Professional school degree: 8
- Doctorate degree: 17


Housing units in structures:
- One, detached: 252
- One, attached: 850
- Two: 97
- 3 or 4: 8
- 20 to 49: 10
- 50 or more: 11
- Mobile homes: 9
Housing units lacking complete kitchen facilities in 2022: 0.9%

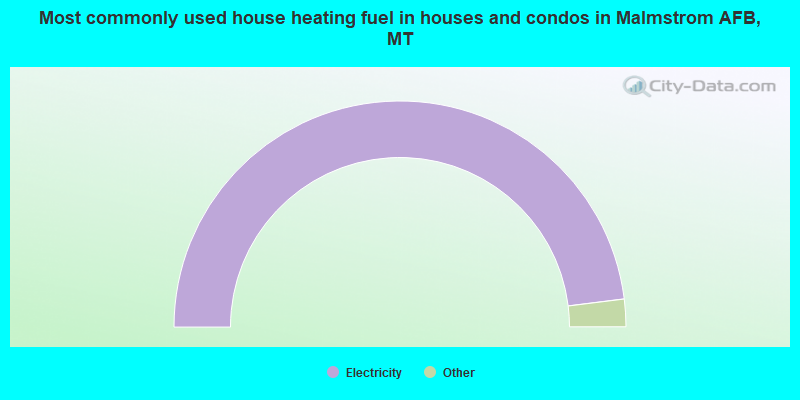
- 100.0%Electricity
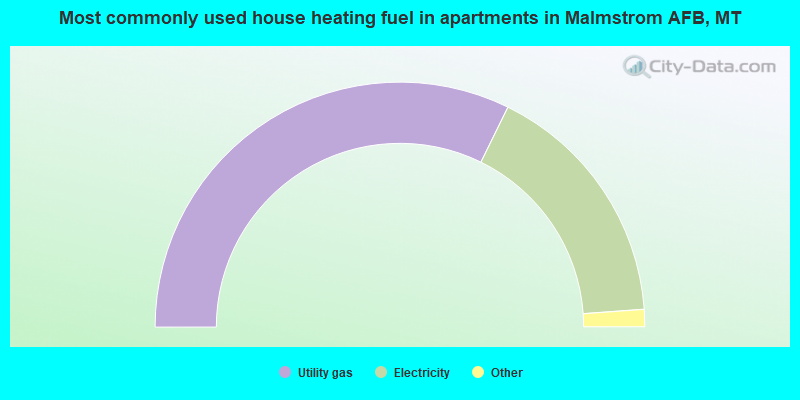
- 64.6%Utility gas
- 33.2%Electricity
- 1.4%Bottled, tank, or LP gas
- 0.8%Wood
Private vs. public school enrollment:
| Here: | 15.0% |
| Montana: | 15.3% |
| Here: | 17.3% |
| Montana: | 12.2% |
| Here: | 10.3% |
| Montana: | 15.0% |


