Malta, NY (New York) Houses and Residents
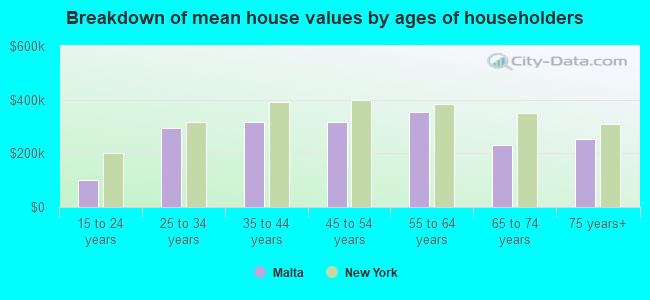
| Malta: | $347,863 |
| New York: | $400,400 |
Total population: 14,765 (Urban population: 8,779, Rural population: 4,226 (53 farm, 4,173 nonfarm))
Houses: 5,754 (5,295 occupied: 3,538 owner occupied, 1,757 renter occupied)
| % of renters here: | 33% |
| State: | 46% |
Housing density: 205 houses/condos per square mile
Median price asked for vacant for-sale houses and condos in 2022 in this county: $318,652.
Median contract rent in 2022: $1,212 (lower quartile is $1,095, upper quartile is $1,458)
Median rent asked for vacant for-rent units in 2022: $1,112
Median gross rent in Malta, NY in 2022: $1,321
Housing units in Malta with a mortgage: 2,340 (111 second mortgage, 289 home equity loan, 0 both second mortgage and home equity loan)
Houses without a mortgage: 413
Compare current foreclosures near Malta, NY:
| Photo | Address | Area | Beds / Baths | Price | Details |
|---|---|---|---|---|---|

|
#1
River St
Troy, NY 12180
|
2,112 sq. feet
|
2 baths 6 beds |
$33,250
|
show details |

|
#2
Fiero Ave
Schenectady, NY 12303
|
1,598 sq. feet
|
2 baths 3 beds |
show details | |

|
#3
Stone Church Rd
Ballston Spa, NY 12020
|
- sq. feet
|
2 baths 4 beds |
show details | |

|
#4
Conqua Ln
Schenectady, NY 12306
|
1,760 sq. feet
|
2 baths 3 beds |
show details | |

|
#5
New Turnpike Rd
Troy, NY 12182
|
981 sq. feet
|
1 baths 3 beds |
show details | |

|
#6
Willett St
Schenectady, NY 12303
|
1,944 sq. feet
|
2 baths 4 beds |
show details | |

|
#7
Mann Avenue & 12 Elm Street
Cohoes, NY 12047
|
1,864 sq. feet
|
2 baths 4 beds |
show details | |

|
#8
Vliet Blvd
Cohoes, NY 12047
|
2,550 sq. feet
|
2 baths 6 beds |
show details | |

|
#9
Ray Ave
Schenectady, NY 12304
|
1,780 sq. feet
|
2 baths 3 beds |
show details | |

|
#10
11th St
Troy, NY 12180
|
1,850 sq. feet
|
2 baths 3 beds |
show details |
| Photo | Address | Area | Beds / Baths | Price | Details |
|---|---|---|---|---|---|

|
#11
Hudson St
Waterford, NY 12188
|
1,764 sq. feet
|
2 baths 4 beds |
show details | |

|
#12
Lawrence St
Waterford, NY 12188
|
2,200 sq. feet
|
1 baths 2 beds |
show details | |

|
#13
Midway Dr
Albany, NY 12205
|
1,296 sq. feet
|
1 baths 3 beds |
show details | |

|
#14
Parker Rd
Schenectady, NY 12304
|
1,645 sq. feet
|
1 baths 3 beds |
show details | |

|
#15
Redfield Park
Clifton Park, NY 12065
|
2,573 sq. feet
|
2 baths 4 beds |
show details | |

|
#16
Nys Rt 29
Middle Grove, NY 12850
|
962 sq. feet
|
1 baths 3 beds |
show details | |

|
#17
Lincoln Ave
Cohoes, NY 12047
|
2,200 sq. feet
|
2 baths 4 beds |
show details | |

|
#18
Kirby Rd
Saratoga Springs, NY 12866
|
1,280 sq. feet
|
1 baths 2 beds |
show details | |

|
#19
4th Ave
Troy, NY 12182
|
872 sq. feet
|
1 baths 3 beds |
show details | |

|
#20
Generals Way
Clifton Park, NY 12065
|
1,080 sq. feet
|
1 baths 2 beds |
show details |
| Photo | Address | Area | Beds / Baths | Price | Details |
|---|---|---|---|---|---|

|
#21
Generals Way
Clifton Park, NY 12065
|
1,059 sq. feet
|
1 baths 2 beds |
show details | |

|
#22
Outer Dr
Schenectady, NY 12303
|
1,404 sq. feet
|
1 baths 3 beds |
show details | |

|
#23
Sacandaga Rd
Schenectady, NY 12302
|
1,272 sq. feet
|
1 baths 3 beds |
show details | |

|
#24
Fuller Ter
Albany, NY 12205
|
775 sq. feet
|
2 baths 2 beds |
show details | |

|
#25
George St
Troy, NY 12183
|
2,200 sq. feet
|
2 baths 6 beds |
show details | |

|
#26
Traver Rd
Gansevoort, NY 12831
|
1,776 sq. feet
|
2 baths 5 beds |
show details | |

|
#27
Chester Ct
Troy, NY 12182
|
2,974 sq. feet
|
1 baths 4 beds |
show details | |

|
#28
Route 29
Saratoga Springs, NY 12866
|
1,560 sq. feet
|
1 baths 3 beds |
show details | |

|
#29
Front St
Schenectady, NY 12305
|
2,418 sq. feet
|
2 baths 4 beds |
show details | |

|
#30
6th St
Schenectady, NY 12302
|
1,689 sq. feet
|
1 baths 4 beds |
show details |
| Photo | Address | Area | Beds / Baths | Price | Details |
|---|---|---|---|---|---|

|
#31
Carlton St
Schenectady, NY 12306
|
1,252 sq. feet
|
1 baths 3 beds |
show details | |

|
#32
Marion Blvd
Schenectady, NY 12302
|
1,672 sq. feet
|
1 baths 4 beds |
show details | |

|
#33
Skyline Dr
Melrose, NY 12121
|
1,120 sq. feet
|
1 baths 3 beds |
show details | |

|
#34
May Ave
Schenectady, NY 12303
|
1,596 sq. feet
|
1 baths 2 beds |
show details | |

|
#35
Brundige Rd
Valley Falls, NY 12185
|
1,568 sq. feet
|
2 baths 3 beds |
show details | |

|
#36
Bell Rd
Valley Falls, NY 12185
|
2,238 sq. feet
|
2 baths 4 beds |
show details | |

|
#37
Bedford Rd
Schenectady, NY 12308
|
2,520 sq. feet
|
2 baths 4 beds |
show details | |

|
#38
Dutch Meadows Dr
Cohoes, NY 12047
|
2,980 sq. feet
|
2 baths 4 beds |
show details | |

|
#39
Garner Ave
Schenectady, NY 12309
|
1,200 sq. feet
|
1 baths 3 beds |
show details | |

|
#40
Vley Rd
Schenectady, NY 12302
|
1,381 sq. feet
|
1 baths 3 beds |
show details |
| Photo | Address | Area | Beds / Baths | Price | Details |
|---|---|---|---|---|---|

|
#41
Oxford Pl
Schenectady, NY 12308
|
1,680 sq. feet
|
1 baths 4 beds |
show details | |

|
#42
Garner Ave
Schenectady, NY 12309
|
1,790 sq. feet
|
1 baths 3 beds |
show details | |

|
#43
Chesebro Dr
Schenectady, NY 12309
|
1,656 sq. feet
|
1 baths 4 beds |
show details | |

|
#44
Palmer Ave
Schenectady, NY 12309
|
1,566 sq. feet
|
2 baths 3 beds |
show details | |

|
#45
Lincoln Ave
Cohoes, NY 12047
|
1,560 sq. feet
|
1 baths 5 beds |
show details | |

|
#46
Manchester Rd
Schenectady, NY 12304
|
875 sq. feet
|
1 baths 3 beds |
show details | |

|
#47
Rosemary Dr
Schenectady, NY 12304
|
1,752 sq. feet
|
2 baths 4 beds |
show details | |

|
#48
N 2nd St
Cohoes, NY 12047
|
960 sq. feet
|
1 baths 3 beds |
show details | |

|
#49
Troy Schenectady Rd
Schenectady, NY 12309
|
1,810 sq. feet
|
1 baths 3 beds |
show details | |

|
Check over 1 million property listings on Foreclosure.com!
|
browse all offers | |||
Latest news about housing in Malta, NY collected exclusively by city-data.com from local newspapers, TV, and radio stations

 | Saratoga Springs apartment rentals (7 replies) |
| Need Suggestions on Apartment Renting in Malta/Saratoga Springs Area (9 replies) |
| New House - hard time finding (20 replies) |
| New Condos on Rte 9 in Malta (1 reply) |
| Why don't Homes in upscale areas sell? (34 replies) |
| How is Saratoga Springs? (177 replies) |

Household type by relationship:
Households: 215,657- In family households: 178,426 (42,743 male householders, 16,071 female householders)
47,054 spouses, 61,098 children (57,248 natural, 1,431 adopted, 2,419 stepchildren), 2,569 grandchildren, 1,096 brothers or sisters, 1,340 parents, foster children, 1,112 other relatives, 4,333 non-relatives
- In nonfamily households: 37,231 (13,720 male householders (10,074 living alone)), 15,762 female householders (12,976 living alone)), 7,749 nonrelatives
- In group quarters: 3,950 (1,524 institutionalized population)
37,723 married couples with children.
9,524 single-parent households (2,512 men, 7,012 women).
94.6% of residents of Malta speak English at home.
0.8% of residents speak Spanish at home (62% speak English very well, 11% speak English well, 27% speak English not well).
3.6% of residents speak other Indo-European language at home (81% speak English very well, 16% speak English well, 3% speak English not well).
0.6% of residents speak Asian or Pacific Island language at home (40% speak English very well, 60% speak English well).
0.4% of residents speak other language at home (69% speak English very well, 31% speak English well).
Foreign born population: 776 (5.0%)
(44.6% of them are naturalized citizens)
| Here: | 7.1 |
| State: | 6.3 |
| Here: | 4.1 |
| State: | 3.8 |
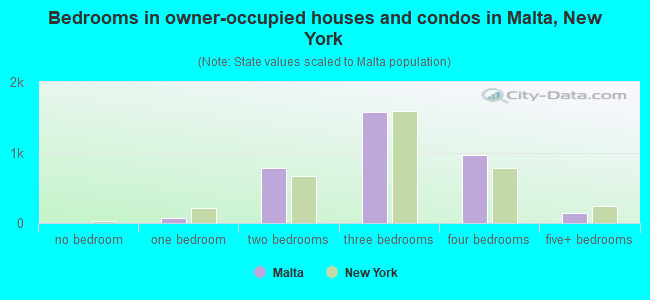
- Bedrooms in owner-occupied houses and condos in Malta, New York
- 0no bedroom
- 771 bedroom
- 7772 bedrooms
- 1,5803 bedrooms
- 9594 bedrooms
- 1455+ bedrooms
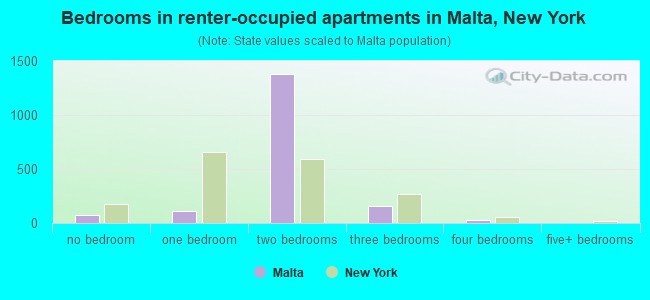
- Bedrooms in renter-occupied apartments in Malta, New York
- 78no bedroom
- 1151 bedroom
- 1,3782 bedrooms
- 1563 bedrooms
- 304 bedrooms
- 05+ bedrooms
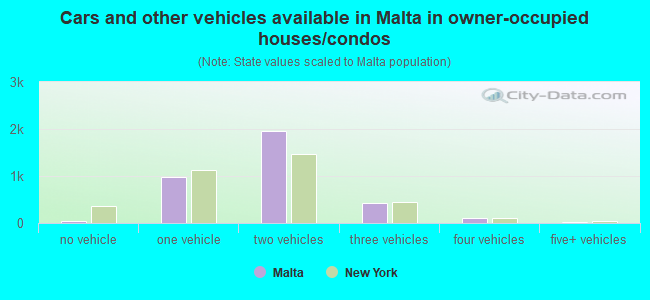
- Cars and other vehicles available in Malta in owner-occupied houses/condos
- 33no vehicle
- 9761 vehicle
- 1,9572 vehicles
- 4323 vehicles
- 1144 vehicles
- 265+ vehicles
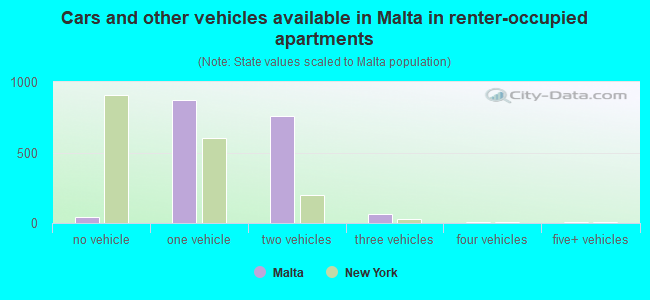
- Cars and other vehicles available in Malta in renter-occupied apartments
- 46no vehicle
- 8691 vehicle
- 7602 vehicles
- 653 vehicles
- 74 vehicles
- 105+ vehicles
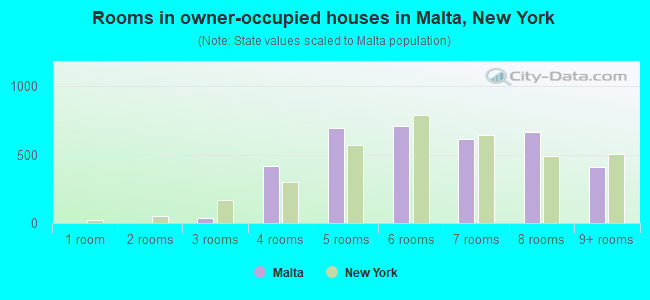
- Rooms in owner-occupied houses in Malta, New York
- 01 room
- 02 rooms
- 333 rooms
- 4164 rooms
- 6935 rooms
- 7086 rooms
- 6127 rooms
- 6688 rooms
- 4089+ rooms
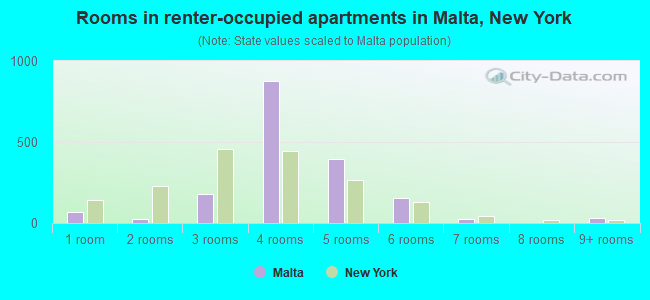
- Rooms in renter-occupied apartments in Malta, New York
- 651 room
- 252 rooms
- 1773 rooms
- 8794 rooms
- 3935 rooms
- 1556 rooms
- 277 rooms
- 38 rooms
- 339+ rooms
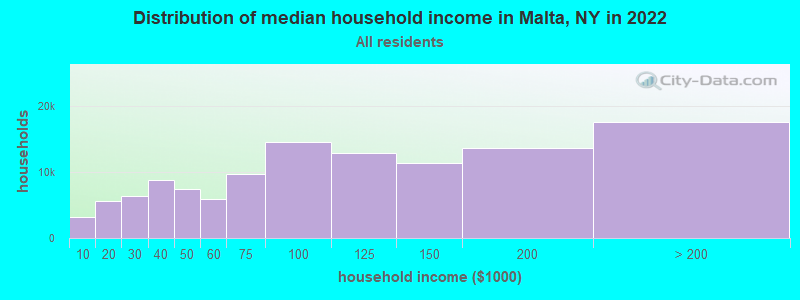
Malta, NY household income distribution

- 3,191Less than $10,000
- 5,589$10,000 to $19,999
- 6,407$20,000 to $29,999
- 8,742$30,000 to $39,999
- 7,403$40,000 to $49,999
- 5,878$50,000 to $59,999
- 9,734$60,000 to $74,999
- 14,566$75,000 to $99,999
- 12,855$100,000 to $124,999
- 11,394$125,000 to $149,999
- 13,542$150,000 to $199,999
- 17,535$200,000 or more
Percentage of workers working in this county: 60.4%
Number of people working at home: 1,562 (16.9% of all workers)
Travel time to work (commute)
- Less than 5 minutes: 247
- 5 to 9 minutes: 524
- 10 to 14 minutes: 862
- 15 to 19 minutes: 830
- 20 to 24 minutes: 901
- 25 to 29 minutes: 655
- 30 to 34 minutes: 1,420
- 35 to 39 minutes: 446
- 40 to 44 minutes: 477
- 45 to 59 minutes: 433
- 60 to 89 minutes: 243
- 90 or more minutes: 195
Means of transportation to work:
- Drove a car alone: 6,403 (85.8%)
- Carpooled: 700 (9.4%)
- Bus or trolley bus: 73 (1.0%)
- Walked: 35 (0.5%)
- Other means: 22 (0.3%)
- Worked at home: 231 (3.1%)
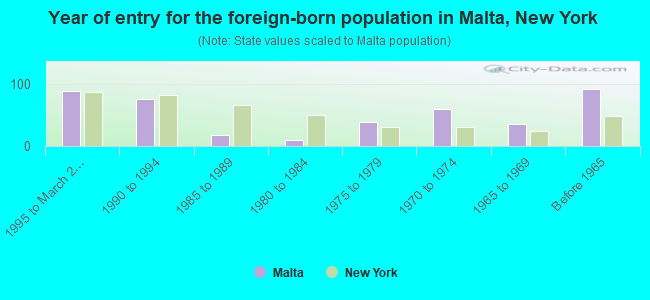
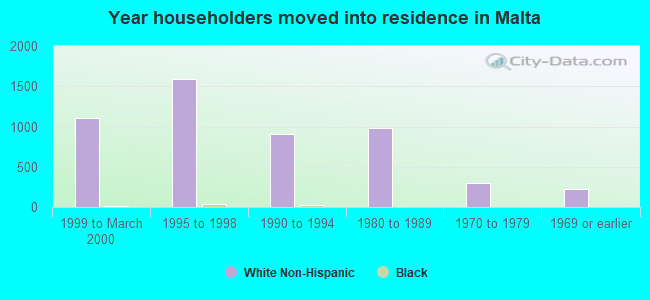
- Year of entry for the foreign-born population in Malta, New York
- 891995 to March 2000
- 761990 to 1994
- 181985 to 1989
- 91980 to 1984
- 391975 to 1979
- 591970 to 1974
- 361965 to 1969
- 91Before 1965
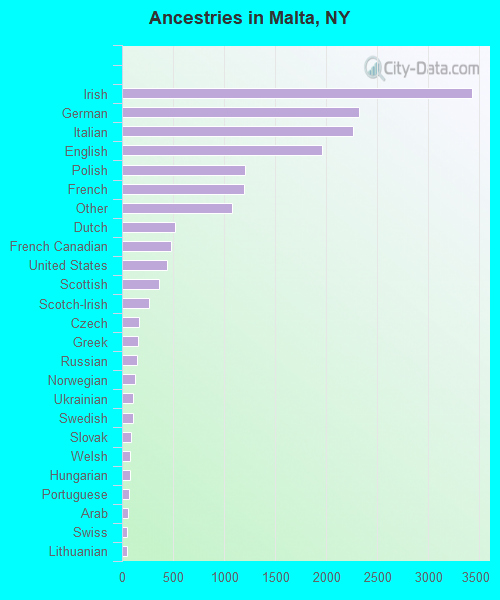
First ancestries reported:
- Irish: 3,426 (20.3%)
- German: 2,322 (13.8%)
- Italian: 2,267 (13.4%)
- English: 1,965 (11.6%)
- Polish: 1,205 (7.1%)
- French: 1,200 (7.1%)
- Other: 1,082 (6.4%)
- Dutch: 524 (3.1%)
- French Canadian: 481 (2.9%)
- United States: 439 (2.6%)
- Scottish: 359 (2.1%)
- Scotch-Irish: 266 (1.6%)
- Czech: 165 (1.0%)
- Greek: 152 (0.9%)
- Russian: 144 (0.9%)
- Norwegian: 129 (0.8%)
- Ukrainian: 109 (0.6%)
- Swedish: 104 (0.6%)
- Slovak: 85 (0.5%)
- Welsh: 78 (0.5%)
- Hungarian: 74 (0.4%)
- Portuguese: 68 (0.4%)
- Arab: 62 (0.4%)
- Swiss: 53 (0.3%)
- Lithuanian: 52 (0.3%)
- Danish: 51 (0.3%)
- West Indian: 15 (0.09%)
Most common places of birth for foreign-born residents (%):
| Malta: | 10.3% (43) |
| New York: | 1.4% (54,876) |
| Malta: | 8.9% (37) |
| New York: | 1.6% (62,237) |
| Malta: | 8.6% (36) |
| New York: | 1.0% (37,496) |
| Malta: | 7.0% (29) |
| New York: | 3.0% (117,238) |
| Malta: | 6.5% (27) |
| New York: | 3.8% (147,729) |
| Malta: | 5.8% (24) |
| New York: | 10.5% (408,086) |
| Malta: | 5.3% (22) |
| New York: | 0.5% (19,907) |
| Malta: | 4.6% (19) |
| New York: | 2.4% (94,595) |
| Malta: | 4.3% (18) |
| New York: | 2.5% (97,933) |
| Malta: | 3.6% (15) |
| New York: | 0.2% (7,531) |
| Malta: | 2.9% (12) |
| New York: | 0.2% (6,545) |
| Malta: | 2.6% (11) |
| New York: | 1.8% (69,327) |
| Malta: | 2.4% (10) |
| New York: | 2.4% (93,187) |
| Malta: | 2.4% (10) |
| New York: | 3.6% (139,226) |
| Malta: | 2.2% (9) |
| New York: | 0.1% (4,305) |
| Malta: | 2.2% (9) |
| New York: | 0.3% (13,070) |
| Malta: | 2.2% (9) |
| New York: | 0.2% (7,400) |
| Malta: | 1.9% (8) |
| New York: | 0.3% (13,246) |
| Malta: | 1.9% (8) |
| New York: | 0.4% (17,323) |
| Malta: | 1.9% (8) |
| New York: | 1.9% (72,408) |
| Malta: | 1.9% (8) |
| New York: | 5.9% (226,470) |
| Malta: | 1.9% (8) |
| New York: | 0.3% (12,209) |
| Malta: | 1.7% (7) |
| New York: | 1.1% (42,335) |
| Malta: | 1.7% (7) |
| New York: | 0.1% (1,981) |
| Malta: | 1.7% (7) |
| New York: | 0.5% (20,012) |
Place of birth for U.S.-born residents:
- This state: 9,943
- Other state: 2,571
- Northeast: 1,371
- Midwest: 517
- South: 462
- West: 221
54% of Malta residents lived in the same house 5 years ago.
Out of people who lived in different houses, 53% lived in this county.
Out of people who lived in different counties, 62% lived in New York.
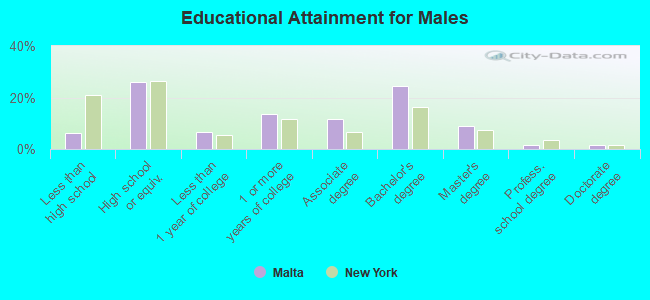
Education attainment for males 25 years and older:
- No schooling: 8
- Nursery to 4th grade: 0
- 5th and 6th grade: 30
- 7th and 8th grade: 10
- 9th grade: 22
- 10th grade: 64
- 11th grade: 43
- 12th grade, no diploma: 88
- High school graduate (or equivalency): 1,125
- Less than 1 year of college: 279
- Some college more than 1 year, no degree: 589
- Associate degree: 501
- Bachelor's degree: 1,057
- Master's degree: 396
- Professional school degree: 64
- Doctorate degree: 64
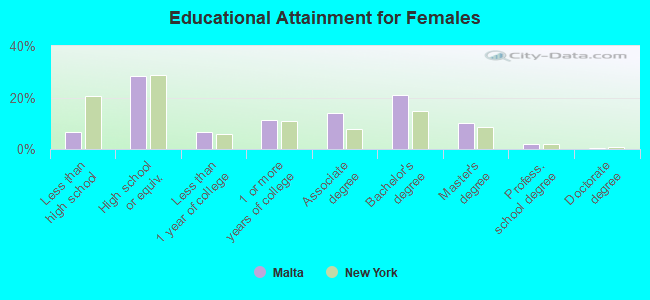
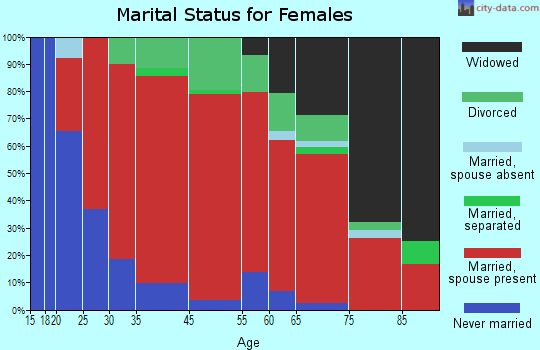
Education attainment for females 25 years and older:
- No schooling: 0
- Nursery to 4th grade: 5
- 5th and 6th grade: 0
- 7th and 8th grade: 59
- 9th grade: 18
- 10th grade: 68
- 11th grade: 62
- 12th grade, no diploma: 87
- High school graduate (or equivalency): 1,293
- Less than 1 year of college: 293
- Some college more than 1 year, no degree: 509
- Associate degree: 640
- Bachelor's degree: 945
- Master's degree: 461
- Professional school degree: 80
- Doctorate degree: 17
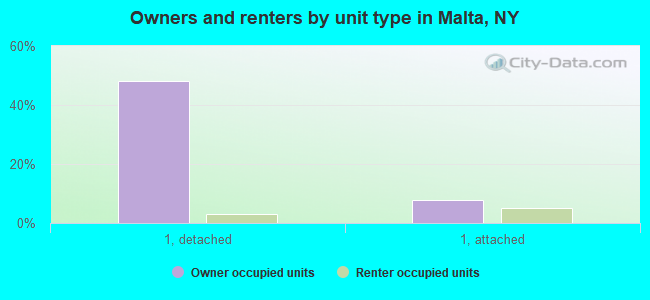
Housing units in structures:
- One, detached: 2,932
- One, attached: 718
- Two: 195
- 3 or 4: 967
- 5 to 9: 225
- 10 to 19: 51
- 20 to 49: 33
- 50 or more: 8
- Mobile homes: 618
- Boats, RVs, vans, etc.: 7
Median worth of mobile homes: $40,138
Housing units lacking complete kitchen facilities: 0.1%
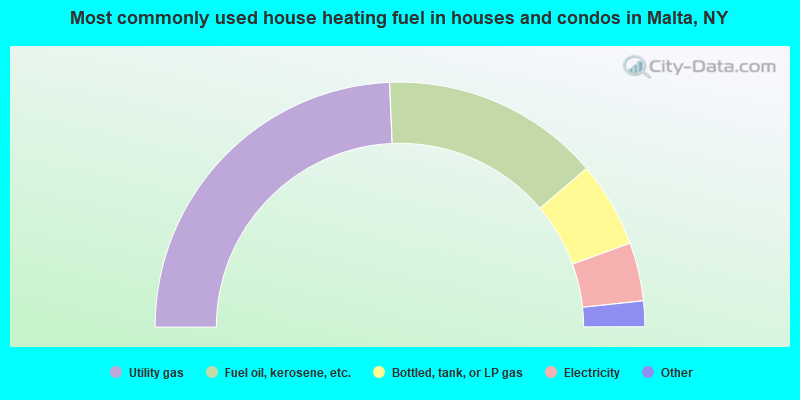
- 48.6%Utility gas
- 28.9%Fuel oil, kerosene, etc.
- 11.3%Bottled, tank, or LP gas
- 7.7%Electricity
- 2.7%Wood
- 0.5%Other fuel
- 0.2%No fuel used
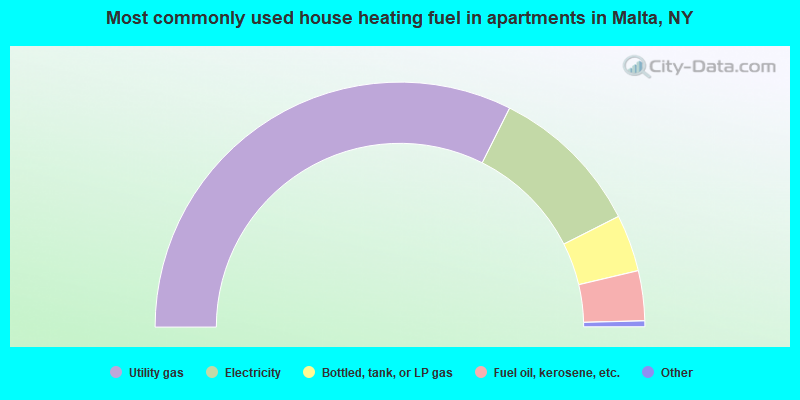
- 64.8%Utility gas
- 20.3%Electricity
- 7.5%Bottled, tank, or LP gas
- 6.6%Fuel oil, kerosene, etc.
- 0.4%Wood
- 0.4%Other fuel
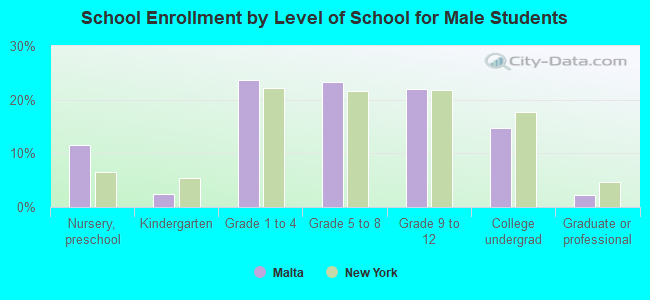
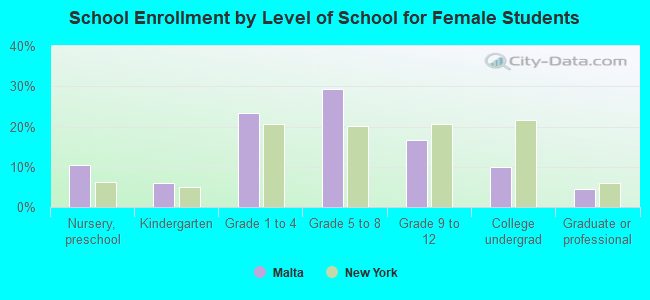
Private vs. public school enrollment:
| Here: | 3.3% |
| New York: | 14.0% |
| Here: | 3.0% |
| New York: | 13.2% |
| Here: | 34.6% |
| New York: | 38.2% |