Manassas Park, VA (Virginia) Houses and Residents
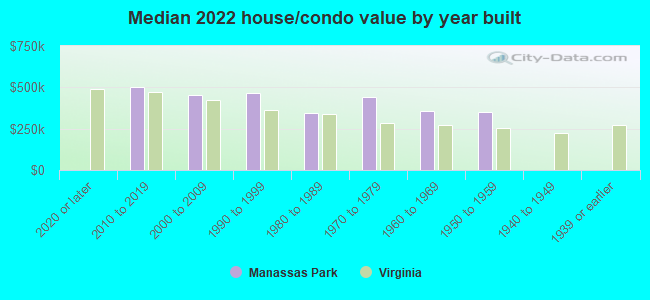
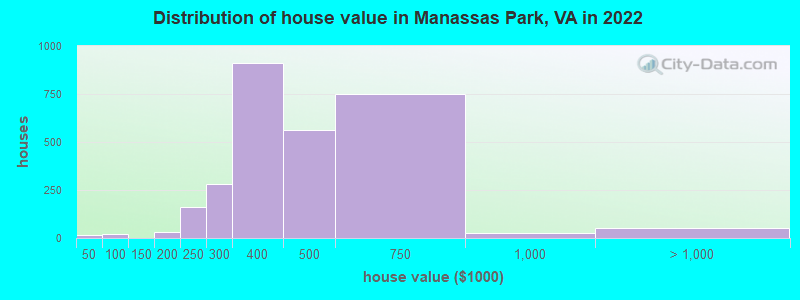
Estimated median house or condo value in 2022: $402,508 (it was $115,700 in 2000 )
Manassas Park:
$402,508Virginia:
$365,700
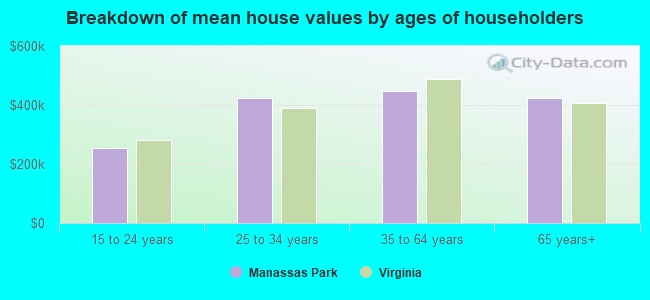
Lower value quartile - upper value quartile: $303,520 - $521,234Mean price in 2022: Detached houses: $445,433 Here:
$445,433State:
$472,865
Townhouses or other attached units: $399,771 Here:
$399,771State:
$457,437
In 5-or-more-unit structures: $240,954 Here:
$240,954State:
$382,551
Total population: 15,174 (Urban population: 10,290, Rural population: 0)
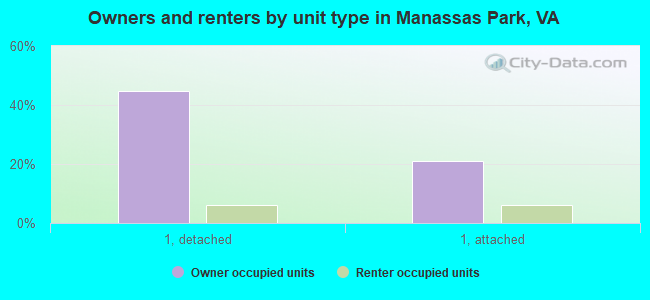
Houses: 5,611 (5,334 occupied: 3,400 owner occupied, 1,961 renter occupied )
% of renters here:
37%State:
33%
Housing density: 2,252 houses/condos per square mile
Median price asked for vacant for-sale houses and condos in 2022: $366,151.
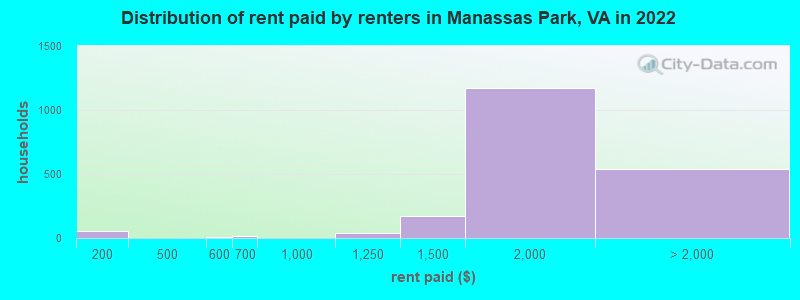
Median contract rent in 2022: $1,778 (lower quartile is $1,522, upper quartile is over $2,000)
Median rent asked for vacant for-rent units in 2022: $1,713
Median gross rent in Manassas Park, VA in 2022: over $2,000
Housing units in Manassas Park with a mortgage: 2,736 (192 second mortgage, 0 home equity loan, 137 both second mortgage and home equity loan )Houses without a mortgage: 17
Median household income for houses/condos with a mortgage: $127,686
Median household income for apartments without a mortgage: $84,767
Median monthly housing costs: $1,973
Data:
Median house or condo value ($)
Median house or condo value ($ change since 2000)
Median house or condo value ($) - White
Median house or condo value ($) - Black or African American
Median house or condo value ($) - Asian
Median house or condo value ($) - Hispanic or Latino
Median house or condo value ($) - American Indian and Alaska Native
Median house or condo value ($) - Multirace
Median house or condo value ($) - Other Race
Median price asked for mobile homes ($)
Household density (households per square mile)
Mean house or condo value by units in structure - 1, detached ($)
Mean house or condo value by units in structure - 1, attached ($)
Mean house or condo value by units in structure - 2 ($)
Mean house or condo value by units in structure by units in structure - 3 or 4 ($)
Mean house or condo value by units in structure - 5 or more ($)
Mean house or condo value by units in structure - Boat, RV, van, etc. ($)
Mean house or condo value by units in structure - Mobile home ($)
Median contract rent ($)
Median contract rent - Lower quartile ($)
Median contract rent - Upper quartile ($)
Median gross rent ($)
Urban houses (%)
Rural houses (%)
Houses occupied (%)
Houses occupied (% change since 2000)
Houses owner occupied (%)
Houses owner occupied (% change since 2000)
Houses renter occupied (%)
Houses renter occupied (% change since 2000)
Vacant housing units - For rent (%)
Vacant housing units - For rent (% change since 2000)
Vacant housing units - For sale only (%)
Vacant housing units - For sale only (% change since 2000)
Vacant housing units - Rented or sold, not occupied (%)
Vacant housing units - Rented or sold, not occupied (% change since 2000)
Vacant housing units - For seasonal, recreational, or occasional use (%)
Vacant housing units - For seasonal, recreational, or occasional use (% change since 2000)
Vacant housing units - For migrant workers (%)
Vacant housing units - For migrant workers (% change since 2000)
Vacant housing units - Other vacant (%)
Vacant housing units - Other vacant (% change since 2000)
Median monthly housing costs ($)
Median household income for houses/condos with a mortgage ($)
Median household income for houses/condos without a mortgage ($)
Median household income ($)
Median household income ($) - White
Median household income ($) - Black or African American
Median household income ($) - Asian
Median household income ($) - Hispanic or Latino
Median household income ($) - American Indian and Alaska Native
Median household income ($) - Multirace
Median household income ($) - Other Race
Mortgage status - with mortgage (%)
Mortgage status - with second mortgage (%)
Mortgage status - with home equity loan (%)
Mortgage status - with both second mortgage and home equity loan (%)
Mortgage status - without a mortgage (%)
Median year house/condo built
Median year apartment built
Household type by relationship - Male householder living alone (%)
Household type by relationship - Male householder not living alone (%)
Household type by relationship - Female householder living alone (%)
Household type by relationship - Female householder not living alone (%)
Household type by relationship - Opposite-Sex spouse (%)
Household type by relationship - Same-Sex spouse (%)
Household type by relationship - Opposite-Sex unmarried partner (%)
Household type by relationship - Same-Sex unmarried partner (%)
Household type by relationship - In group quarters (%)
Size of family households - 2-person household (%)
Size of family households - 3-person household (%)
Size of family households - 4-person household (%)
Size of family households - 5-person household (%)
Size of family households - 6-person household (%)
Size of family households - 7-or-more-person household (%)
Size of nonfamily households - 1-person household (%)
Size of nonfamily households - 2-person household (%)
Size of nonfamily households - 3-person household (%)
Size of nonfamily households - 4-person household (%)
Size of nonfamily households - 5-person household (%)
Size of nonfamily households - 6-person household (%)
Size of nonfamily households - 7-or-moreperson household (%)
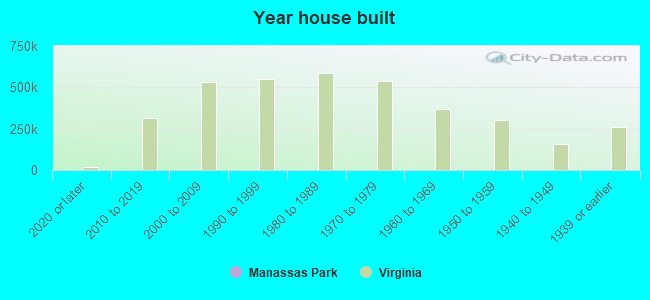
Year house built - Built 2010 or later (%)
Year house built - Built 2000 to 2009 (%)
Year house built - Built 1990 to 1999 (%)
Year house built - Built 1980 to 1989 (%)
Year house built - Built 1970 to 1979 (%)
Year house built - Built 1960 to 1969 (%)
Year house built - Built 1950 to 1959 (%)
Year house built - Built 1940 to 1949 (%)
Year house built - Built 1939 or earlier (%)
Median number of rooms in houses and condos
Median number of rooms in apartments
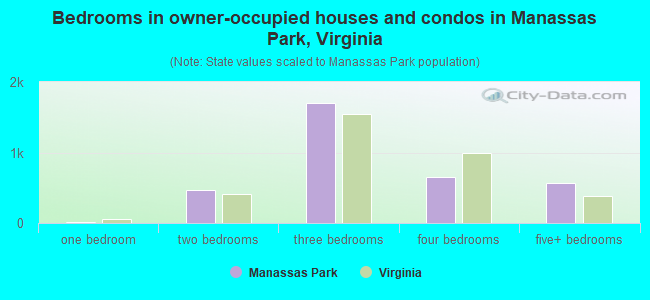
Median number of bedrooms in owner occupied houses
Mean number of bedrooms in owner occupied houses
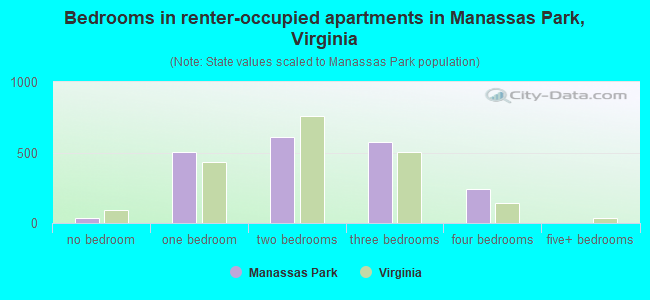
Median number of bedrooms in renter occupied houses
Mean number of bedrooms in renter occupied houses
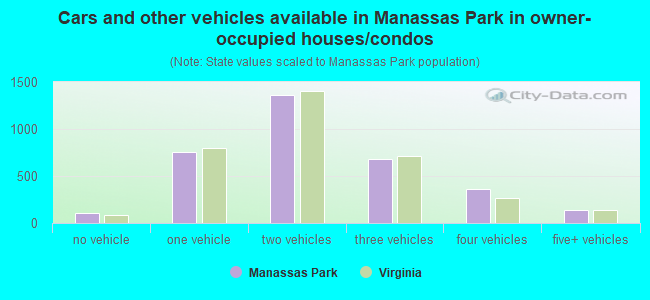
Median number of vehichles in owner occupied houses
Mean number of vehichles in owner occupied houses
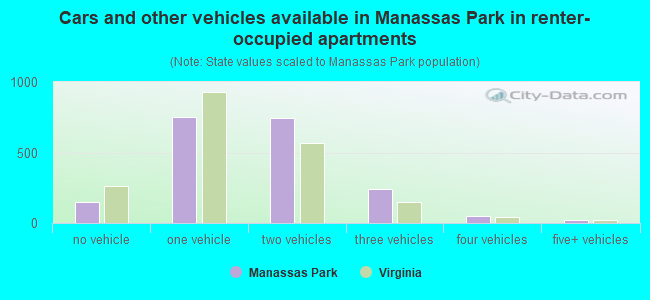
Median number of vehichles in renter occupied houses
Mean number of vehichles in renter occupied houses
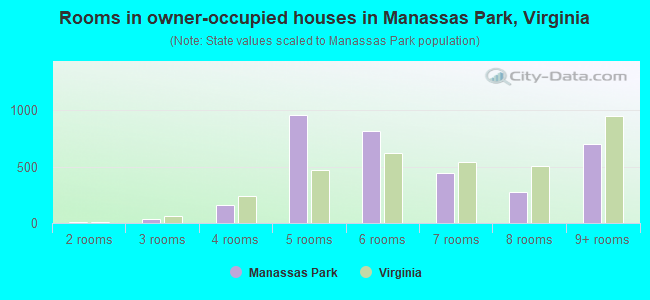
Rooms in owner-occupied houses - 1 room (%)
Rooms in owner-occupied houses - 2 rooms (%)
Rooms in owner-occupied houses - 3 rooms (%)
Rooms in owner-occupied houses - 4 rooms (%)
Rooms in owner-occupied houses - 5 rooms (%)
Rooms in owner-occupied houses - 6 rooms (%)
Rooms in owner-occupied houses - 7 rooms (%)
Rooms in owner-occupied houses - 8 rooms (%)
Rooms in owner-occupied houses - 9+ rooms (%)
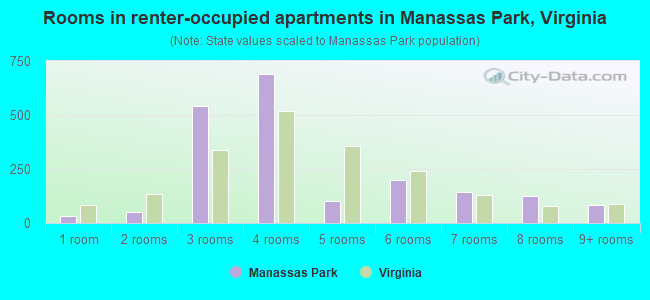
Rooms in renter-occupied houses - 1 room (%)
Rooms in renter-occupied houses - 2 rooms (%)
Rooms in renter-occupied houses - 3 rooms (%)
Rooms in renter-occupied houses - 4 rooms (%)
Rooms in renter-occupied houses - 5 rooms (%)
Rooms in renter-occupied houses - 6 rooms (%)
Rooms in renter-occupied houses - 7 rooms (%)
Rooms in renter-occupied houses - 8 rooms (%)
Rooms in renter-occupied houses - 9+ rooms (%)
Bedrooms in owner-occupied houses - no bedrooms (%)
Bedrooms in owner-occupied houses - 1 bedroom (%)
Bedrooms in owner-occupied houses - 2 bedrooms (%)
Bedrooms in owner-occupied houses - 3 bedrooms (%)
Bedrooms in owner-occupied houses - 4 bedrooms (%)
Bedrooms in owner-occupied houses - 5+ bedrooms (%)
Bedrooms in renter-occupied houses - no bedrooms (%)
Bedrooms in renter-occupied houses - 1 bedroom (%)
Bedrooms in renter-occupied houses - 2 bedrooms (%)
Bedrooms in renter-occupied houses - 3 bedrooms (%)
Bedrooms in renter-occupied houses - 4 bedrooms (%)
Bedrooms in renter-occupied houses - 5+ bedrooms (%)
Vehicles available in owner-occupied houses - no vehicle available (%)
Vehicles available in owner-occupied houses - 1 vehicle available(%)
Vehicles available in owner-occupied houses - 2 Vehicles available (%)
Vehicles available in owner-occupied houses - 3 Vehicles available (%)
Vehicles available in owner-occupied houses - 4 Vehicles available (%)
Vehicles available in owner-occupied houses - 5+ Vehicles available (%)
Vehicles available in renter-occupied houses - no vehicle available (%)
Vehicles available in renter-occupied houses - 1 vehicle available (%)
Vehicles available in renter-occupied houses - 2 Vehicles available (%)
Vehicles available in renter-occupied houses - 3 Vehicles available (%)
Vehicles available in renter-occupied houses - 4 Vehicles available (%)
Vehicles available in renter-occupied houses - 5+ Vehicles available (%)
Housing units in structures - 1, detached (%)
Housing units in structures - 1, attached (%)
Housing units in structures - 2 (%)
Housing units in structures - 3 or 4 (%)
Housing units in structures - 5 to 9 (%)
Housing units in structures - 10 to 19 (%)
Housing units in structures - 20 to 49 (%)
Housing units in structures - 50 or more (%)
Housing units in structures - Mobile home (%)
Housing units in structures - Boat, RV, van, etc. (%)
Housing units in structures - Owners - 1, detached (%)
Housing units in structures - Owners - 1, attached (%)
Housing units in structures - Owners - 2 (%)
Housing units in structures - Owners - 3 or 4 (%)
Housing units in structures - Owners - 5 to 9 (%)
Housing units in structures - Owners - 10 to 19 (%)
Housing units in structures - Owners - 20 to 49 (%)
Housing units in structures - Owners - 50 or more (%)
Housing units in structures - Owners - Mobile home (%)
Housing units in structures - Owners - Boat, RV, van, etc. (%)
Housing units in structures - Renters - 1, detached (%)
Housing units in structures - Renters - 1, attached (%)
Housing units in structures - Renters - 2 (%)
Housing units in structures - Renters - 3 or 4 (%)
Housing units in structures - Renters - 5 to 9 (%)
Housing units in structures - Renters - 10 to 19 (%)
Housing units in structures - Renters - 20 to 49 (%)
Housing units in structures - Renters - 50 or more (%)
Housing units in structures - Renters - Mobile home (%)
Housing units in structures - Renters - Boat, RV, van, etc. (%)
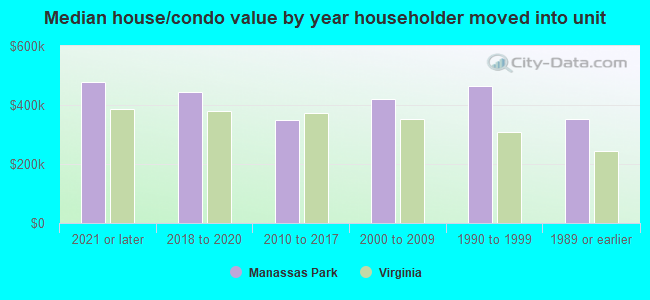
House/condo owner moved in on average (years ago)
Renter moved in on average (years ago)
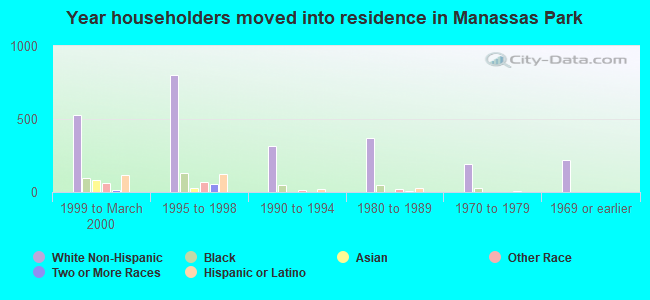
Year householder moved into unit - Moved in 1999 to March 2000 (%)
Year householder moved into unit - Moved in 1999 to March 2000 (%) - White
Year householder moved into unit - Moved in 1999 to March 2000 (%) - Black or African American
Year householder moved into unit - Moved in 1999 to March 2000 (%) - Asian
Year householder moved into unit - Moved in 1999 to March 2000 (%) - Hispanic or Latino
Year householder moved into unit - Moved in 1999 to March 2000 (%) - American Indian and Alaska Native
Year householder moved into unit - Moved in 1999 to March 2000 (%) - Multirace
Year householder moved into unit - Moved in 1999 to March 2000 (%) - Other Race
Year householder moved into unit - Moved in 1995 to 1998 (%)
Year householder moved into unit - Moved in 1995 to 1998 (%) - White
Year householder moved into unit - Moved in 1995 to 1998 (%) - Black or African American
Year householder moved into unit - Moved in 1995 to 1998 (%) - Asian
Year householder moved into unit - Moved in 1995 to 1998 (%) - Hispanic or Latino
Year householder moved into unit - Moved in 1995 to 1998 (%) - American Indian and Alaska Native
Year householder moved into unit - Moved in 1995 to 1998 (%) - Multirace
Year householder moved into unit - Moved in 1995 to 1998 (%) - Other Race
Year householder moved into unit - Moved in 1990 to 1994 (%)
Year householder moved into unit - Moved in 1990 to 1994 (%) - White
Year householder moved into unit - Moved in 1990 to 1994 (%) - Black or African American
Year householder moved into unit - Moved in 1990 to 1994 (%) - Asian
Year householder moved into unit - Moved in 1990 to 1994 (%) - Hispanic or Latino
Year householder moved into unit - Moved in 1990 to 1994 (%) - American Indian and Alaska Native
Year householder moved into unit - Moved in 1990 to 1994 (%) - Multirace
Year householder moved into unit - Moved in 1990 to 1994 (%) - Other Race
Year householder moved into unit - Moved in 1980 to 1989 (%)
Year householder moved into unit - Moved in 1980 to 1989 (%) - White
Year householder moved into unit - Moved in 1980 to 1989 (%) - Black or African American
Year householder moved into unit - Moved in 1980 to 1989 (%) - Asian
Year householder moved into unit - Moved in 1980 to 1989 (%) - Hispanic or Latino
Year householder moved into unit - Moved in 1980 to 1989 (%) - American Indian and Alaska Native
Year householder moved into unit - Moved in 1980 to 1989 (%) - Multirace
Year householder moved into unit - Moved in 1980 to 1989 (%) - Other Race
Year householder moved into unit - Moved in 1970 to 1979 (%)
Year householder moved into unit - Moved in 1970 to 1979 (%) - White
Year householder moved into unit - Moved in 1970 to 1979 (%) - Black or African American
Year householder moved into unit - Moved in 1970 to 1979 (%) - Asian
Year householder moved into unit - Moved in 1970 to 1979 (%) - Hispanic or Latino
Year householder moved into unit - Moved in 1970 to 1979 (%) - American Indian and Alaska Native
Year householder moved into unit - Moved in 1970 to 1979 (%) - Multirace
Year householder moved into unit - Moved in 1970 to 1979 (%) - Other Race
Year householder moved into unit - Moved in 1969 or earlier (%)
Year householder moved into unit - Moved in 1969 or earlier (%) - White
Year householder moved into unit - Moved in 1969 or earlier (%) - Black or African American
Year householder moved into unit - Moved in 1969 or earlier (%) - Asian
Year householder moved into unit - Moved in 1969 or earlier (%) - Hispanic or Latino
Year householder moved into unit - Moved in 1969 or earlier (%) - American Indian and Alaska Native
Year householder moved into unit - Moved in 1969 or earlier (%) - Multirace
Year householder moved into unit - Moved in 1969 or earlier (%) - Other Race
Housing units lacking complete plumbing facilities (%)
Housing units lacking complete kitchen facilities (%)
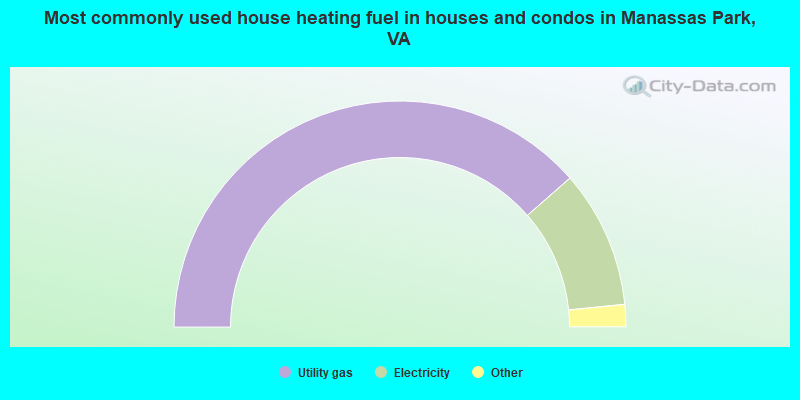
House heating fuel used in houses and condos - Utility gas (%)
House heating fuel used in houses and condos - Bottled, tank, or LP gas (%)
House heating fuel used in houses and condos - Electricity (%)
House heating fuel used in houses and condos - Fuel oil, kerosene, etc. (%)
House heating fuel used in houses and condos - Coal or coke (%)
House heating fuel used in houses and condos - Wood (%)
House heating fuel used in houses and condos - Solar energy (%)
House heating fuel used in houses and condos - Other fuel (%)
House heating fuel used in houses and condos - No fuel used (%)
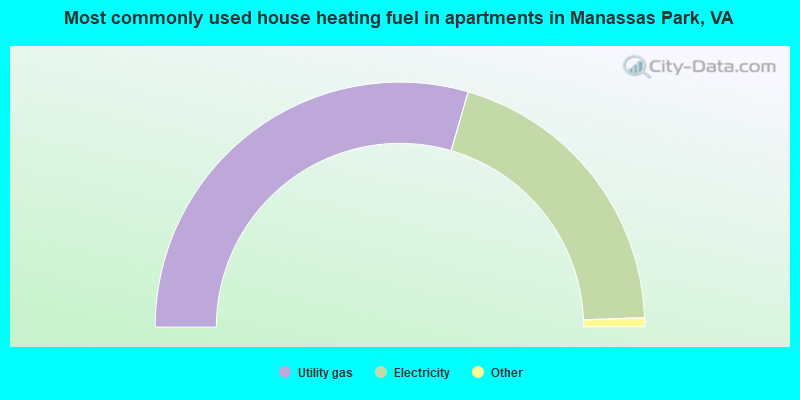
House heating fuel used in apartments - Utility gas (%)
House heating fuel used in apartments - Bottled, tank, or LP gas (%)
House heating fuel used in apartments - Electricity (%)
House heating fuel used in apartments - Fuel oil, kerosene, etc. (%)
House heating fuel used in apartments - Coal or coke (%)
House heating fuel used in apartments - Wood (%)
House heating fuel used in apartments - Solar energy (%)
House heating fuel used in apartments - Other fuel (%)
House heating fuel used in apartments - No fuel used (%)
Median year house/condo built: 1991Median year apartment built: 2006Household type by relationship:
Households: 17,330
Male householders: 3,101 (830 living alone ), Female householders: 2,183 (640 living alone )2,483 spouses (2,469 opposite-sex spouses ), 392 unmarried partners , (392 opposite-sex unmarried partners ), 5,674 children (5,462 natural , 20 adopted , 192 stepchildren ), 770 grandchildren , 349 brothers or sisters , 934 parents , 33 foster children , 524 other relatives , 883 non-relatives
Size of family households: 1,214 2-persons , 712 3-persons , 511 4-persons , 731 5-persons , 256 6-persons , 288 7-or-more-persons .
Size of nonfamily households: 1,554 1-person , 94 2-persons , 50 3-persons .
2,270 married couples with children. single-parent households (107 men , 957 women ).
47.6% of residents of Manassas Park speak English at home. of residents speak Spanish at home (56% speak English very well , 23% speak English well , 14% speak English not well , 7% don't speak English at all ).of residents speak other Indo-European language at home (59% speak English very well , 28% speak English well , 13% speak English not well , 1% don't speak English at all ).of residents speak Asian or Pacific Island language at home (50% speak English very well , 20% speak English well , 30% speak English not well ).of residents speak other language at home (62% speak English very well , 38% speak English well ).
Foreign born population: 6,123 (35.3%)of them are naturalized citizens )
Median number of rooms in houses and condos:
Median number of rooms in apartments
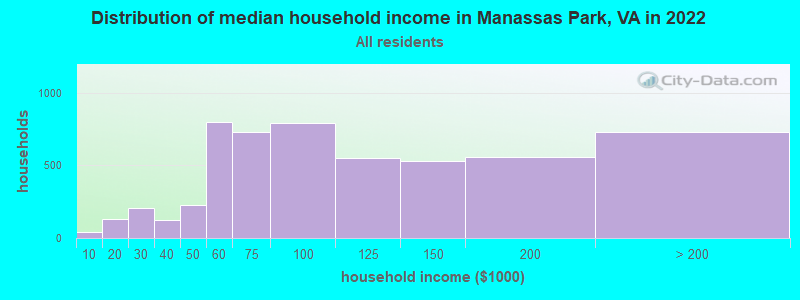
Manassas Park, VA household income distribution 41 Less than $10,000131 $10,000 to $19,999210 $20,000 to $29,999122 $30,000 to $39,999230 $40,000 to $49,999799 $50,000 to $59,999728 $60,000 to $74,999792 $75,000 to $99,999552 $100,000 to $124,999528 $125,000 to $149,999556 $150,000 to $199,999727 $200,000 or more
Home value of owner - occupied houses in 2022 in Manassas Park, VA 18 Less than $10,00021 $90,000 to $99,99921 $150,000 to $174,9999 $175,000 to $199,999160 $200,000 to $249,999279 $250,000 to $299,999911 $300,000 to $399,999563 $400,000 to $499,999747 $500,000 to $749,99923 $750,000 to $999,99951 $2,000,000 or moreRent paid by renters in 2022 in Manassas Park, VA 55 $100 to $1494 $550 to $59912 $600 to $64941 $1,000 to $1,249173 $1,250 to $1,4991,169 $1,500 to $1,999506 $2,000 to $2,49936 No cash rent
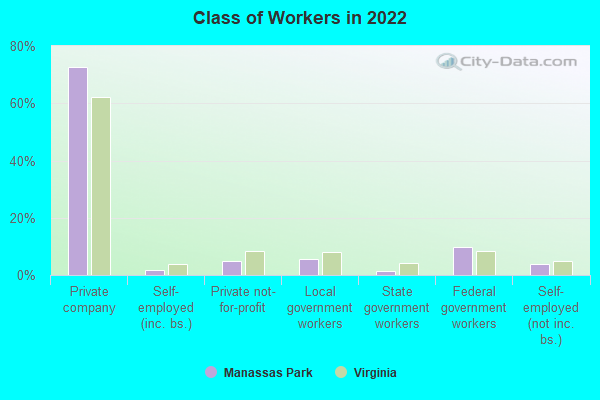
Percentage of workers working in this county: 17.2%Number of people working at home: 1,054 (10.7% of all workers )
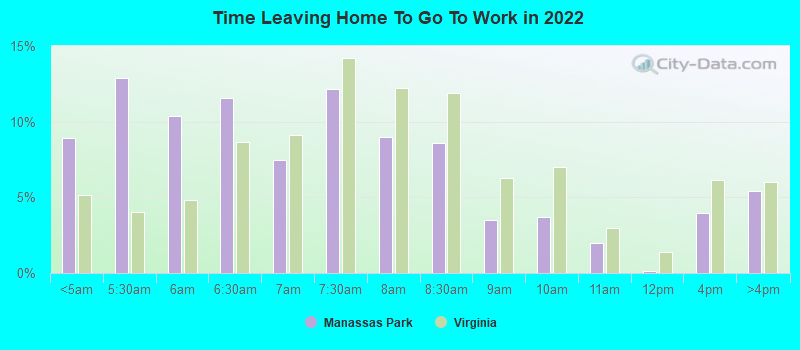
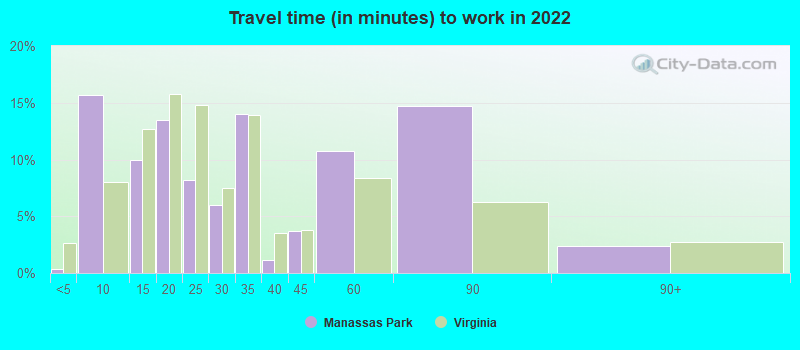
Travel time to work (commute)
Less than 5 minutes: 365 to 9 minutes: 67710 to 14 minutes: 57515 to 19 minutes: 84520 to 24 minutes: 53325 to 29 minutes: 49230 to 34 minutes: 1,31935 to 39 minutes: 18740 to 44 minutes: 67145 to 59 minutes: 1,19160 to 89 minutes: 1,45290 or more minutes: 418
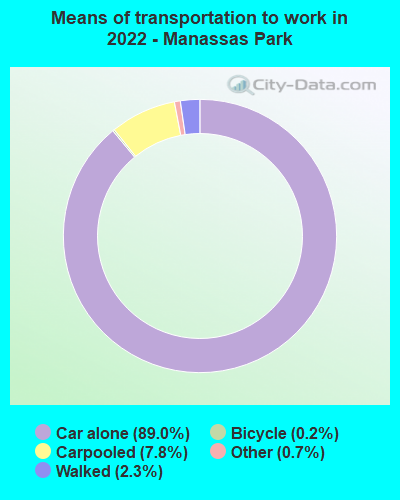
Means of transportation to work:
Drove a car alone: 3,106 (67.2%)Carpooled: 271 (5.9%)Taxi: 33 (0.7%)Bicycle: 6 (0.1%)Walked: 76 (1.6%)Worked at home: 1,054 (22.8%)
Unemployment by race in 2022
Unemployment rate for White non-Hispanic residents 2.4% Males4.6% FemalesUnemployment rate for Black residents 1.8% MalesUnemployment rate for Asian residents 1.7% MalesUnemployment rate for other race residents 17.2% MalesUnemployment rate for Hispanic or Latino residents 5.2% Males0.9% Females
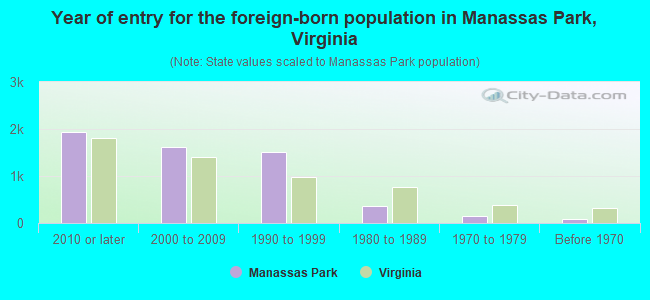
Year of entry for the foreign-born population in Manassas Park, Virginia
1,941 2010 or later 1,624 2000 to 2009 1,512 1990 to 1999 365 1980 to 1989 139 1970 to 1979 84 Before 1970
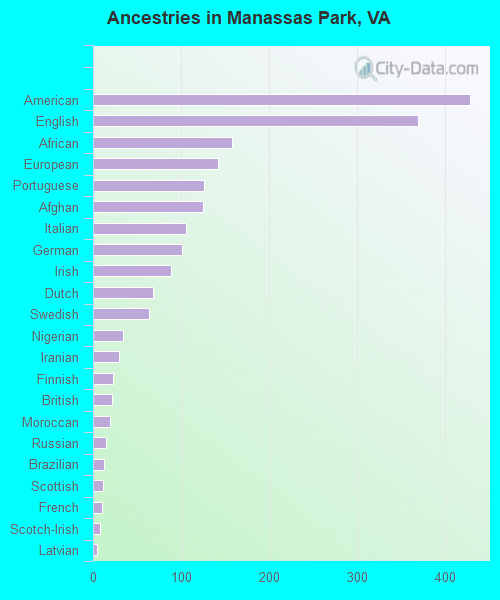
First ancestries reported:
American: 428 (4.2%)
English: 369 (3.6%)
African: 158 (1.6%)
European: 142 (1.4%)
Portuguese: 126 (1.2%)
Afghan: 125 (1.2%)
Italian: 105 (1.0%)
German: 101 (1.0%)
Irish: 89 (0.9%)
Dutch: 68 (0.7%)
Swedish: 63 (0.6%)
Nigerian: 34 (0.3%)
Iranian: 30 (0.3%)
Finnish: 23 (0.2%)
British: 21 (0.2%)
Moroccan: 19 (0.2%)
Russian: 15 (0.1%)
Brazilian: 12 (0.1%)
Scottish: 11 (0.1%)
French: 10 (0.10%)
Scotch-Irish: 8 (0.08%)
Latvian: 4 (0.04%) Most common places of birth for foreign-born residents (%): El Salvador Manassas Park:
17.8% (1,131)Virginia:
9.9% (107,534)
Guatemala Manassas Park:
13.8% (873)Virginia:
3.3% (35,938)
Vietnam Manassas Park:
8.3% (529)Virginia:
4.2% (45,750)
Mexico Manassas Park:
7.1% (452)Virginia:
5.3% (57,498)
Honduras Manassas Park:
6.7% (426)Virginia:
3.0% (32,892)
Iraq Manassas Park:
6.2% (393)Virginia:
0.9% (9,351)
Cameroon Manassas Park:
5.1% (326)Virginia:
0.2% (2,575)
Peru Manassas Park:
4.9% (312)Virginia:
2.4% (26,366)
Nicaragua Manassas Park:
3.3% (212)Virginia:
0.6% (6,916)
Bangladesh Manassas Park:
2.6% (168)Virginia:
1.1% (12,049)
India Manassas Park:
2.6% (167)Virginia:
9.0% (97,830)
Pakistan Manassas Park:
2.0% (125)Virginia:
2.3% (24,582)
Kuwait Manassas Park:
1.7% (109)Virginia:
0.1% (1,002)
Place of birth for U.S.-born residents:
This state: 6,523Other state: 4,006Northeast: 852Midwest: 695South: 1,647West: 813 87.7% of Manassas Park residents lived in the same house 1 years ago.
Out of people who lived in different houses, 5.6% lived in this county.
Out of people who lived in different counties, 79.9% lived in Virginia.
Manassas Park:
87.7%State average:
86.6%
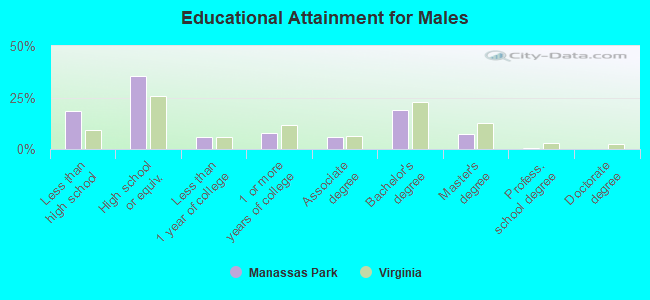
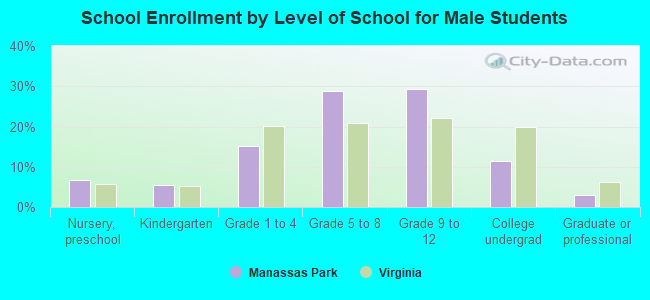
Education attainment for males 25 years and older:
No schooling: 539Nursery to 4th grade: 455th and 6th grade: 347th and 8th grade: 1329th grade: 8910th grade: 2911th grade: 8212th grade, no diploma: 162High school graduate (or equivalency): 2,131Less than 1 year of college: 366Some college more than 1 year, no degree: 460Associate degree: 353Bachelor's degree: 1,154Master's degree: 450Professional school degree: 18Doctorate degree: 6
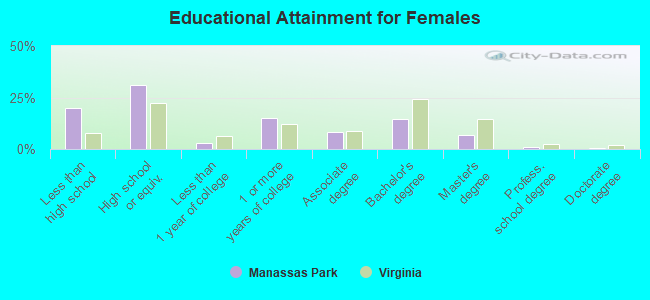
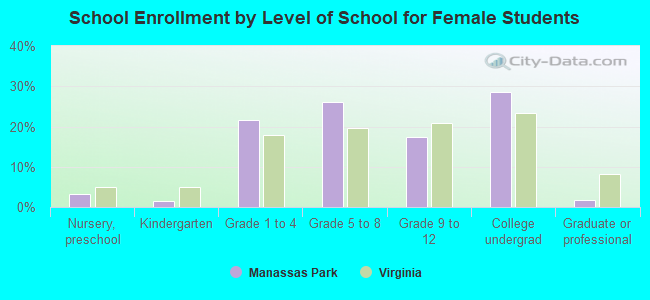
Education attainment for females 25 years and older:
No schooling: 634Nursery to 4th grade: 05th and 6th grade: 857th and 8th grade: 379th grade: 6810th grade: 2011th grade: 2212th grade, no diploma: 243High school graduate (or equivalency): 1,734Less than 1 year of college: 163Some college more than 1 year, no degree: 843Associate degree: 446Bachelor's degree: 806Master's degree: 383Professional school degree: 42Doctorate degree: 25
Housing units in structures:
One, detached: 2,411One, attached: 1,615Two: 2733 or 4: 805 to 9: 3310 to 19: 38120 to 49: 29650 or more: 520Housing units lacking complete plumbing facilities in 2022: 0.2%Housing units lacking complete kitchen facilities in 2022: 0.3%House/condo owner moved in on average 12 years ago
Renter moved in on average 1 years ago
Private vs. public school enrollment:
Students in private schools in grades 1 to 8 (elementary and middle school): 144 Students in private schools in grades 9 to 12 (high school): 13 Students in private undergraduate colleges: 166