Mangonia Park, FL (Florida) Houses and Residents
| Mangonia Park: | $317,709 |
| Florida: | $354,100 |
Mean price in 2022:
Detached houses: $231,574
Here: $231,574 State: $500,941 In 3-to-4-unit structures: $104,871
Here: $104,871 State: $309,944
Total population: 1,958 (Urban population: 1,294, Rural population: 0)
Houses: 735 (686 occupied: 182 owner occupied, 513 renter occupied)
| % of renters here: | 74% |
| State: | 33% |
Housing density: 1,037 houses/condos per square mile
Median price asked for vacant for-sale houses and condos in 2022 in this county: $690,805.
Median contract rent in 2022: $1,378 (lower quartile is $1,159, upper quartile is $1,644)
Median rent asked for vacant for-rent units in 2022: $1,666
Median gross rent in Mangonia Park, FL in 2022: $1,505
Housing units in Mangonia Park with a mortgage: 120 (3 second mortgage, 0 home equity loan, 0 both second mortgage and home equity loan)
Houses without a mortgage: 0
Median household income for houses/condos with a mortgage: $61,474
Median household income for apartments without a mortgage: $41,396
Median monthly housing costs: $1,470
Compare current foreclosures near Mangonia Park, FL:
| Photo | Address | Area | Beds / Baths | Price | Details |
|---|---|---|---|---|---|

|
#1
Northgreen Dr
Lake Worth, FL 33449
|
2,929 sq. feet
|
3 baths 3 beds |
$655,000
|
show details |

|
#2
47th Ct N
Loxahatchee, FL 33470
|
2,044 sq. feet
|
3 baths 2 beds |
show details | |

|
#3
Felter St
Jupiter, FL 33458
|
1,352 sq. feet
|
2 baths 3 beds |
show details | |

|
#4
Palm Rd
West Palm Beach, FL 33406
|
- sq. feet
|
2 baths 3 beds |
show details | |

|
#5
Pinehurst Rd
Lake Worth, FL 33461
|
1,494 sq. feet
|
2 baths 3 beds |
show details | |

|
#6
W Prestwich Dr
Loxahatchee, FL 33470
|
1,964 sq. feet
|
2 baths 3 beds |
show details | |

|
#7
E Cornwall Dr
Loxahatchee, FL 33470
|
1,422 sq. feet
|
2 baths 3 beds |
show details | |

|
#8
72nd Rd N
Loxahatchee, FL 33470
|
2,024 sq. feet
|
2 baths 3 beds |
show details | |

|
#9
Venessa St
Lake Worth, FL 33461
|
1,203 sq. feet
|
2 baths 3 beds |
show details | |

|
#10
Willow Pond Rd # 18b
West Palm Beach, FL 33417
|
1,685 sq. feet
|
2 baths 3 beds |
show details |
| Photo | Address | Area | Beds / Baths | Price | Details |
|---|---|---|---|---|---|

|
#11
Monmouth Rd
West Palm Beach, FL 33413
|
2,283 sq. feet
|
2 baths 4 beds |
show details | |

|
#12
Ambach Way
Lake Worth, FL 33462
|
1,243 sq. feet
|
2 baths 2 beds |
show details | |

|
#13
Woodcrest Rd N
West Palm Beach, FL 33417
|
1,542 sq. feet
|
2 baths 3 beds |
show details | |

|
#14
Foss Rd
Lake Worth, FL 33461
|
1,721 sq. feet
|
3 baths 2 beds |
show details | |

|
#15
Holly Lake Dr
Lake Worth, FL 33463
|
1,646 sq. feet
|
2 baths 3 beds |
show details | |

|
#16
Sussex H
West Palm Beach, FL 33417
|
615 sq. feet
|
1 baths 1 beds |
show details | |

|
#17
Strawberry Lakes Cir
Lake Worth, FL 33463
|
1,477 sq. feet
|
2 baths 3 beds |
show details | |

|
#18
Presidential Way Apt 202
West Palm Beach, FL 33401
|
898 sq. feet
|
1 baths 1 beds |
show details | |

|
#19
Venessa St
Lake Worth, FL 33461
|
1,203 sq. feet
|
2 baths 3 beds |
show details | |

|
#20
47th Ct N
Loxahatchee, FL 33470
|
1,058 sq. feet
|
2 baths 3 beds |
show details |
| Photo | Address | Area | Beds / Baths | Price | Details |
|---|---|---|---|---|---|

|
#21
Redon Dr, C O Carol Wische
Palm Beach Gardens, FL 33410
|
5,265 sq. feet
|
4 baths 4 beds |
show details | |

|
#22
Camellia Dr
West Palm Beach, FL 33411
|
1,333 sq. feet
|
2 baths 4 beds |
show details | |

|
#23
Tangerine Blvd
West Palm Beach, FL 33412
|
1,440 sq. feet
|
2 baths 3 beds |
show details | |

|
#24
Berenger Walk
Royal Palm Beach, FL 33414
|
2,215 sq. feet
|
2 baths 4 beds |
show details | |

|
#25
Isleworth Ct
West Palm Beach, FL 33411
|
2,424 sq. feet
|
2 baths 4 beds |
show details | |

|
#26
Dupont Pl
West Palm Beach, FL 33414
|
2,743 sq. feet
|
2 baths 5 beds |
show details | |

|
#27
Maddock St
West Palm Beach, FL 33405
|
1,854 sq. feet
|
2 baths 3 beds |
show details | |

|
#28
Cynthia Ln Apt 115
Lake Worth, FL 33461
|
612 sq. feet
|
1 baths 1 beds |
show details | |

|
#29
Foster St
Jupiter, FL 33458
|
1,780 sq. feet
|
2 baths 3 beds |
show details | |

|
#30
Dupont Pl
West Palm Beach, FL 33414
|
2,445 sq. feet
|
2 baths 4 beds |
show details |
| Photo | Address | Area | Beds / Baths | Price | Details |
|---|---|---|---|---|---|

|
#31
Berenger Walk
West Palm Beach, FL 33414
|
2,486 sq. feet
|
2 baths 4 beds |
show details | |

|
#32
Glendale Dr
West Palm Beach, FL 33411
|
2,778 sq. feet
|
2 baths 5 beds |
show details | |

|
#33
Village Walk Dr
West Palm Beach, FL 33411
|
1,444 sq. feet
|
2 baths 3 beds |
show details | |

|
#34
76th Rd N
West Palm Beach, FL 33412
|
1,439 sq. feet
|
2 baths 3 beds |
show details | |

|
#35
Locustberry Ln Apt 107
Jupiter, FL 33458
|
2,068 sq. feet
|
2 baths 3 beds |
show details | |

|
#36
Leland Ln
Lake Worth, FL 33463
|
1,294 sq. feet
|
2 baths 3 beds |
show details | |

|
#37
Seagrape Dr Apt 108
Jupiter, FL 33458
|
2,062 sq. feet
|
2 baths 3 beds |
show details | |

|
#38
Danforth Ter
Royal Palm Beach, FL 33414
|
3,963 sq. feet
|
4 baths 6 beds |
show details | |

|
#39
Erik Way
Lake Worth, FL 33463
|
2,030 sq. feet
|
2 baths 3 beds |
show details | |

|
#40
24th Ln
Lake Worth, FL 33463
|
1,488 sq. feet
|
2 baths 2 beds |
show details |
| Photo | Address | Area | Beds / Baths | Price | Details |
|---|---|---|---|---|---|

|
#41
Ungerer St
Jupiter, FL 33458
|
1,942 sq. feet
|
2 baths 4 beds |
show details | |

|
#42
S M St # 3
Lake Worth, FL 33460
|
4,074 sq. feet
|
5 baths 9 beds |
show details | |

|
#43
63rd Ln N
West Palm Beach, FL 33412
|
1,498 sq. feet
|
2 baths 3 beds |
show details | |

|
#44
Saratoga Blvd E
West Palm Beach, FL 33411
|
1,341 sq. feet
|
2 baths 3 beds |
show details | |

|
#45
Man Of War
West Palm Beach, FL 33411
|
1,546 sq. feet
|
2 baths 3 beds |
show details | |

|
#46
Lakeview Cir
West Palm Beach, FL 33411
|
1,125 sq. feet
|
2 baths 2 beds |
show details | |

|
#47
Lakeview Dr E
West Palm Beach, FL 33411
|
1,125 sq. feet
|
2 baths 2 beds |
show details | |

|
#48
Westminster Dr
Lake Worth, FL 33463
|
1,359 sq. feet
|
2 baths 3 beds |
show details | |

|
#49
Whispering Pine Way
Lake Worth, FL 33463
|
935 sq. feet
|
1 baths 2 beds |
show details | |

|
Check over 1 million property listings on Foreclosure.com!
|
browse all offers | |||


 | Moving to Boca area, want to rent near Tri-Rail (5 replies) |
| Sticky thread for pics! (115 replies) |
| How is Boynton Beach to live in? (36 replies) |
| Palm Beach County (63 replies) |
| West Palm Beach worth a look? (70 replies) |

Median year apartment built: 1979
Household type by relationship:
Households: 1,980- Male householders: 201 (55 living alone), Female householders: 484 (169 living alone)
126 spouses (126 opposite-sex spouses), 49 unmarried partners, (49 opposite-sex unmarried partners), 783 children (762 natural, 6 adopted, 14 stepchildren), 50 grandchildren, 126 brothers or sisters, 24 parents, 13 foster children, 49 other relatives, 43 non-relatives
- In group quarters: 26
Size of family households: 142 2-persons, 94 3-persons, 94 4-persons, 58 5-persons, 28 6-persons.
Size of nonfamily households: 231 1-person, 43 2-persons.
144 married couples with children.
475 single-parent households (25 men, 450 women).
74.9% of residents of Mangonia Park speak English at home.
8.1% of residents speak Spanish at home (68% speak English very well, 3% speak English well, 13% speak English not well, 16% don't speak English at all).
15.5% of residents speak other Indo-European language at home (65% speak English very well, 25% speak English well, 10% speak English not well).
0.3% of residents speak other language at home (100% speak English well).
Foreign born population: 343 (17.3%)
(43.1% of them are naturalized citizens)
| Here: | 5.4 |
| State: | 5.9 |
| Here: | 4.4 |
| State: | 4.2 |

- Bedrooms in owner-occupied houses and condos in Mangonia Park, Florida
- 0no bedroom
- 51 bedroom
- 442 bedrooms
- 983 bedrooms
- 284 bedrooms
- 75+ bedrooms

- Bedrooms in renter-occupied apartments in Mangonia Park, Florida
- 0no bedroom
- 161 bedroom
- 3072 bedrooms
- 1733 bedrooms
- 164 bedrooms
- 05+ bedrooms

- Cars and other vehicles available in Mangonia Park in owner-occupied houses/condos
- 24no vehicle
- 861 vehicle
- 412 vehicles
- 223 vehicles
- 104 vehicles
- 05+ vehicles

- Cars and other vehicles available in Mangonia Park in renter-occupied apartments
- 69no vehicle
- 3171 vehicle
- 1102 vehicles
- 163 vehicles
- 04 vehicles
- 05+ vehicles

- Rooms in owner-occupied houses in Mangonia Park, Florida
- 01 room
- 02 rooms
- 43 rooms
- 154 rooms
- 885 rooms
- 236 rooms
- 297 rooms
- 58 rooms
- 199+ rooms

- Rooms in renter-occupied apartments in Mangonia Park, Florida
- 01 room
- 162 rooms
- 253 rooms
- 2274 rooms
- 1645 rooms
- 676 rooms
- 87 rooms
- 68 rooms
- 09+ rooms


Mangonia Park, FL household income distribution

- 68Less than $10,000
- 58$10,000 to $19,999
- 89$20,000 to $29,999
- 90$30,000 to $39,999
- 83$40,000 to $49,999
- 88$50,000 to $59,999
- 88$60,000 to $74,999
- 61$75,000 to $99,999
- 29$100,000 to $124,999
- 15$125,000 to $149,999
- 5$150,000 to $199,999
- 11$200,000 or more
Home value of owner - occupied houses in 2022 in Mangonia Park, FL
-
- 11$70,000 to $79,999
- 1$80,000 to $89,999
- 8$90,000 to $99,999
- 11$100,000 to $124,999
- 9$125,000 to $149,999
- 6$150,000 to $174,999
- 8$200,000 to $249,999
- 21$250,000 to $299,999
- 58$300,000 to $399,999
- 7$400,000 to $499,999
Rent paid by renters in 2022 in Mangonia Park, FL
-
- 5$900 to $999
- 192$1,000 to $1,249
- 127$1,250 to $1,499
- 96$1,500 to $1,999
- 20$2,000 to $2,499
- 14No cash rent


Percentage of workers working in this county: 95.7%
Number of people working at home: 55 (6.0% of all workers)
Travel time to work (commute)
- Less than 5 minutes: 14
- 5 to 9 minutes: 48
- 10 to 14 minutes: 110
- 15 to 19 minutes: 148
- 20 to 24 minutes: 99
- 25 to 29 minutes: 83
- 30 to 34 minutes: 150
- 35 to 39 minutes: 18
- 40 to 44 minutes: 15
- 45 to 59 minutes: 58
- 60 to 89 minutes: 53
- 90 or more minutes: 35
Means of transportation to work:
- Drove a car alone: 1,764 (78.3%)
- Carpooled: 279 (12.4%)
- Bus: 23 (1.0%)
- Taxi: 22 (1.0%)
- Walked: 41 (1.8%)
- Worked at home: 55 (2.4%)

- Unemployment by race in 2022
- Unemployment rate for Black residents
- 1.0%Males
- 8.9%Females

- Year of entry for the foreign-born population in Mangonia Park, Florida
- 652010 or later
- 1142000 to 2009
- 431990 to 1999
- 851980 to 1989
- 301970 to 1979
- 23Before 1970

First ancestries reported:
- Haitian: 302 (24.3%)
- African: 190 (15.3%)
- Jamaican: 189 (15.2%)
- Italian: 60 (4.8%)
- German: 4 (0.3%)
- Bahamian: 3 (0.2%)
Most common places of birth for foreign-born residents (%):
| Mangonia Park: | 39.7% (136) |
| Florida: | 7.5% (342,375) |
| Mangonia Park: | 35.0% (120) |
| Florida: | 5.0% (227,319) |
| Mangonia Park: | 11.7% (40) |
| Florida: | 2.1% (97,632) |
| Mangonia Park: | 5.5% (19) |
| Florida: | 22.0% (1,006,576) |
| Mangonia Park: | 4.7% (16) |
| Florida: | 0.3% (15,079) |
| Mangonia Park: | 3.5% (12) |
| Florida: | 0.4% (20,008) |
Place of birth for U.S.-born residents:
- This state: 1,203
- Other state: 402
- Northeast: 183
- Midwest: 16
- South: 110
- West: 89
79.0% of Mangonia Park residents lived in the same house 1 years ago.
Out of people who lived in different houses, 46.0% lived in this county.
Out of people who lived in different counties, 82.4% lived in Florida.
| Mangonia Park: | 79.0% |
| State average: | 86.3% |
Education attainment for males 25 years and older:
- No schooling: 9
- Nursery to 4th grade: 7
- 5th and 6th grade: 18
- 7th and 8th grade: 10
- 9th grade: 3
- 10th grade: 25
- 11th grade: 22
- 12th grade, no diploma: 41
- High school graduate (or equivalency): 195
- Less than 1 year of college: 4
- Some college more than 1 year, no degree: 53
- Associate degree: 46
- Bachelor's degree: 14
- Master's degree: 0
- Professional school degree: 0
- Doctorate degree: 0

Education attainment for females 25 years and older:
- No schooling: 16
- Nursery to 4th grade: 8
- 5th and 6th grade: 8
- 7th and 8th grade: 6
- 9th grade: 17
- 10th grade: 23
- 11th grade: 31
- 12th grade, no diploma: 25
- High school graduate (or equivalency): 186
- Less than 1 year of college: 41
- Some college more than 1 year, no degree: 78
- Associate degree: 83
- Bachelor's degree: 111
- Master's degree: 8
- Professional school degree: 0
- Doctorate degree: 0


Housing units in structures:
- One, detached: 209
- One, attached: 61
- Two: 2
- 3 or 4: 251
- 5 to 9: 51
- 10 to 19: 152
- 50 or more: 7
House/condo owner moved in on average 19 years ago
Renter moved in on average 4 years ago

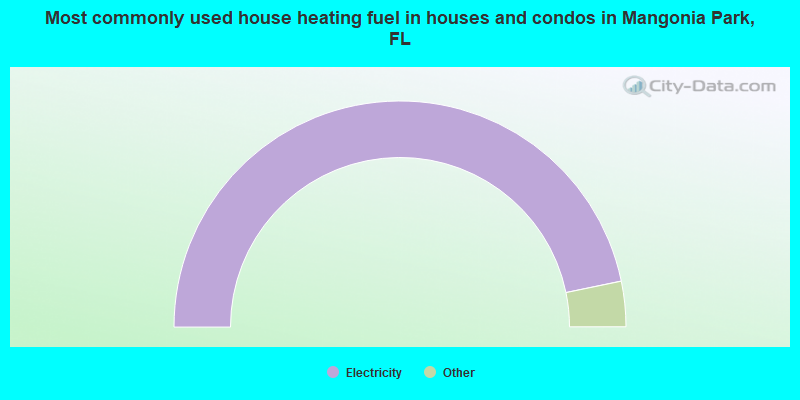
- 93.8%Electricity
- 4.0%No fuel used
- 2.3%Utility gas
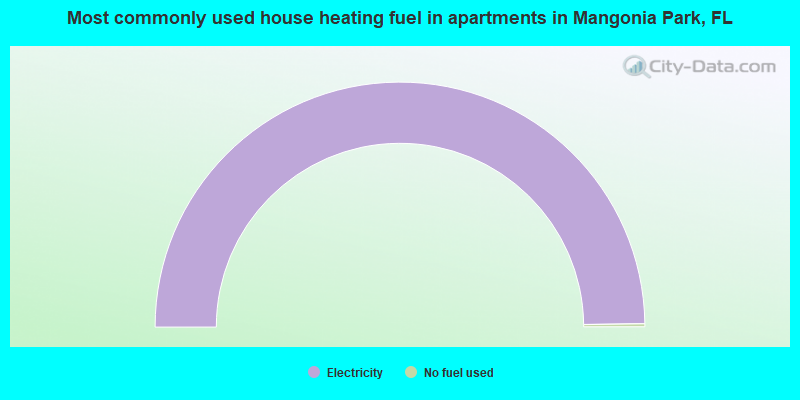
- 99.6%Electricity
- 0.4%No fuel used
Private vs. public school enrollment:
| Here: | 4.4% |
| Florida: | 15.8% |
| Here: | 4.9% |
| Florida: | 12.9% |
| Here: | 19.4% |
| Florida: | 23.6% |


