Manning, SC (South Carolina) Houses and Residents
| Manning: | $162,511 |
| South Carolina: | $254,600 |
Mean price in 2022:
Detached houses: $157,795
Here: $157,795 State: $368,255
Total population: 4,059 (Urban population: 3,960 (all inside urban clusters), Rural population: 31 (all nonfarm))
Houses: 1,997 (1,807 occupied: 974 owner occupied, 867 renter occupied)
| % of renters here: | 47% |
| State: | 28% |
Housing density: 829 houses/condos per square mile
Median price asked for vacant for-sale houses and condos in 2022 in this county: $111,399.
Median contract rent in 2022: $364 (lower quartile is $241, upper quartile is $626)
Median rent asked for vacant for-rent units in 2022: $483
Median gross rent in Manning, SC in 2022: $598
Housing units in Manning with a mortgage: 455 (10 second mortgage, 0 home equity loan, 0 both second mortgage and home equity loan)
Houses without a mortgage: 0
Median household income for houses/condos with a mortgage: $55,158
Median household income for apartments without a mortgage: $42,084
Median monthly housing costs: $620
Compare current foreclosures in Manning, SC:
| Photo | Address | Area | Beds / Baths | Price | Details |
|---|---|---|---|---|---|

|
#1
Raccoon Rd
Manning, SC 29102
|
- sq. feet
|
2 baths 3 beds |
show details | |

|
#2
Leo Rd # 9
Manning, SC 29102
|
- sq. feet
|
- baths - beds |
show details | |

|
#3
George Conyers Rd
Manning, SC 29102
|
- sq. feet
|
- baths - beds |
show details | |

|
#4
Summerford Ln
Manning, SC 29102
|
- sq. feet
|
- baths - beds |
show details | |

|
#5
Briarcliff St
Manning, SC 29102
|
- sq. feet
|
- baths - beds |
show details | |

|
#6
Celissia Rd
Manning, SC 29102
|
- sq. feet
|
- baths - beds |
show details | |

|
#7
Lemon Ave
Manning, SC 29102
|
- sq. feet
|
- baths - beds |
show details | |

|
#8
Waynes Dr
Manning, SC 29102
|
- sq. feet
|
- baths - beds |
show details | |

|
#9
Kingstree Hwy
Manning, SC 29102
|
1,108 sq. feet
|
- baths - beds |
show details | |

|
#10
N Lee St
Manning, SC 29102
|
- sq. feet
|
- baths - beds |
show details |
| Photo | Address | Area | Beds / Baths | Price | Details |
|---|---|---|---|---|---|

|
#11
Sumter Ct
Manning, SC 29102
|
- sq. feet
|
- baths - beds |
show details | |

|
#12
Pinewood Hwy
Manning, SC 29102
|
- sq. feet
|
- baths - beds |
show details | |

|
#13
A M Nash Rd, Camper
Manning, SC 29102
|
- sq. feet
|
- baths - beds |
show details | |

|
#14
Manchester Dr
Manning, SC 29102
|
2,366 sq. feet
|
- baths - beds |
show details | |

|
#15
Bradham Rd
Manning, SC 29102
|
- sq. feet
|
- baths - beds |
show details | |

|
#16
Fairfield Rd
Manning, SC 29102
|
- sq. feet
|
- baths - beds |
show details | |

|
#17
Warrens Way
Manning, SC 29102
|
- sq. feet
|
- baths - beds |
show details | |

|
#18
E South St Apt 19
Manning, SC 29102
|
- sq. feet
|
- baths - beds |
show details | |

|
#19
Dudie Ct
Manning, SC 29102
|
- sq. feet
|
- baths - beds |
show details | |

|
#20
N Brooks St
Manning, SC 29102
|
- sq. feet
|
- baths - beds |
show details |
| Photo | Address | Area | Beds / Baths | Price | Details |
|---|---|---|---|---|---|

|
#21
Bump Rd
Manning, SC 29102
|
- sq. feet
|
- baths - beds |
show details | |

|
#22
Jessamine Way
Manning, SC 29102
|
- sq. feet
|
- baths - beds |
show details | |

|
#23
Bloomville Rd
Manning, SC 29102
|
- sq. feet
|
- baths - beds |
show details | |

|
#24
Jerro Rd
Manning, SC 29102
|
- sq. feet
|
- baths - beds |
show details | |

|
#25
Collins St
Manning, SC 29102
|
- sq. feet
|
- baths - beds |
show details | |

|
#26
Foxbrook Ln
Manning, SC 29102
|
- sq. feet
|
- baths - beds |
show details | |

|
#27
Ethan Stone Rd
Manning, SC 29102
|
- sq. feet
|
- baths - beds |
show details | |

|
#28
Silver Rd
Manning, SC 29102
|
- sq. feet
|
- baths - beds |
show details | |

|
#29
Hideout Dr
Manning, SC 29102
|
- sq. feet
|
- baths - beds |
show details | |

|
#30
Summerton Hwy
Manning, SC 29102
|
- sq. feet
|
- baths - beds |
show details |
| Photo | Address | Area | Beds / Baths | Price | Details |
|---|---|---|---|---|---|

|
#31
Sunset Dr
Manning, SC 29102
|
- sq. feet
|
- baths - beds |
show details | |

|
#32
Toccoa Dr
Manning, SC 29102
|
- sq. feet
|
- baths - beds |
show details | |

|
#33
Old Georgetown Rd
Manning, SC 29102
|
- sq. feet
|
- baths - beds |
show details | |

|
#34
Fireglow St
Manning, SC 29102
|
- sq. feet
|
- baths - beds |
show details | |

|
#35
Mcdowell St
Manning, SC 29102
|
- sq. feet
|
- baths - beds |
show details | |

|
#36
Shadewater Way
Manning, SC 29102
|
- sq. feet
|
- baths - beds |
show details | |

|
#37
N Brewington Rd
Manning, SC 29102
|
- sq. feet
|
- baths - beds |
show details | |

|
Check over 1 million property listings on Foreclosure.com!
|
browse all offers | |||

Latest news about housing in Manning, SC collected exclusively by city-data.com from local newspapers, TV, and radio stations

 | Low Country Rural Real Estate and Living (29 replies) |
| What's New or Coming To Sumter (2753 replies) |
| Small town rentals and NO time to visit (7 replies) |
| Wealthiest or most prosperous rural areas of SC? (25 replies) |
| Flood Insurance - Home Not Insurable? (35 replies) |
| Columbia - general (5183 replies) |

Median year apartment built: 1987
Household type by relationship:
Households: 3,967- Male householders: 580 (192 living alone), Female householders: 1,212 (630 living alone)
573 spouses (573 opposite-sex spouses), 0 unmarried partners, (0 opposite-sex unmarried partners), 774 children (767 natural, 0 adopted, 7 stepchildren), 430 grandchildren, 36 brothers or sisters, 14 parents, 0 foster children, 82 other relatives, 184 non-relatives
- In group quarters: 78
Size of family households: 599 2-persons, 229 3-persons, 67 4-persons, 14 5-persons, 79 6-persons, 11 7-or-more-persons.
Size of nonfamily households: 836 1-person, 13 5-persons.
211 married couples with children.
169 single-parent households (21 men, 148 women).
99.5% of residents of Manning speak English at home.
0.3% of residents speak Spanish at home (100% speak English not well).
0.6% of residents speak other Indo-European language at home (100% speak English very well).
0.3% of residents speak other language at home (100% speak English very well).
Foreign born population: 110 (2.8%)
(45.5% of them are naturalized citizens)
| Here: | 6.6 |
| State: | 6.4 |
| Here: | 4.1 |
| State: | 4.5 |

- Bedrooms in owner-occupied houses and condos in Manning, South Carolina
- 0no bedroom
- 01 bedroom
- 1012 bedrooms
- 6133 bedrooms
- 2424 bedrooms
- 185+ bedrooms

- Bedrooms in renter-occupied apartments in Manning, South Carolina
- 49no bedroom
- 3761 bedroom
- 1942 bedrooms
- 2313 bedrooms
- 184 bedrooms
- 05+ bedrooms

- Cars and other vehicles available in Manning in owner-occupied houses/condos
- 60no vehicle
- 3631 vehicle
- 4132 vehicles
- 693 vehicles
- 224 vehicles
- 485+ vehicles

- Cars and other vehicles available in Manning in renter-occupied apartments
- 418no vehicle
- 3291 vehicle
- 1202 vehicles
- 03 vehicles
- 04 vehicles
- 05+ vehicles

- Rooms in owner-occupied houses in Manning, South Carolina
- 01 room
- 02 rooms
- 03 rooms
- 184 rooms
- 2485 rooms
- 1736 rooms
- 3777 rooms
- 1068 rooms
- 539+ rooms

- Rooms in renter-occupied apartments in Manning, South Carolina
- 491 room
- 292 rooms
- 2723 rooms
- 1524 rooms
- 1175 rooms
- 1846 rooms
- 227 rooms
- 218 rooms
- 229+ rooms


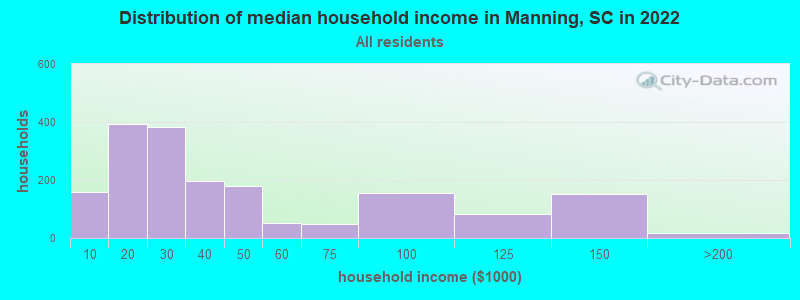
Manning, SC household income distribution

- 160Less than $10,000
- 394$10,000 to $19,999
- 384$20,000 to $29,999
- 196$30,000 to $39,999
- 181$40,000 to $49,999
- 53$50,000 to $59,999
- 50$60,000 to $74,999
- 154$75,000 to $99,999
- 82$100,000 to $124,999
- 153$125,000 to $149,999
- 16$150,000 to $199,999
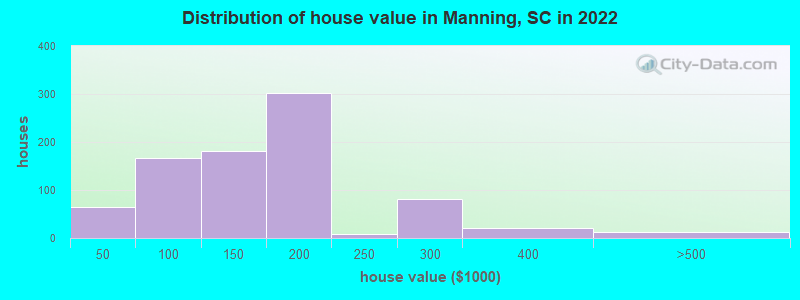
Home value of owner - occupied houses in 2022 in Manning, SC
-
- 22$15,000 to $19,999
- 32$20,000 to $24,999
- 9$40,000 to $49,999
- 47$50,000 to $59,999
- 12$60,000 to $69,999
- 10$70,000 to $79,999
- 40$80,000 to $89,999
- 46$90,000 to $99,999
- 131$100,000 to $124,999
- 50$125,000 to $149,999
- 229$150,000 to $174,999
- 73$175,000 to $199,999
- 8$200,000 to $249,999
- 80$250,000 to $299,999
- 21$300,000 to $399,999
- 13$400,000 to $499,999
Rent paid by renters in 2022 in Manning, SC
-
- 5Less than $100
- 60$100 to $149
- 41$150 to $199
- 124$200 to $249
- 111$300 to $349
- 51$400 to $449
- 20$450 to $499
- 41$500 to $549
- 54$550 to $599
- 62$600 to $649
- 30$650 to $699
- 33$700 to $749
- 13$750 to $799
- 40$800 to $899
- 76No cash rent


Percentage of workers working in this county: 58.6%
Number of people working at home: 94 (7.9% of all workers)
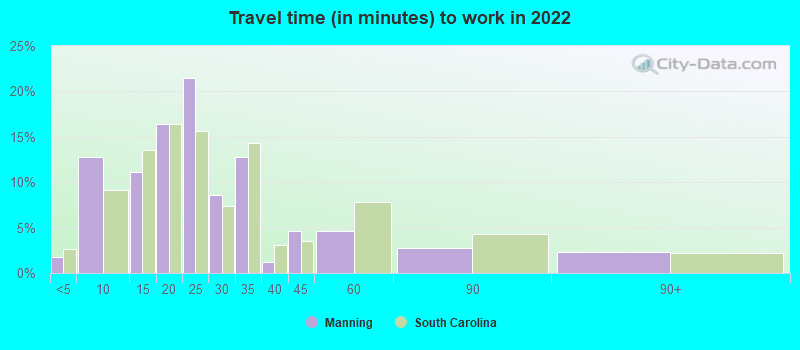
Travel time to work (commute)
- Less than 5 minutes: 30
- 5 to 9 minutes: 160
- 10 to 14 minutes: 93
- 15 to 19 minutes: 192
- 20 to 24 minutes: 119
- 25 to 29 minutes: 23
- 30 to 34 minutes: 197
- 35 to 39 minutes: 19
- 40 to 44 minutes: 0
- 45 to 59 minutes: 184
- 60 to 89 minutes: 65
- 90 or more minutes: 0
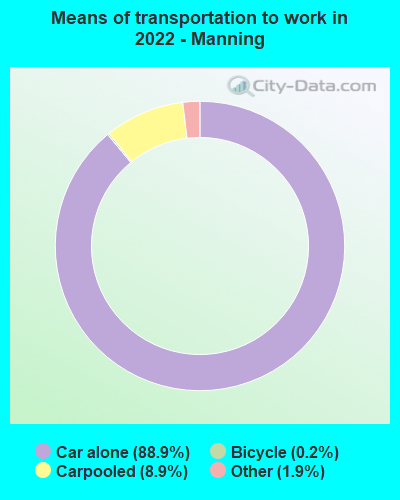
Means of transportation to work:
- Drove a car alone: 2,591 (83.7%)
- Carpooled: 271 (8.8%)
- Taxi: 62 (2.0%)
- Bicycle: 6 (0.2%)
- Walked: 1 (0.0%)
- Worked at home: 94 (3.0%)

- Unemployment by race in 2022
- Unemployment rate for White non-Hispanic residents
- 13.8%Males
- 9.7%Females
- Unemployment rate for Black residents
- 7.9%Males

- Year of entry for the foreign-born population in Manning, South Carolina
- 452010 or later
- 132000 to 2009
- 91990 to 1999
- 291980 to 1989
- 01970 to 1979
- 8Before 1970

First ancestries reported:
- American: 335 (14.8%)
- English: 83 (3.7%)
- Irish: 66 (2.9%)
- Jamaican: 52 (2.3%)
- German: 47 (2.1%)
- Scotch-Irish: 43 (1.9%)
- African: 12 (0.5%)
- Italian: 10 (0.4%)
- Scottish: 10 (0.4%)
Most common places of birth for foreign-born residents (%):
| Manning: | 40.9% (45) |
| South Carolina: | 2.6% (7,073) |
| Manning: | 22.7% (25) |
| South Carolina: | 22.5% (60,774) |
| Manning: | 10.0% (11) |
| South Carolina: | 6.8% (18,307) |
| Manning: | 9.1% (10) |
| South Carolina: | 0.3% (876) |
| Manning: | 7.3% (8) |
| South Carolina: | 1.9% (5,117) |
| Manning: | 3.6% (4) |
| South Carolina: | 0.2% (445) |
Place of birth for U.S.-born residents:
- This state: 2,791
- Other state: 949
- Northeast: 306
- Midwest: 203
- South: 436
- West: 0
84.3% of Manning residents lived in the same house 1 years ago.
Out of people who lived in different houses, 40.6% lived in this county.
Out of people who lived in different counties, 36.5% lived in South Carolina.
| Manning: | 84.3% |
| State average: | 86.5% |
Education attainment for males 25 years and older:
- No schooling: 17
- Nursery to 4th grade: 6
- 5th and 6th grade: 0
- 7th and 8th grade: 27
- 9th grade: 67
- 10th grade: 34
- 11th grade: 55
- 12th grade, no diploma: 29
- High school graduate (or equivalency): 576
- Less than 1 year of college: 9
- Some college more than 1 year, no degree: 143
- Associate degree: 51
- Bachelor's degree: 151
- Master's degree: 135
- Professional school degree: 0
- Doctorate degree: 18

Education attainment for females 25 years and older:
- No schooling: 48
- Nursery to 4th grade: 0
- 5th and 6th grade: 0
- 7th and 8th grade: 76
- 9th grade: 30
- 10th grade: 118
- 11th grade: 53
- 12th grade, no diploma: 27
- High school graduate (or equivalency): 589
- Less than 1 year of college: 113
- Some college more than 1 year, no degree: 243
- Associate degree: 118
- Bachelor's degree: 209
- Master's degree: 75
- Professional school degree: 0
- Doctorate degree: 0


Housing units in structures:
- One, detached: 1,469
- One, attached: 35
- Two: 84
- 3 or 4: 82
- 5 to 9: 87
- 10 to 19: 8
- 20 to 49: 121
- 50 or more: 87
- Boats, RVs, vans, etc.: 21
Housing units lacking complete kitchen facilities in 2022: 2.3%
House/condo owner moved in on average 13 years ago
Renter moved in on average 4 years ago

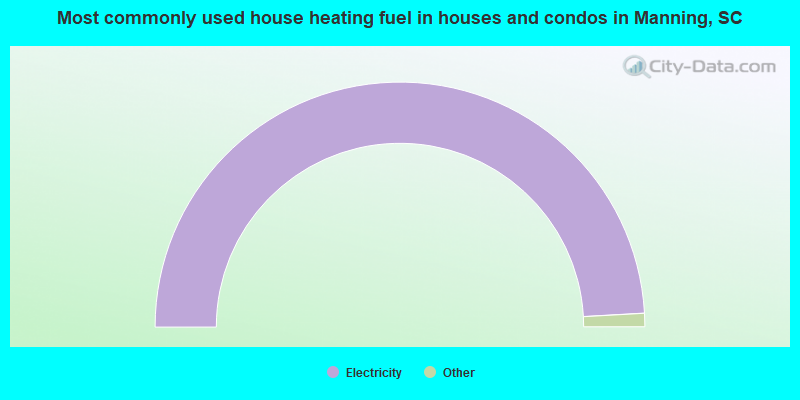
- 98.3%Electricity
- 1.5%No fuel used
- 0.2%Bottled, tank, or LP gas
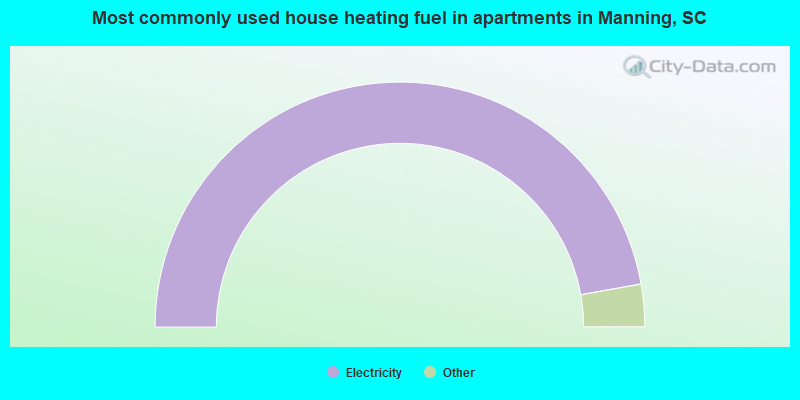
- 94.4%Electricity
- 2.6%Bottled, tank, or LP gas
- 2.2%No fuel used
- 0.9%Utility gas
Private vs. public school enrollment:
| Here: | 15.6% |
| South Carolina: | 14.4% |
| Here: | 26.5% |
| South Carolina: | 11.1% |
| Here: | 0.0% |
| South Carolina: | 21.9% |


