Mansfield, OH (Ohio) Houses and Residents
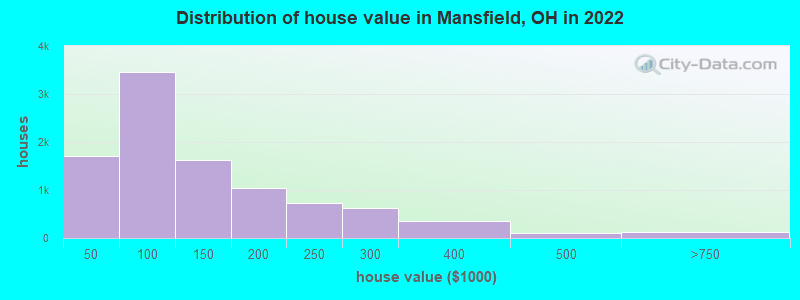
Estimated median house or condo value in 2022: $104,572 (it was $71,700 in 2000 )
Mansfield:
$104,572Ohio:
$204,100
Lower value quartile - upper value quartile: $57,686 - $177,487Mean price in 2022: Detached houses: $142,087 Here:
$142,087State:
$254,366
Townhouses or other attached units: $275,769 Here:
$275,769State:
$225,733
In 2-unit structures: $119,977 Here:
$119,977State:
$144,384
In 3-to-4-unit structures: $184,937 Here:
$184,937State:
$203,002
In 5-or-more-unit structures: $164,595 Here:
$164,595State:
$211,593
Mobile homes: $47,013 Here:
$47,013State:
$62,719
Total population: 46,824 (All urban)
Houses: 21,431 (18,927 occupied: 9,588 owner occupied, 9,529 renter occupied )
% of renters here:
50%State:
33%
Housing density: 717 houses/condos per square mile
Median price asked for vacant for-sale houses and condos in 2022: $69,204.
Median contract rent in 2022: $625 (lower quartile is $451, upper quartile is $717)
Median rent asked for vacant for-rent units in 2022: $453
Median gross rent in Mansfield, OH in 2022: $738
Housing units in Mansfield with a mortgage: 4,775 (203 second mortgage, 26 home equity loan, 174 both second mortgage and home equity loan )Houses without a mortgage: 319
Median household income for houses/condos with a mortgage: $66,897
Median household income for apartments without a mortgage: $41,994
Median monthly housing costs: $676
Data:
Median house or condo value ($)
Median house or condo value ($ change since 2000)
Median house or condo value ($) - White
Median house or condo value ($) - Black or African American
Median house or condo value ($) - Asian
Median house or condo value ($) - Hispanic or Latino
Median house or condo value ($) - American Indian and Alaska Native
Median house or condo value ($) - Multirace
Median house or condo value ($) - Other Race
Median price asked for mobile homes ($)
Household density (households per square mile)
Mean house or condo value by units in structure - 1, detached ($)
Mean house or condo value by units in structure - 1, attached ($)
Mean house or condo value by units in structure - 2 ($)
Mean house or condo value by units in structure by units in structure - 3 or 4 ($)
Mean house or condo value by units in structure - 5 or more ($)
Mean house or condo value by units in structure - Boat, RV, van, etc. ($)
Mean house or condo value by units in structure - Mobile home ($)
Median contract rent ($)
Median contract rent - Lower quartile ($)
Median contract rent - Upper quartile ($)
Median gross rent ($)
Urban houses (%)
Rural houses (%)
Houses occupied (%)
Houses occupied (% change since 2000)
Houses owner occupied (%)
Houses owner occupied (% change since 2000)
Houses renter occupied (%)
Houses renter occupied (% change since 2000)
Vacant housing units - For rent (%)
Vacant housing units - For rent (% change since 2000)
Vacant housing units - For sale only (%)
Vacant housing units - For sale only (% change since 2000)
Vacant housing units - Rented or sold, not occupied (%)
Vacant housing units - Rented or sold, not occupied (% change since 2000)
Vacant housing units - For seasonal, recreational, or occasional use (%)
Vacant housing units - For seasonal, recreational, or occasional use (% change since 2000)
Vacant housing units - For migrant workers (%)
Vacant housing units - For migrant workers (% change since 2000)
Vacant housing units - Other vacant (%)
Vacant housing units - Other vacant (% change since 2000)
Median monthly housing costs ($)
Median household income for houses/condos with a mortgage ($)
Median household income for houses/condos without a mortgage ($)
Median household income ($)
Median household income ($) - White
Median household income ($) - Black or African American
Median household income ($) - Asian
Median household income ($) - Hispanic or Latino
Median household income ($) - American Indian and Alaska Native
Median household income ($) - Multirace
Median household income ($) - Other Race
Mortgage status - with mortgage (%)
Mortgage status - with second mortgage (%)
Mortgage status - with home equity loan (%)
Mortgage status - with both second mortgage and home equity loan (%)
Mortgage status - without a mortgage (%)
Median year house/condo built
Median year apartment built
Household type by relationship - Male householder living alone (%)
Household type by relationship - Male householder not living alone (%)
Household type by relationship - Female householder living alone (%)
Household type by relationship - Female householder not living alone (%)
Household type by relationship - Opposite-Sex spouse (%)
Household type by relationship - Same-Sex spouse (%)
Household type by relationship - Opposite-Sex unmarried partner (%)
Household type by relationship - Same-Sex unmarried partner (%)
Household type by relationship - In group quarters (%)
Size of family households - 2-person household (%)
Size of family households - 3-person household (%)
Size of family households - 4-person household (%)
Size of family households - 5-person household (%)
Size of family households - 6-person household (%)
Size of family households - 7-or-more-person household (%)
Size of nonfamily households - 1-person household (%)
Size of nonfamily households - 2-person household (%)
Size of nonfamily households - 3-person household (%)
Size of nonfamily households - 4-person household (%)
Size of nonfamily households - 5-person household (%)
Size of nonfamily households - 6-person household (%)
Size of nonfamily households - 7-or-moreperson household (%)
Year house built - Built 2010 or later (%)
Year house built - Built 2000 to 2009 (%)
Year house built - Built 1990 to 1999 (%)
Year house built - Built 1980 to 1989 (%)
Year house built - Built 1970 to 1979 (%)
Year house built - Built 1960 to 1969 (%)
Year house built - Built 1950 to 1959 (%)
Year house built - Built 1940 to 1949 (%)
Year house built - Built 1939 or earlier (%)
Median number of rooms in houses and condos
Median number of rooms in apartments
Median number of bedrooms in owner occupied houses
Mean number of bedrooms in owner occupied houses
Median number of bedrooms in renter occupied houses
Mean number of bedrooms in renter occupied houses
Median number of vehichles in owner occupied houses
Mean number of vehichles in owner occupied houses
Median number of vehichles in renter occupied houses
Mean number of vehichles in renter occupied houses
Rooms in owner-occupied houses - 1 room (%)
Rooms in owner-occupied houses - 2 rooms (%)
Rooms in owner-occupied houses - 3 rooms (%)
Rooms in owner-occupied houses - 4 rooms (%)
Rooms in owner-occupied houses - 5 rooms (%)
Rooms in owner-occupied houses - 6 rooms (%)
Rooms in owner-occupied houses - 7 rooms (%)
Rooms in owner-occupied houses - 8 rooms (%)
Rooms in owner-occupied houses - 9+ rooms (%)
Rooms in renter-occupied houses - 1 room (%)
Rooms in renter-occupied houses - 2 rooms (%)
Rooms in renter-occupied houses - 3 rooms (%)
Rooms in renter-occupied houses - 4 rooms (%)
Rooms in renter-occupied houses - 5 rooms (%)
Rooms in renter-occupied houses - 6 rooms (%)
Rooms in renter-occupied houses - 7 rooms (%)
Rooms in renter-occupied houses - 8 rooms (%)
Rooms in renter-occupied houses - 9+ rooms (%)
Bedrooms in owner-occupied houses - no bedrooms (%)
Bedrooms in owner-occupied houses - 1 bedroom (%)
Bedrooms in owner-occupied houses - 2 bedrooms (%)
Bedrooms in owner-occupied houses - 3 bedrooms (%)
Bedrooms in owner-occupied houses - 4 bedrooms (%)
Bedrooms in owner-occupied houses - 5+ bedrooms (%)
Bedrooms in renter-occupied houses - no bedrooms (%)
Bedrooms in renter-occupied houses - 1 bedroom (%)
Bedrooms in renter-occupied houses - 2 bedrooms (%)
Bedrooms in renter-occupied houses - 3 bedrooms (%)
Bedrooms in renter-occupied houses - 4 bedrooms (%)
Bedrooms in renter-occupied houses - 5+ bedrooms (%)
Vehicles available in owner-occupied houses - no vehicle available (%)
Vehicles available in owner-occupied houses - 1 vehicle available(%)
Vehicles available in owner-occupied houses - 2 Vehicles available (%)
Vehicles available in owner-occupied houses - 3 Vehicles available (%)
Vehicles available in owner-occupied houses - 4 Vehicles available (%)
Vehicles available in owner-occupied houses - 5+ Vehicles available (%)
Vehicles available in renter-occupied houses - no vehicle available (%)
Vehicles available in renter-occupied houses - 1 vehicle available (%)
Vehicles available in renter-occupied houses - 2 Vehicles available (%)
Vehicles available in renter-occupied houses - 3 Vehicles available (%)
Vehicles available in renter-occupied houses - 4 Vehicles available (%)
Vehicles available in renter-occupied houses - 5+ Vehicles available (%)
Housing units in structures - 1, detached (%)
Housing units in structures - 1, attached (%)
Housing units in structures - 2 (%)
Housing units in structures - 3 or 4 (%)
Housing units in structures - 5 to 9 (%)
Housing units in structures - 10 to 19 (%)
Housing units in structures - 20 to 49 (%)
Housing units in structures - 50 or more (%)
Housing units in structures - Mobile home (%)
Housing units in structures - Boat, RV, van, etc. (%)
Housing units in structures - Owners - 1, detached (%)
Housing units in structures - Owners - 1, attached (%)
Housing units in structures - Owners - 2 (%)
Housing units in structures - Owners - 3 or 4 (%)
Housing units in structures - Owners - 5 to 9 (%)
Housing units in structures - Owners - 10 to 19 (%)
Housing units in structures - Owners - 20 to 49 (%)
Housing units in structures - Owners - 50 or more (%)
Housing units in structures - Owners - Mobile home (%)
Housing units in structures - Owners - Boat, RV, van, etc. (%)
Housing units in structures - Renters - 1, detached (%)
Housing units in structures - Renters - 1, attached (%)
Housing units in structures - Renters - 2 (%)
Housing units in structures - Renters - 3 or 4 (%)
Housing units in structures - Renters - 5 to 9 (%)
Housing units in structures - Renters - 10 to 19 (%)
Housing units in structures - Renters - 20 to 49 (%)
Housing units in structures - Renters - 50 or more (%)
Housing units in structures - Renters - Mobile home (%)
Housing units in structures - Renters - Boat, RV, van, etc. (%)
House/condo owner moved in on average (years ago)
Renter moved in on average (years ago)
Year householder moved into unit - Moved in 1999 to March 2000 (%)
Year householder moved into unit - Moved in 1999 to March 2000 (%) - White
Year householder moved into unit - Moved in 1999 to March 2000 (%) - Black or African American
Year householder moved into unit - Moved in 1999 to March 2000 (%) - Asian
Year householder moved into unit - Moved in 1999 to March 2000 (%) - Hispanic or Latino
Year householder moved into unit - Moved in 1999 to March 2000 (%) - American Indian and Alaska Native
Year householder moved into unit - Moved in 1999 to March 2000 (%) - Multirace
Year householder moved into unit - Moved in 1999 to March 2000 (%) - Other Race
Year householder moved into unit - Moved in 1995 to 1998 (%)
Year householder moved into unit - Moved in 1995 to 1998 (%) - White
Year householder moved into unit - Moved in 1995 to 1998 (%) - Black or African American
Year householder moved into unit - Moved in 1995 to 1998 (%) - Asian
Year householder moved into unit - Moved in 1995 to 1998 (%) - Hispanic or Latino
Year householder moved into unit - Moved in 1995 to 1998 (%) - American Indian and Alaska Native
Year householder moved into unit - Moved in 1995 to 1998 (%) - Multirace
Year householder moved into unit - Moved in 1995 to 1998 (%) - Other Race
Year householder moved into unit - Moved in 1990 to 1994 (%)
Year householder moved into unit - Moved in 1990 to 1994 (%) - White
Year householder moved into unit - Moved in 1990 to 1994 (%) - Black or African American
Year householder moved into unit - Moved in 1990 to 1994 (%) - Asian
Year householder moved into unit - Moved in 1990 to 1994 (%) - Hispanic or Latino
Year householder moved into unit - Moved in 1990 to 1994 (%) - American Indian and Alaska Native
Year householder moved into unit - Moved in 1990 to 1994 (%) - Multirace
Year householder moved into unit - Moved in 1990 to 1994 (%) - Other Race
Year householder moved into unit - Moved in 1980 to 1989 (%)
Year householder moved into unit - Moved in 1980 to 1989 (%) - White
Year householder moved into unit - Moved in 1980 to 1989 (%) - Black or African American
Year householder moved into unit - Moved in 1980 to 1989 (%) - Asian
Year householder moved into unit - Moved in 1980 to 1989 (%) - Hispanic or Latino
Year householder moved into unit - Moved in 1980 to 1989 (%) - American Indian and Alaska Native
Year householder moved into unit - Moved in 1980 to 1989 (%) - Multirace
Year householder moved into unit - Moved in 1980 to 1989 (%) - Other Race
Year householder moved into unit - Moved in 1970 to 1979 (%)
Year householder moved into unit - Moved in 1970 to 1979 (%) - White
Year householder moved into unit - Moved in 1970 to 1979 (%) - Black or African American
Year householder moved into unit - Moved in 1970 to 1979 (%) - Asian
Year householder moved into unit - Moved in 1970 to 1979 (%) - Hispanic or Latino
Year householder moved into unit - Moved in 1970 to 1979 (%) - American Indian and Alaska Native
Year householder moved into unit - Moved in 1970 to 1979 (%) - Multirace
Year householder moved into unit - Moved in 1970 to 1979 (%) - Other Race
Year householder moved into unit - Moved in 1969 or earlier (%)
Year householder moved into unit - Moved in 1969 or earlier (%) - White
Year householder moved into unit - Moved in 1969 or earlier (%) - Black or African American
Year householder moved into unit - Moved in 1969 or earlier (%) - Asian
Year householder moved into unit - Moved in 1969 or earlier (%) - Hispanic or Latino
Year householder moved into unit - Moved in 1969 or earlier (%) - American Indian and Alaska Native
Year householder moved into unit - Moved in 1969 or earlier (%) - Multirace
Year householder moved into unit - Moved in 1969 or earlier (%) - Other Race
Housing units lacking complete plumbing facilities (%)
Housing units lacking complete kitchen facilities (%)
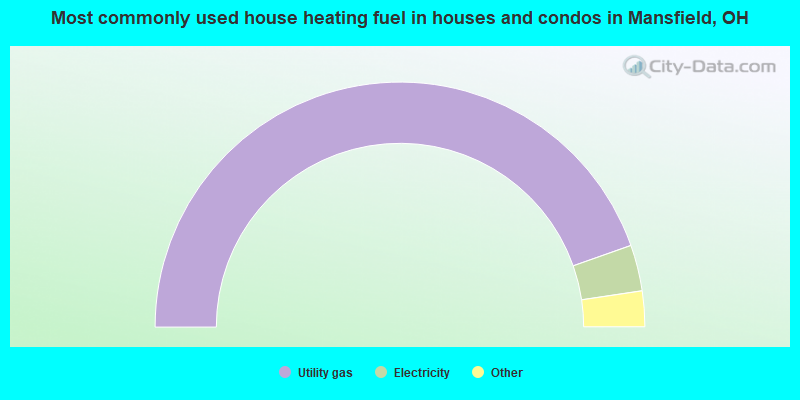
House heating fuel used in houses and condos - Utility gas (%)
House heating fuel used in houses and condos - Bottled, tank, or LP gas (%)
House heating fuel used in houses and condos - Electricity (%)
House heating fuel used in houses and condos - Fuel oil, kerosene, etc. (%)
House heating fuel used in houses and condos - Coal or coke (%)
House heating fuel used in houses and condos - Wood (%)
House heating fuel used in houses and condos - Solar energy (%)
House heating fuel used in houses and condos - Other fuel (%)
House heating fuel used in houses and condos - No fuel used (%)
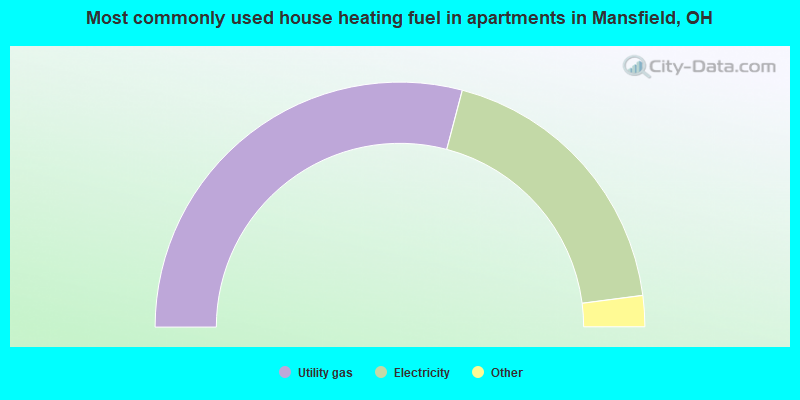
House heating fuel used in apartments - Utility gas (%)
House heating fuel used in apartments - Bottled, tank, or LP gas (%)
House heating fuel used in apartments - Electricity (%)
House heating fuel used in apartments - Fuel oil, kerosene, etc. (%)
House heating fuel used in apartments - Coal or coke (%)
House heating fuel used in apartments - Wood (%)
House heating fuel used in apartments - Solar energy (%)
House heating fuel used in apartments - Other fuel (%)
House heating fuel used in apartments - No fuel used (%)
Latest news about housing in Mansfield, OH collected exclusively by city-data.com from local newspapers, TV, and radio stations
Median year house/condo built: 1955Median year apartment built: 1966Household type by relationship:
Households: 47,748
Male householders: 8,360 (3,479 living alone ), Female householders: 10,585 (4,232 living alone )5,466 spouses (5,421 opposite-sex spouses ), 2,053 unmarried partners , (1,945 opposite-sex unmarried partners ), 11,362 children (10,672 natural , 255 adopted , 434 stepchildren ), 1,286 grandchildren , 393 brothers or sisters , 446 parents , 46 foster children , 515 other relatives , 1,270 non-relatives In group quarters: 5,962
Size of family households: 4,504 2-persons , 1,925 3-persons , 1,196 4-persons , 546 5-persons , 429 6-persons , 168 7-or-more-persons .
Size of nonfamily households: 8,982 1-person , 1,559 2-persons , 80 3-persons , 28 4-persons , 12 6-persons .
3,139 married couples with children. single-parent households (775 men , 4,154 women ).
95.5% of residents of Mansfield speak English at home. of residents speak Spanish at home (55% speak English very well , 21% speak English well , 18% speak English not well , 6% don't speak English at all ).of residents speak other Indo-European language at home (68% speak English very well , 22% speak English well , 9% speak English not well ).of residents speak Asian or Pacific Island language at home (59% speak English very well , 34% speak English well , 8% speak English not well ).of residents speak other language at home (83% speak English very well , 17% speak English well ).
Foreign born population: 564 (1.2%)of them are naturalized citizens )
Median number of rooms in houses and condos:
Median number of rooms in apartments
Owner-occupied Renter-occupied
Rooms in owner-occupied houses in Mansfield, Ohio
0 1 room 8 2 rooms 153 3 rooms 1,176 4 rooms 1,841 5 rooms 2,282 6 rooms 1,450 7 rooms 1,128 8 rooms 1,551 9+ rooms
Rooms in renter-occupied apartments in Mansfield, Ohio
269 1 room 474 2 rooms 1,311 3 rooms 2,247 4 rooms 2,519 5 rooms 1,272 6 rooms 661 7 rooms 338 8 rooms 439 9+ rooms
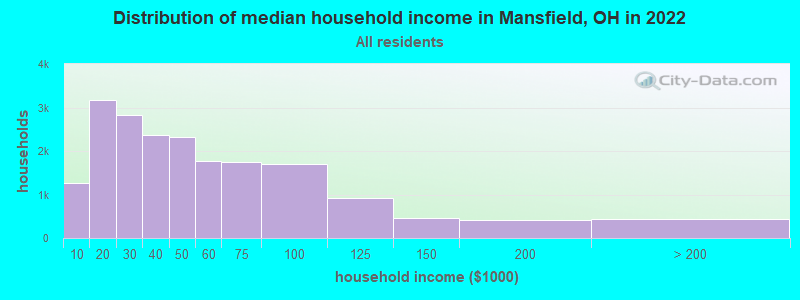
Mansfield, OH household income distribution 1,260 Less than $10,0003,168 $10,000 to $19,9992,824 $20,000 to $29,9992,363 $30,000 to $39,9992,333 $40,000 to $49,9991,772 $50,000 to $59,9991,754 $60,000 to $74,9991,711 $75,000 to $99,999923 $100,000 to $124,999462 $125,000 to $149,999406 $150,000 to $199,999431 $200,000 or more
Home value of owner - occupied houses in 2022 in Mansfield, OH 212 Less than $10,000158 $10,000 to $14,999149 $15,000 to $19,999238 $20,000 to $24,999114 $25,000 to $29,999266 $30,000 to $34,999197 $35,000 to $39,999367 $40,000 to $49,999395 $50,000 to $59,999751 $60,000 to $69,999925 $70,000 to $79,999493 $80,000 to $89,999515 $90,000 to $99,9991,012 $100,000 to $124,999602 $125,000 to $149,999596 $150,000 to $174,999441 $175,000 to $199,999739 $200,000 to $249,999621 $250,000 to $299,999356 $300,000 to $399,999103 $400,000 to $499,99975 $500,000 to $749,99915 $1,000,000 to $1,499,99938 $2,000,000 or moreRent paid by renters in 2022 in Mansfield, OH 81 Less than $10060 $100 to $14986 $150 to $199537 $200 to $24990 $250 to $299512 $300 to $349286 $350 to $399783 $400 to $449746 $450 to $499458 $500 to $549582 $550 to $599692 $600 to $6491,568 $650 to $699610 $700 to $7491,098 $750 to $799212 $800 to $899300 $900 to $999114 $1,000 to $1,24978 $1,250 to $1,499103 $1,500 to $1,99947 $2,000 to $2,49949 $2,500 to $2,99939 $3,500 or more327 No cash rent
Percentage of workers working in this county: 83.7%Number of people working at home: 999 (5.7% of all workers )
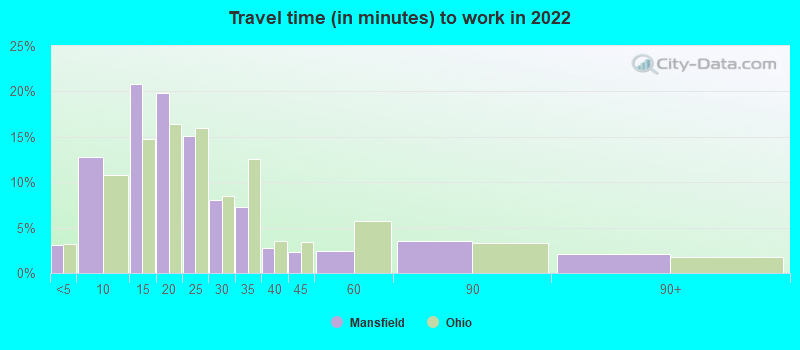
Travel time to work (commute)
Less than 5 minutes: 6565 to 9 minutes: 2,40610 to 14 minutes: 4,73915 to 19 minutes: 3,08920 to 24 minutes: 1,91025 to 29 minutes: 56730 to 34 minutes: 67835 to 39 minutes: 14740 to 44 minutes: 47445 to 59 minutes: 48660 to 89 minutes: 78590 or more minutes: 359
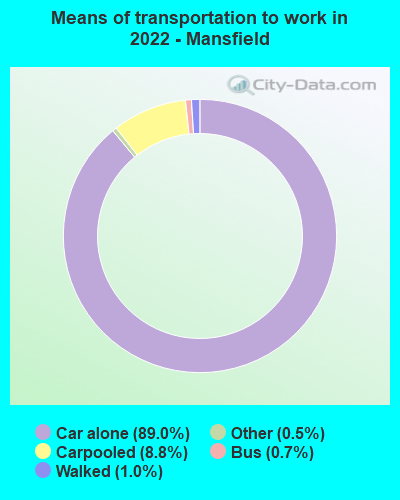
Means of transportation to work:
Drove a car alone: 23,402 (82.9%)Carpooled: 2,481 (8.8%)Bus : 161 (0.6%)Taxi: 164 (0.6%)Bicycle: 12 (0.0%)Walked: 251 (0.9%)Worked at home: 999 (3.5%)
Unemployment by race in 2022
Unemployment rate for White non-Hispanic residents 7.0% Males5.4% FemalesUnemployment rate for Black residents 4.6% Males13.5% FemalesUnemployment rate for American Indian and Alaska Native residents 100.0% FemalesUnemployment rate for two or more race residents 8.5% Males5.9% FemalesUnemployment rate for Hispanic or Latino residents 15.3% Females
Year of entry for the foreign-born population in Mansfield, Ohio
194 2010 or later 158 2000 to 2009 118 1990 to 1999 183 1980 to 1989 171 1970 to 1979 539 Before 1970
First ancestries reported:
German: 3,007 (14.6%)
American: 1,820 (8.9%)
English: 1,690 (8.2%)
Irish: 1,168 (5.7%)
Italian: 955 (4.7%)
European: 668 (3.3%)
Polish: 300 (1.5%)
African: 208 (1.0%)
French: 183 (0.9%)
Scotch-Irish: 178 (0.9%)
French Canadian: 143 (0.7%)
Macedonian: 122 (0.6%)
Greek: 108 (0.5%)
Scottish: 96 (0.5%)
Russian: 93 (0.5%)
Lebanese: 91 (0.4%)
Welsh: 78 (0.4%)
Czech: 77 (0.4%)
Czechoslovakian: 77 (0.4%)
Dutch: 64 (0.3%)
Hungarian: 51 (0.2%)
Yugoslavian: 49 (0.2%)
Serbian: 44 (0.2%)
Slovak: 39 (0.2%)
British: 37 (0.2%)
Austrian: 32 (0.2%)
Scandinavian: 27 (0.1%)
Arab: 18 (0.09%)
Jamaican: 17 (0.08%)
Finnish: 16 (0.08%)
Swiss: 16 (0.08%)
Norwegian: 15 (0.07%)
Haitian: 14 (0.07%)
Latvian: 12 (0.06%)
Belgian: 10 (0.05%)
Pennsylvania German: 8 (0.04%)
Ukrainian: 7 (0.03%)
Egyptian: 5 (0.02%)
Lithuanian: 5 (0.02%)
Northern European: 5 (0.02%)
Croatian: 5 (0.02%)
Eastern European: 4 (0.02%) Most common places of birth for foreign-born residents (%): Mexico Mansfield:
13.0% (112)Ohio:
7.8% (44,796)
India Mansfield:
10.8% (93)Ohio:
11.6% (66,525)
Brazil Mansfield:
7.8% (67)Ohio:
0.9% (5,101)
Greece Mansfield:
6.9% (59)Ohio:
0.5% (2,690)
Germany Mansfield:
4.9% (42)Ohio:
2.2% (12,846)
Italy Mansfield:
4.9% (42)Ohio:
1.2% (6,679)
El Salvador Mansfield:
4.9% (42)Ohio:
1.4% (7,947)
France Mansfield:
4.5% (39)Ohio:
0.6% (3,223)
Other Eastern Europe Mansfield:
4.1% (35)Ohio:
0.7% (4,155)
Korea Mansfield:
3.1% (27)Ohio:
2.0% (11,398)
China, excluding Hong Kong and Taiwan Mansfield:
3.1% (27)Ohio:
6.2% (35,703)
Israel Mansfield:
3.0% (26)Ohio:
0.5% (2,631)
South Africa Mansfield:
3.0% (26)Ohio:
0.4% (2,071)
Philippines Mansfield:
2.7% (23)Ohio:
3.1% (17,818)
Japan Mansfield:
2.1% (18)Ohio:
1.4% (8,101)
England Mansfield:
2.0% (17)Ohio:
1.0% (5,979)
Panama Mansfield:
2.0% (17)Ohio:
0.2% (1,224)
Jamaica Mansfield:
1.7% (15)Ohio:
0.7% (4,187)
Place of birth for U.S.-born residents:
This state: 38,761Other state: 7,640Northeast: 1,066Midwest: 1,469South: 4,299West: 802 80.5% of Mansfield residents lived in the same house 1 years ago.
Out of people who lived in different houses, 31.7% lived in this county.
Out of people who lived in different counties, 78.3% lived in Ohio.
Mansfield:
80.5%State average:
87.8%
Education attainment for males 25 years and older:
No schooling: 180Nursery to 4th grade: 345th and 6th grade: 517th and 8th grade: 1469th grade: 44510th grade: 44711th grade: 1,08012th grade, no diploma: 512High school graduate (or equivalency): 8,596Less than 1 year of college: 2,230Some college more than 1 year, no degree: 2,029Associate degree: 839Bachelor's degree: 1,104Master's degree: 538Professional school degree: 369Doctorate degree: 105
Education attainment for females 25 years and older:
No schooling: 333Nursery to 4th grade: 05th and 6th grade: 1497th and 8th grade: 1739th grade: 6810th grade: 20711th grade: 50412th grade, no diploma: 345High school graduate (or equivalency): 6,354Less than 1 year of college: 1,320Some college more than 1 year, no degree: 1,544Associate degree: 1,481Bachelor's degree: 2,270Master's degree: 844Professional school degree: 130Doctorate degree: 22
Housing units in structures:
One, detached: 13,239One, attached: 1,273Two: 1,4813 or 4: 1,2575 to 9: 1,29110 to 19: 83920 to 49: 71550 or more: 684Mobile homes: 647Median worth of mobile homes: $12,890
Housing units lacking complete plumbing facilities in 2022: 2.7%Housing units lacking complete kitchen facilities in 2022: 3.6%House/condo owner moved in on average 12 years ago
Renter moved in on average 3 years ago
Private vs. public school enrollment:
Students in private schools in grades 1 to 8 (elementary and middle school): 420 Students in private schools in grades 9 to 12 (high school): 925 Students in private undergraduate colleges: 813