Mantua, VA (Virginia) Houses and Residents
| Mantua: | $928,259 |
| Virginia: | $365,700 |
Mean price in 2022:
Detached houses: $1,011,290
Here: $1,011,290 State: $472,865 Townhouses or other attached units: $582,365
Here: $582,365 State: $457,437
Total population: 7,135 (All urban)
Houses: 2,809 (2,608 occupied: 1,958 owner occupied, 664 renter occupied)
| % of renters here: | 25% |
| State: | 33% |
Housing density: 1,160 houses/condos per square mile
Median price asked for vacant for-sale houses and condos in 2022 in this county: $1,038,941.
Median contract rent in 2022: $1,767
Median rent asked for vacant for-rent units in 2022: $1,757
Median gross rent in Mantua, VA in 2022: $1,803
Housing units in Mantua with a mortgage: 1,361 (109 second mortgage, 0 home equity loan, 97 both second mortgage and home equity loan)
Houses without a mortgage: 90
Median household income for houses/condos with a mortgage: $250,911
Median household income for apartments without a mortgage: $184,247
Median monthly housing costs: $2,673
Compare current foreclosures near Mantua, VA:
| Photo | Address | Area | Beds / Baths | Price | Details |
|---|---|---|---|---|---|

|
#1
Eastern Ave NE
Washington, DC 20011
|
1,024 sq. feet
|
1 baths 3 beds |
$395,000
|
show details |

|
#2
17th St NW Apt 504
Washington, DC 20009
|
800 sq. feet
|
1 baths 1 beds |
$405,000
|
show details |

|
#3
Cathedral Ave NW Apt 108
Washington, DC 20016
|
765 sq. feet
|
1 baths 1 beds |
$269,900
|
show details |

|
#4
Wilson Ln Apt 204
Mc Lean, VA 22102
|
925 sq. feet
|
1 baths 2 beds |
$359,900
|
show details |

|
#5
Pooks Hill Rd Apt 1612s
Bethesda, MD 20814
|
1,250 sq. feet
|
1 baths 2 beds |
$289,000
|
show details |

|
#6
19th St NW
Washington, DC 20036
|
2,515 sq. feet
|
6 baths 8 beds |
$1,574,900
|
show details |

|
#7
Crafford Pl
Fort Washington, MD 20744
|
1,890 sq. feet
|
1 baths 3 beds |
$265,900
|
show details |

|
#8
Buchanan St NE
Washington, DC 20017
|
1,240 sq. feet
|
2 baths 3 beds |
$325,000
|
show details |

|
#9
Monroe St NW
Washington, DC 20010
|
- sq. feet
|
2 baths 2 beds |
$665,000
|
show details |

|
#10
T St SE Apt 3
Washington, DC 20020
|
- sq. feet
|
2 baths 4 beds |
$307,500
|
show details |
| Photo | Address | Area | Beds / Baths | Price | Details |
|---|---|---|---|---|---|

|
#11
Wilson Bridge Dr Unit #6770 A-2
Oxon Hill, MD 20745
|
- sq. feet
|
1 baths 1 beds |
$99,750
|
show details |

|
#12
Delaware Ave SW Apt N720
Washington, DC 20024
|
- sq. feet
|
1 baths 1 beds |
$149,900
|
show details |

|
#13
Oakwood St SE Apt B5
Washington, DC 20032
|
628 sq. feet
|
1 baths 1 beds |
show details | |

|
#14
Edsall Rd Ph 912
Alexandria, VA 22304
|
1,018 sq. feet
|
2 baths 2 beds |
show details | |

|
#15
Holbrook Ter NE
Washington, DC 20002
|
3,164 sq. feet
|
4 baths 8 beds |
show details | |

|
#16
Tamberly Lane
Manassas, VA 20111
|
- sq. feet
|
2 baths 4 beds |
show details | |

|
#17
Connecticut Ave NW Apt 606
Washington, DC 20008
|
160 sq. feet
|
1 baths 1 beds |
show details | |

|
#18
Sleepy Hollow Rd
Falls Church, VA 22042
|
2,112 sq. feet
|
3 baths 4 beds |
show details | |

|
#19
Tremayne Pl Apt 309
Mc Lean, VA 22102
|
1,180 sq. feet
|
2 baths 2 beds |
show details | |

|
#20
Vernon St
Manassas, VA 20109
|
1,280 sq. feet
|
2 baths 3 beds |
show details |
| Photo | Address | Area | Beds / Baths | Price | Details |
|---|---|---|---|---|---|

|
#21
Burke Woods Dr
Burke, VA 22015
|
- sq. feet
|
6 baths 5 beds |
show details | |

|
#22
Morse St NE
Washington, DC 20002
|
1,836 sq. feet
|
2 baths 3 beds |
show details | |

|
#23
Rolling Spring Ct
Springfield, VA 22152
|
3,365 sq. feet
|
4 baths 4 beds |
show details | |

|
#24
Monitor Ct
Manassas, VA 20109
|
1,829 sq. feet
|
2 baths 3 beds |
show details | |

|
#25
N Royal St
Alexandria, VA 22314
|
- sq. feet
|
1 baths 1 beds |
show details | |

|
#26
Windbreak Dr
Alexandria, VA 22306
|
1,360 sq. feet
|
3 baths 3 beds |
show details | |

|
#27
D St NE
Washington, DC 20002
|
1,156 sq. feet
|
2 baths 4 beds |
show details | |

|
#28
T Pl SE
Washington, DC 20020
|
900 sq. feet
|
2 baths 2 beds |
show details | |

|
#29
Glade Bank Dr
Manassas, VA 20111
|
1,942 sq. feet
|
3 baths 4 beds |
show details | |

|
#30
Kincheloe Rd
Clifton, VA 20124
|
4,492 sq. feet
|
4 baths 5 beds |
show details |
| Photo | Address | Area | Beds / Baths | Price | Details |
|---|---|---|---|---|---|

|
#31
Counsellor Dr
Vienna, VA 22181
|
1,916 sq. feet
|
2 baths 5 beds |
show details | |

|
#32
Buckland Ct
Fort Washington, MD 20744
|
1,496 sq. feet
|
2 baths 3 beds |
show details | |

|
#33
Pearl Fog Way
Dunn Loring, VA 22027
|
3,497 sq. feet
|
4 baths 4 beds |
show details | |

|
#34
Dubois Ct
Woodbridge, VA 22193
|
1,356 sq. feet
|
2 baths 4 beds |
show details | |

|
#35
Willoughby Ct
Chantilly, VA 20151
|
950 sq. feet
|
2 baths 4 beds |
show details | |

|
#36
Saddlehorn Ct
Burke, VA 22015
|
1,138 sq. feet
|
2 baths 3 beds |
show details | |

|
#37
Trenton Pl SE
Washington, DC 20032
|
1,872 sq. feet
|
3 baths 4 beds |
show details | |

|
#38
Pine Ln
Alexandria, VA 22312
|
2,356 sq. feet
|
3 baths 3 beds |
show details | |

|
#39
Lakeland Dr
Sterling, VA 20164
|
2,143 sq. feet
|
2 baths 3 beds |
show details | |

|
#40
Halley Pl SE Apt 204
Washington, DC 20032
|
934 sq. feet
|
1 baths 3 beds |
show details |
| Photo | Address | Area | Beds / Baths | Price | Details |
|---|---|---|---|---|---|

|
#41
Horner Pl SE
Washington, DC 20032
|
1,024 sq. feet
|
1 baths 3 beds |
show details | |

|
#42
Damascus Dr
Manassas, VA 20109
|
1,299 sq. feet
|
2 baths 4 beds |
show details | |

|
#43
Portsmouth Rd
Manassas, VA 20109
|
1,785 sq. feet
|
3 baths 3 beds |
show details | |

|
#44
Yates Ford Rd
Fairfax Station, VA 22039
|
2,464 sq. feet
|
3 baths 5 beds |
show details | |

|
#45
Seminary Rd Apt 1808s
Falls Church, VA 22041
|
1,439 sq. feet
|
2 baths 2 beds |
show details | |

|
#46
Scotch Heather Pl
Woodbridge, VA 22192
|
2,716 sq. feet
|
2 baths 3 beds |
show details | |

|
#47
Hendricks Dr
Woodbridge, VA 22193
|
988 sq. feet
|
2 baths 2 beds |
show details | |

|
#48
Knollwood Dr
Manassas, VA 20111
|
3,172 sq. feet
|
3 baths 4 beds |
show details | |

|
#49
Collis Oak Ct
Fairfax, VA 22033
|
1,362 sq. feet
|
3 baths 3 beds |
show details | |

|
Check over 1 million property listings on Foreclosure.com!
|
browse all offers | |||

Latest news about housing in Mantua, VA collected exclusively by city-data.com from local newspapers, TV, and radio stations


Median year apartment built: 1981
Household type by relationship:
Households: 7,484- Male householders: 1,573 (182 living alone), Female householders: 1,001 (238 living alone)
1,705 spouses (1,686 opposite-sex spouses), 56 unmarried partners, (56 opposite-sex unmarried partners), 2,302 children (2,223 natural, 79 adopted, 0 stepchildren), 71 grandchildren, 121 brothers or sisters, 40 parents, 0 foster children, 244 other relatives, 310 non-relatives
- In group quarters: 56
Size of family households: 876 2-persons, 287 3-persons, 733 4-persons, 134 5-persons, 27 6-persons, 10 7-or-more-persons.
Size of nonfamily households: 434 1-person, 90 2-persons, 37 3-persons.
1,600 married couples with children.
129 single-parent households (73 men, 56 women).
76.8% of residents of Mantua speak English at home.
6.0% of residents speak Spanish at home (53% speak English very well, 20% speak English well, 13% speak English not well, 14% don't speak English at all).
8.1% of residents speak other Indo-European language at home (66% speak English very well, 21% speak English well, 3% speak English not well, 10% don't speak English at all).
6.4% of residents speak Asian or Pacific Island language at home (49% speak English very well, 44% speak English well, 7% speak English not well).
3.0% of residents speak other language at home (97% speak English very well, 3% speak English well).
Foreign born population: 1,429 (19.1%)
(63.2% of them are naturalized citizens)
| Here: | 10.0 |
| State: | 7.0 |
| Here: | 4.4 |
| State: | 4.3 |

- Bedrooms in owner-occupied houses and condos in Mantua, Virginia
- 0no bedroom
- 241 bedroom
- 312 bedrooms
- 2763 bedrooms
- 9554 bedrooms
- 6725+ bedrooms

- Bedrooms in renter-occupied apartments in Mantua, Virginia
- 19no bedroom
- 1631 bedroom
- 2952 bedrooms
- 863 bedrooms
- 614 bedrooms
- 405+ bedrooms

- Cars and other vehicles available in Mantua in owner-occupied houses/condos
- 24no vehicle
- 3581 vehicle
- 9432 vehicles
- 3743 vehicles
- 2124 vehicles
- 485+ vehicles

- Cars and other vehicles available in Mantua in renter-occupied apartments
- 20no vehicle
- 3091 vehicle
- 2982 vehicles
- 193 vehicles
- 04 vehicles
- 185+ vehicles

- Rooms in owner-occupied houses in Mantua, Virginia
- 01 room
- 242 rooms
- 143 rooms
- 04 rooms
- 495 rooms
- 1226 rooms
- 2307 rooms
- 1858 rooms
- 1,3349+ rooms

- Rooms in renter-occupied apartments in Mantua, Virginia
- 191 room
- 742 rooms
- 1063 rooms
- 1524 rooms
- 1505 rooms
- 316 rooms
- 227 rooms
- 728 rooms
- 379+ rooms


Mantua, VA household income distribution

- 69Less than $10,000
- 26$10,000 to $19,999
- 41$20,000 to $29,999
- 72$30,000 to $39,999
- 90$40,000 to $49,999
- 58$50,000 to $59,999
- 62$60,000 to $74,999
- 206$75,000 to $99,999
- 160$100,000 to $124,999
- 191$125,000 to $149,999
- 322$150,000 to $199,999
- 1,323$200,000 or more

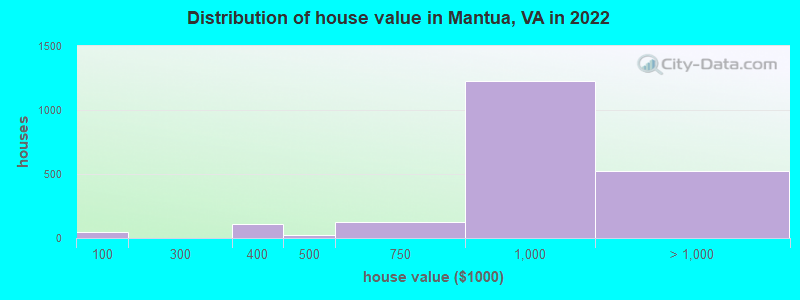
Home value of owner - occupied houses in 2022 in Mantua, VA
-
- 22$50,000 to $59,999
- 13$60,000 to $69,999
- 12$70,000 to $79,999
- 109$300,000 to $399,999
- 23$400,000 to $499,999
- 126$500,000 to $749,999
- 1,228$750,000 to $999,999
- 503$1,000,000 to $1,499,999
- 23$1,500,000 to $1,999,999
Rent paid by renters in 2022 in Mantua, VA
-
- 64$1,000 to $1,249
- 65$1,250 to $1,499
- 386$1,500 to $1,999
- 54$2,000 to $2,499
- 7$3,000 to $3,499
- 112$3,500 or more


Percentage of workers working in this county: 67.9%
Number of people working at home: 1,063 (28.3% of all workers)
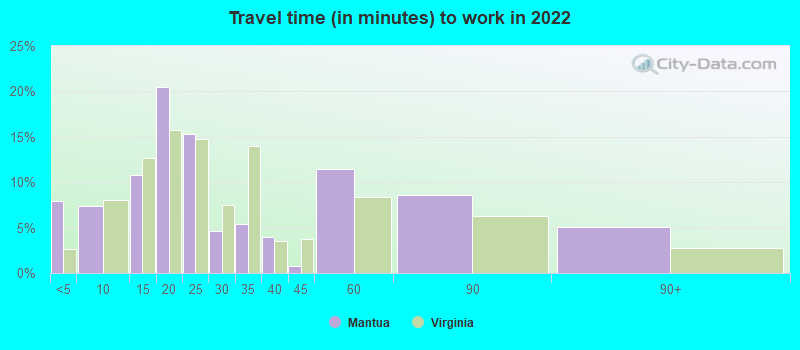
Travel time to work (commute)
- Less than 5 minutes: 68
- 5 to 9 minutes: 169
- 10 to 14 minutes: 180
- 15 to 19 minutes: 249
- 20 to 24 minutes: 438
- 25 to 29 minutes: 254
- 30 to 34 minutes: 429
- 35 to 39 minutes: 273
- 40 to 44 minutes: 180
- 45 to 59 minutes: 213
- 60 to 89 minutes: 236
- 90 or more minutes: 0
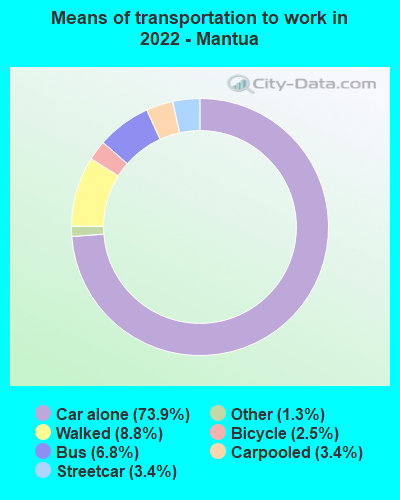
Means of transportation to work:
- Drove a car alone: 813 (40.4%)
- Carpooled: 38 (1.9%)
- Bus: 51 (2.5%)
- Subway or elevated rail: 31 (1.5%)
- Taxi: 18 (0.9%)
- Bicycle: 19 (0.9%)
- Walked: 110 (5.5%)
- Worked at home: 1,063 (52.8%)

- Unemployment by race in 2022
- Unemployment rate for White non-Hispanic residents
- 2.0%Males
- 5.8%Females
- Unemployment rate for Asian residents
- 5.3%Females
- Unemployment rate for two or more race residents
- 20.9%Males
- 2.4%Females

- Year of entry for the foreign-born population in Mantua, Virginia
- 5532010 or later
- 2782000 to 2009
- 3911990 to 1999
- 2631980 to 1989
- 2001970 to 1979
- 195Before 1970
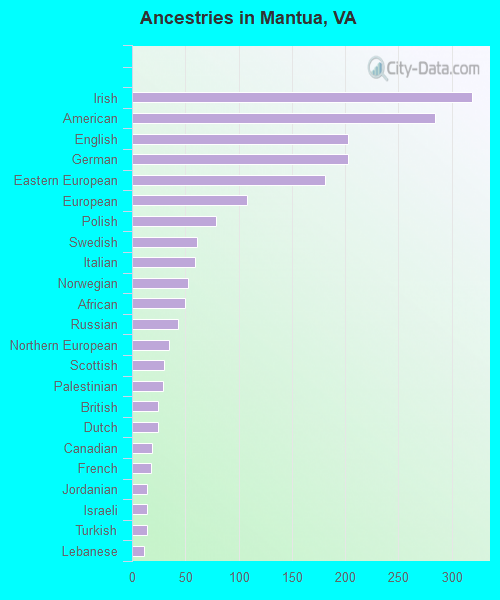
First ancestries reported:
- Irish: 319 (8.6%)
- American: 284 (7.6%)
- English: 203 (5.4%)
- German: 203 (5.4%)
- Eastern European: 181 (4.9%)
- European: 108 (2.9%)
- Polish: 79 (2.1%)
- Swedish: 61 (1.6%)
- Italian: 59 (1.6%)
- Norwegian: 53 (1.4%)
- African: 50 (1.3%)
- Russian: 43 (1.2%)
- Northern European: 35 (0.9%)
- Scottish: 30 (0.8%)
- Palestinian: 29 (0.8%)
- British: 24 (0.6%)
- Dutch: 24 (0.6%)
- Canadian: 19 (0.5%)
- French: 18 (0.5%)
- Jordanian: 14 (0.4%)
- Israeli: 14 (0.4%)
- Turkish: 14 (0.4%)
- Lebanese: 11 (0.3%)
Most common places of birth for foreign-born residents (%):
| Mantua: | 13.1% (187) |
| Virginia: | 9.0% (97,830) |
| Mantua: | 8.3% (119) |
| Virginia: | 1.3% (14,435) |
| Mantua: | 7.8% (112) |
| Virginia: | 0.1% (1,474) |
| Mantua: | 7.1% (102) |
| Virginia: | 3.9% (42,989) |
| Mantua: | 6.6% (95) |
| Virginia: | 4.9% (52,857) |
| Mantua: | 6.4% (92) |
| Virginia: | 0.5% (5,428) |
| Mantua: | 6.1% (87) |
| Virginia: | 2.4% (25,722) |
| Mantua: | 5.6% (80) |
| Virginia: | 2.3% (24,582) |
| Mantua: | 5.2% (74) |
| Virginia: | 4.2% (45,750) |
| Mantua: | 4.3% (61) |
| Virginia: | 0.2% (1,815) |
| Mantua: | 3.7% (53) |
| Virginia: | 0.1% (1,352) |
| Mantua: | 2.9% (42) |
| Virginia: | 0.1% (711) |
| Mantua: | 2.6% (37) |
| Virginia: | 0.2% (2,246) |
| Mantua: | 2.4% (34) |
| Virginia: | 0.9% (9,440) |
| Mantua: | 1.7% (25) |
| Virginia: | 2.4% (26,366) |
| Mantua: | 1.6% (23) |
| Virginia: | 2.9% (32,082) |
Place of birth for U.S.-born residents:
- This state: 2,080
- Other state: 3,776
- Northeast: 1,406
- Midwest: 664
- South: 1,316
- West: 404
85.7% of Mantua residents lived in the same house 1 years ago.
Out of people who lived in different houses, 39.3% lived in this county.
Out of people who lived in different counties, 22.1% lived in Virginia.
| Mantua: | 85.7% |
| State average: | 86.6% |
Education attainment for males 25 years and older:
- No schooling: 0
- Nursery to 4th grade: 0
- 5th and 6th grade: 0
- 7th and 8th grade: 0
- 9th grade: 0
- 10th grade: 0
- 11th grade: 0
- 12th grade, no diploma: 17
- High school graduate (or equivalency): 233
- Less than 1 year of college: 63
- Some college more than 1 year, no degree: 50
- Associate degree: 22
- Bachelor's degree: 840
- Master's degree: 653
- Professional school degree: 426
- Doctorate degree: 208

Education attainment for females 25 years and older:
- No schooling: 48
- Nursery to 4th grade: 36
- 5th and 6th grade: 0
- 7th and 8th grade: 20
- 9th grade: 0
- 10th grade: 0
- 11th grade: 0
- 12th grade, no diploma: 69
- High school graduate (or equivalency): 111
- Less than 1 year of college: 82
- Some college more than 1 year, no degree: 59
- Associate degree: 125
- Bachelor's degree: 757
- Master's degree: 871
- Professional school degree: 161
- Doctorate degree: 112


Housing units in structures:
- One, detached: 1,797
- One, attached: 259
- 3 or 4: 43
- 5 to 9: 68
- 10 to 19: 324
- 20 to 49: 70
- 50 or more: 245
House/condo owner moved in on average 13 years ago
Renter moved in on average 3 years ago

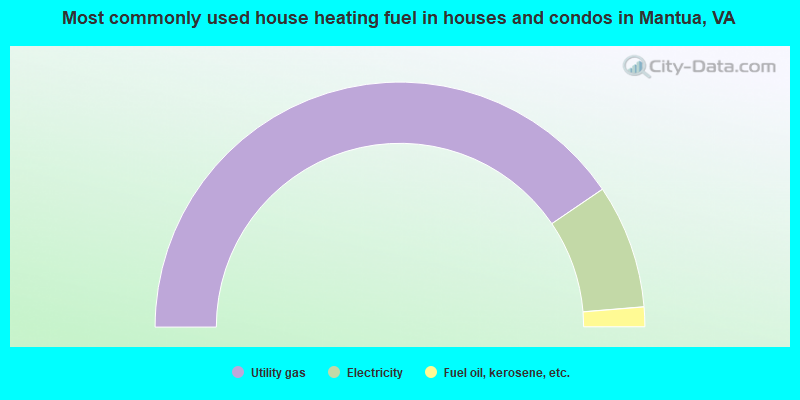
- 81.0%Utility gas
- 16.4%Electricity
- 2.6%Fuel oil, kerosene, etc.
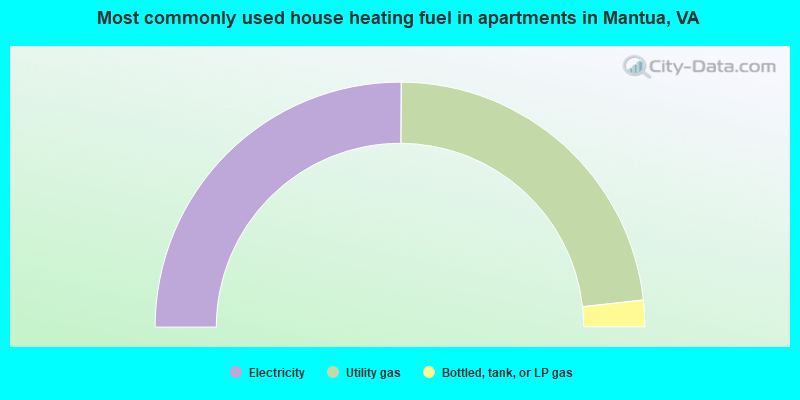
- 50.2%Electricity
- 46.3%Utility gas
- 3.5%Bottled, tank, or LP gas
Private vs. public school enrollment:
| Here: | 7.7% |
| Virginia: | 13.2% |
| Here: | 9.4% |
| Virginia: | 10.2% |
| Here: | 14.5% |
| Virginia: | 18.7% |


