Marble Cliff, OH (Ohio) Houses and Residents
| Marble Cliff: | $855,477 |
| Ohio: | $204,100 |
Total population: 581 (All urban)
Houses: 507 (487 occupied: 333 owner occupied, 151 renter occupied)
| % of renters here: | 31% |
| State: | 33% |
Housing density: 2,048 houses/condos per square mile
Median price asked for vacant for-sale houses and condos in 2022 in this county: $157,288.
Median contract rent in 2022: $1,120 (lower quartile is $998, upper quartile is $1,294)
Median rent asked for vacant for-rent units in 2022: $964
Median gross rent in Marble Cliff, OH in 2022: $1,231
Housing units in Marble Cliff with a mortgage: 222 (45 second mortgage, 0 home equity loan, 47 both second mortgage and home equity loan)
Houses without a mortgage: 20
Median household income for houses/condos with a mortgage: $204,512
Median household income for apartments without a mortgage: $108,051
Median monthly housing costs: $1,986
Compare current foreclosures near Marble Cliff, OH:
| Photo | Address | Area | Beds / Baths | Price | Details |
|---|---|---|---|---|---|

|
#1
Bayberry Cir
Columbus, OH 43207
|
1,564 sq. feet
|
1 baths 3 beds |
$127,500
|
show details |

|
#2
E 21st Ave
Columbus, OH 43211
|
1,061 sq. feet
|
1 baths 3 beds |
$179,900
|
show details |

|
#3
S High St
Columbus, OH 43207
|
1,678 sq. feet
|
2 baths 4 beds |
$27,500
|
show details |

|
#4
E Howard Rd
Columbus, OH 43207
|
1,056 sq. feet
|
1 baths 3 beds |
show details | |

|
#5
S Champion Ave
Columbus, OH 43207
|
1,157 sq. feet
|
1 baths 2 beds |
show details | |

|
#6
High Free Pike
West Jefferson, OH 43162
|
1,216 sq. feet
|
2 baths 4 beds |
show details | |

|
#7
Upton Rd E
Columbus, OH 43232
|
852 sq. feet
|
1 baths 3 beds |
show details | |

|
#8
Striebel Ct
Columbus, OH 43227
|
925 sq. feet
|
1 baths 3 beds |
show details | |

|
#9
Summertree Ln
Westerville, OH 43081
|
2,496 sq. feet
|
2 baths 3 beds |
show details | |

|
#10
Lehner Rd
Columbus, OH 43224
|
1,628 sq. feet
|
2 baths 4 beds |
show details |
| Photo | Address | Area | Beds / Baths | Price | Details |
|---|---|---|---|---|---|

|
#11
Gladys Rd
Columbus, OH 43228
|
832 sq. feet
|
1 baths 3 beds |
show details | |

|
#12
S Richardson Ave
Columbus, OH 43204
|
1,520 sq. feet
|
2 baths 3 beds |
show details | |

|
#13
Wrexham Ave
Columbus, OH 43223
|
1,235 sq. feet
|
1 baths 3 beds |
show details | |

|
#14
Glenmate Ct
Columbus, OH 43223
|
1,050 sq. feet
|
1 baths 3 beds |
show details | |

|
#15
N Roys Ave
Columbus, OH 43204
|
1,248 sq. feet
|
2 baths 3 beds |
show details | |

|
#16
Whittman Ct
Plain City, OH 43064
|
3,186 sq. feet
|
3 baths 4 beds |
show details | |

|
#17
Chester Rd
Columbus, OH 43221
|
3,300 sq. feet
|
4 baths 5 beds |
show details | |

|
#18
Executive Ct
Westerville, OH 43081
|
1,811 sq. feet
|
2 baths 3 beds |
show details | |

|
#19
Hiawatha Park Dr
Columbus, OH 43211
|
1,278 sq. feet
|
1 baths 4 beds |
show details | |

|
#20
N Roys Ave
Columbus, OH 43204
|
648 sq. feet
|
2 baths 3 beds |
show details |
| Photo | Address | Area | Beds / Baths | Price | Details |
|---|---|---|---|---|---|

|
#21
London Groveport Rd
Grove City, OH 43123
|
816 sq. feet
|
1 baths 2 beds |
show details | |

|
#22
Fergus Rd
Grove City, OH 43123
|
3,312 sq. feet
|
2 baths 4 beds |
show details | |

|
#23
Chidley St
Galloway, OH 43119
|
1,502 sq. feet
|
1 baths 3 beds |
show details | |

|
#24
Ashgrove Dr
Grove City, OH 43123
|
1,772 sq. feet
|
2 baths 4 beds |
show details | |

|
#25
Hildreth Ave
Columbus, OH 43203
|
1,798 sq. feet
|
2 baths 4 beds |
show details | |

|
#26
Plainview Dr
Columbus, OH 43204
|
730 sq. feet
|
1 baths 2 beds |
show details | |

|
#27
Fairfield Ave
Columbus, OH 43203
|
984 sq. feet
|
1 baths 2 beds |
show details | |

|
#28
Kelton Ave
Columbus, OH 43206
|
1,080 sq. feet
|
1 baths 3 beds |
show details | |

|
#29
Rosewood Ct
Powell, OH 43065
|
2,801 sq. feet
|
3 baths 4 beds |
show details | |

|
#30
Roundelay Rd N
Reynoldsburg, OH 43068
|
1,712 sq. feet
|
2 baths 3 beds |
show details |
| Photo | Address | Area | Beds / Baths | Price | Details |
|---|---|---|---|---|---|

|
#31
E Welch Ave
Columbus, OH 43207
|
1,864 sq. feet
|
2 baths 4 beds |
show details | |

|
#32
Armada Rd
Columbus, OH 43232
|
1,028 sq. feet
|
1 baths 4 beds |
show details | |

|
#33
Hamilton Ave
Columbus, OH 43211
|
1,061 sq. feet
|
1 baths 3 beds |
show details | |

|
#34
Cannonade Ct
Columbus, OH 43230
|
2,023 sq. feet
|
2 baths 3 beds |
show details | |

|
#35
Falls Peak Ln
Delaware, OH 43015
|
1,352 sq. feet
|
2 baths 2 beds |
show details | |

|
#36
N 18th St
Columbus, OH 43203
|
1,690 sq. feet
|
1 baths 4 beds |
show details | |

|
#37
Grasmere Ave
Columbus, OH 43211
|
720 sq. feet
|
1 baths 2 beds |
show details | |

|
#38
E Lincoln Ave
Columbus, OH 43214
|
874 sq. feet
|
1 baths 3 beds |
show details | |

|
#39
Legionary St
Columbus, OH 43207
|
1,356 sq. feet
|
2 baths 3 beds |
show details | |

|
#40
Preamble Ln
Columbus, OH 43207
|
980 sq. feet
|
2 baths 2 beds |
show details |
| Photo | Address | Area | Beds / Baths | Price | Details |
|---|---|---|---|---|---|

|
#41
Hines Rd
Columbus, OH 43230
|
1,448 sq. feet
|
1 baths 3 beds |
show details | |

|
#42
Trafalgar Ct
Columbus, OH 43230
|
1,560 sq. feet
|
2 baths 4 beds |
show details | |

|
#43
Hackworth St
Columbus, OH 43207
|
1,163 sq. feet
|
2 baths 3 beds |
show details | |

|
#44
Meander Dr
Columbus, OH 43229
|
1,972 sq. feet
|
2 baths 4 beds |
show details | |

|
#45
E Fulton St
Columbus, OH 43227
|
961 sq. feet
|
1 baths 3 beds |
show details | |

|
#46
Kirkwood Rd
Columbus, OH 43227
|
1,084 sq. feet
|
1 baths 3 beds |
show details | |

|
#47
Basil Dr
Columbus, OH 43227
|
1,604 sq. feet
|
2 baths 4 beds |
show details | |

|
#48
Barthel Ave
Columbus, OH 43227
|
1,276 sq. feet
|
1 baths 3 beds |
show details | |

|
#49
Muskingum Dr
Columbus, OH 43230
|
1,900 sq. feet
|
1 baths 4 beds |
show details | |

|
Check over 1 million property listings on Foreclosure.com!
|
browse all offers | |||


 | Victorian/Craftsman style homes in Columbus? (12 replies) |
| Need Suggestion for work in Springfield and Housing in Columbus (22 replies) |
| Relocating to Columbus for work (8 replies) |
| Columbus City and Suburban Development News (2794 replies) |
| Need a rental home (1 reply) |
| Coming to visit in Feb. looking for a home & nice neighborhood (24 replies) |

Median year apartment built: 1958
Household type by relationship:
Households: 1,011- Male householders: 226 (59 living alone), Female householders: 252 (116 living alone)
266 spouses (260 opposite-sex spouses), 27 unmarried partners, (27 opposite-sex unmarried partners), 202 children (198 natural, 4 adopted, 0 stepchildren), 4 grandchildren, 3 brothers or sisters, 14 parents, 2 foster children, 2 other relatives, 11 non-relatives
Size of family households: 135 2-persons, 100 3-persons, 26 4-persons, 4 5-persons, 9 6-persons.
Size of nonfamily households: 183 1-person, 26 2-persons, 3 3-persons.
168 married couples with children.
10 single-parent households (2 men, 8 women).
96.0% of residents of Marble Cliff speak English at home.
0.5% of residents speak Spanish at home (100% speak English very well).
1.7% of residents speak other Indo-European language at home (100% speak English very well).
1.1% of residents speak Asian or Pacific Island language at home (100% speak English very well).
0.3% of residents speak other language at home (100% speak English very well).
Foreign born population: 36 (3.6%)
(58.3% of them are naturalized citizens)
| Here: | 10.0 |
| State: | 6.7 |
| Here: | 3.7 |
| State: | 4.4 |

- Bedrooms in owner-occupied houses and condos in Marble Cliff, Ohio
- 0no bedroom
- 71 bedroom
- 642 bedrooms
- 1023 bedrooms
- 994 bedrooms
- 615+ bedrooms

- Bedrooms in renter-occupied apartments in Marble Cliff, Ohio
- 5no bedroom
- 811 bedroom
- 582 bedrooms
- 73 bedrooms
- 04 bedrooms
- 05+ bedrooms

- Cars and other vehicles available in Marble Cliff in owner-occupied houses/condos
- 5no vehicle
- 451 vehicle
- 1612 vehicles
- 663 vehicles
- 174 vehicles
- 405+ vehicles

- Cars and other vehicles available in Marble Cliff in renter-occupied apartments
- 8no vehicle
- 951 vehicle
- 462 vehicles
- 23 vehicles
- 04 vehicles
- 05+ vehicles

- Rooms in owner-occupied houses in Marble Cliff, Ohio
- 01 room
- 02 rooms
- 33 rooms
- 164 rooms
- 315 rooms
- 226 rooms
- 397 rooms
- 528 rooms
- 1709+ rooms

- Rooms in renter-occupied apartments in Marble Cliff, Ohio
- 51 room
- 62 rooms
- 523 rooms
- 414 rooms
- 375 rooms
- 66 rooms
- 27 rooms
- 18 rooms
- 29+ rooms


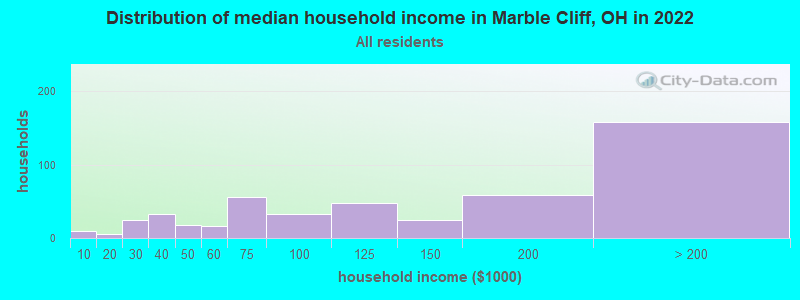
Marble Cliff, OH household income distribution

- 10Less than $10,000
- 5$10,000 to $19,999
- 24$20,000 to $29,999
- 33$30,000 to $39,999
- 18$40,000 to $49,999
- 16$50,000 to $59,999
- 56$60,000 to $74,999
- 33$75,000 to $99,999
- 48$100,000 to $124,999
- 25$125,000 to $149,999
- 58$150,000 to $199,999
- 158$200,000 or more
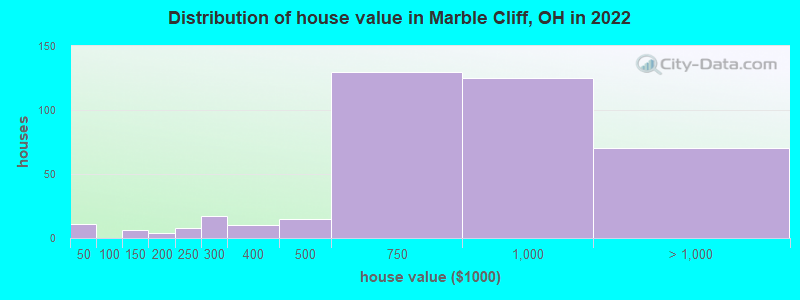
Home value of owner - occupied houses in 2022 in Marble Cliff, OH
-
- 10Less than $10,000
- 3$100,000 to $124,999
- 1$125,000 to $149,999
- 1$150,000 to $174,999
- 2$175,000 to $199,999
- 7$200,000 to $249,999
- 16$250,000 to $299,999
- 10$300,000 to $399,999
- 14$400,000 to $499,999
- 129$500,000 to $749,999
- 124$750,000 to $999,999
- 51$1,000,000 to $1,499,999
- 14$1,500,000 to $1,999,999
- 4$2,000,000 or more
Rent paid by renters in 2022 in Marble Cliff, OH
-
- 2$800 to $899
- 54$900 to $999
- 64$1,000 to $1,249
- 23$1,250 to $1,499
- 3$1,500 to $1,999
- 7$2,000 to $2,499
- 1$3,500 or more
- 1No cash rent


Percentage of workers working in this county: 94.6%
Number of people working at home: 65 (11.0% of all workers)
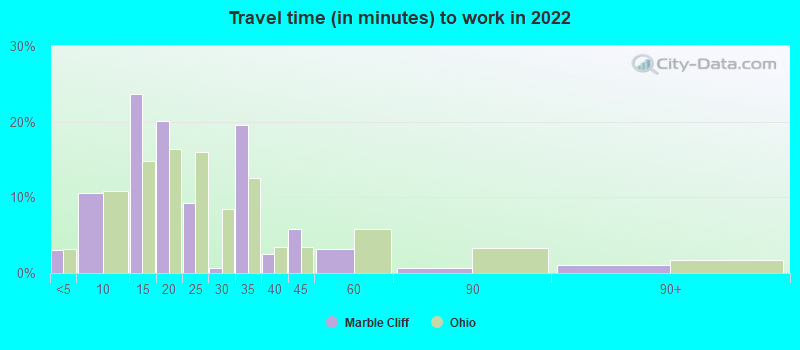
Travel time to work (commute)
- Less than 5 minutes: 13
- 5 to 9 minutes: 77
- 10 to 14 minutes: 90
- 15 to 19 minutes: 170
- 20 to 24 minutes: 67
- 25 to 29 minutes: 36
- 30 to 34 minutes: 24
- 35 to 39 minutes: 2
- 40 to 44 minutes: 6
- 45 to 59 minutes: 9
- 60 to 89 minutes: 14
- 90 or more minutes: 4
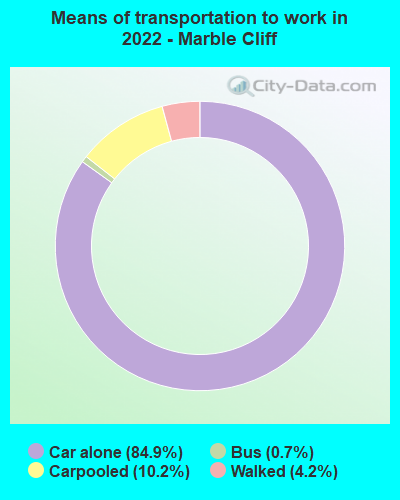
Means of transportation to work:
- Drove a car alone: 681 (75.1%)
- Carpooled: 96 (10.6%)
- Bus: 6 (0.7%)
- Walked: 29 (3.2%)
- Worked at home: 65 (7.2%)

- Unemployment by race in 2022
- Unemployment rate for White non-Hispanic residents
- 3.4%Females

- Year of entry for the foreign-born population in Marble Cliff, Ohio
- 162010 or later
- 32000 to 2009
- 51990 to 1999
- 11980 to 1989
- 21970 to 1979
- 7Before 1970
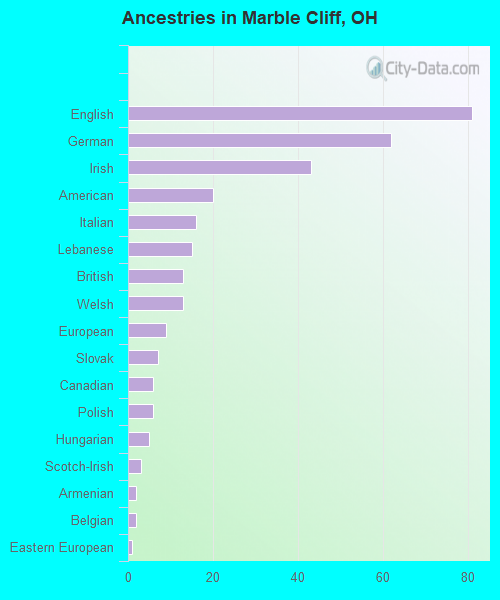
First ancestries reported:
- English: 81 (19.2%)
- German: 62 (14.7%)
- Irish: 43 (10.2%)
- American: 20 (4.7%)
- Italian: 16 (3.8%)
- Lebanese: 15 (3.5%)
- British: 13 (3.1%)
- Welsh: 13 (3.1%)
- European: 9 (2.1%)
- Slovak: 7 (1.7%)
- Canadian: 6 (1.4%)
- Polish: 6 (1.4%)
- Hungarian: 5 (1.2%)
- Scotch-Irish: 3 (0.7%)
- Armenian: 2 (0.5%)
- Belgian: 2 (0.5%)
- Eastern European: 1 (0.2%)
Most common places of birth for foreign-born residents (%):
| Marble Cliff: | 17.1% (6) |
| Ohio: | 11.6% (66,525) |
| Marble Cliff: | 17.1% (6) |
| Ohio: | 0.1% (700) |
| Marble Cliff: | 11.4% (4) |
| Ohio: | 0.7% (3,722) |
| Marble Cliff: | 11.4% (4) |
| Ohio: | 2.6% (14,988) |
| Marble Cliff: | 8.6% (3) |
| Ohio: | 0.3% (1,754) |
| Marble Cliff: | 5.7% (2) |
| Ohio: | 0.8% (4,490) |
| Marble Cliff: | 5.7% (2) |
| Ohio: | 0.8% (4,309) |
| Marble Cliff: | 2.9% (1) |
| Ohio: | 0.1% (598) |
Place of birth for U.S.-born residents:
- This state: 628
- Other state: 322
- Northeast: 59
- Midwest: 44
- South: 186
- West: 24
89.6% of Marble Cliff residents lived in the same house 1 years ago.
Out of people who lived in different houses, 45.5% lived in this county.
Out of people who lived in different counties, 71.4% lived in Ohio.
| Marble Cliff: | 89.6% |
| State average: | 87.8% |
Education attainment for males 25 years and older:
- No schooling: 0
- Nursery to 4th grade: 0
- 5th and 6th grade: 0
- 7th and 8th grade: 0
- 9th grade: 0
- 10th grade: 0
- 11th grade: 0
- 12th grade, no diploma: 0
- High school graduate (or equivalency): 23
- Less than 1 year of college: 0
- Some college more than 1 year, no degree: 37
- Associate degree: 9
- Bachelor's degree: 136
- Master's degree: 52
- Professional school degree: 91
- Doctorate degree: 11

Education attainment for females 25 years and older:
- No schooling: 0
- Nursery to 4th grade: 0
- 5th and 6th grade: 0
- 7th and 8th grade: 2
- 9th grade: 0
- 10th grade: 0
- 11th grade: 6
- 12th grade, no diploma: 0
- High school graduate (or equivalency): 41
- Less than 1 year of college: 16
- Some college more than 1 year, no degree: 33
- Associate degree: 29
- Bachelor's degree: 138
- Master's degree: 75
- Professional school degree: 67
- Doctorate degree: 24


Housing units in structures:
- One, detached: 280
- One, attached: 41
- Two: 47
- 3 or 4: 37
- 5 to 9: 86
- 10 to 19: 12
House/condo owner moved in on average 10 years ago
Renter moved in on average 3 years ago

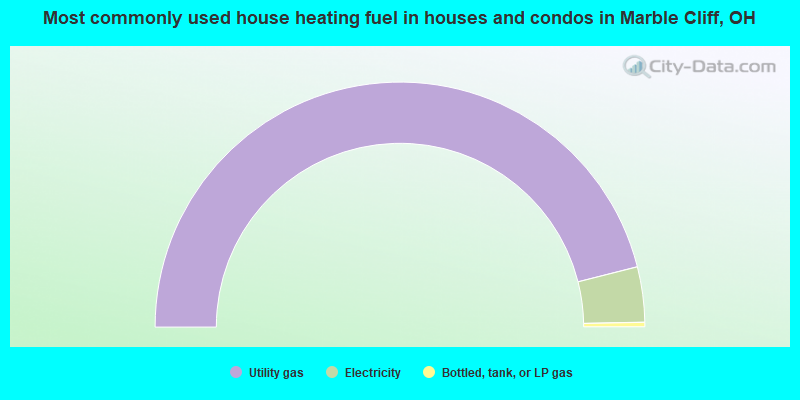
- 92.1%Utility gas
- 7.3%Electricity
- 0.6%Bottled, tank, or LP gas
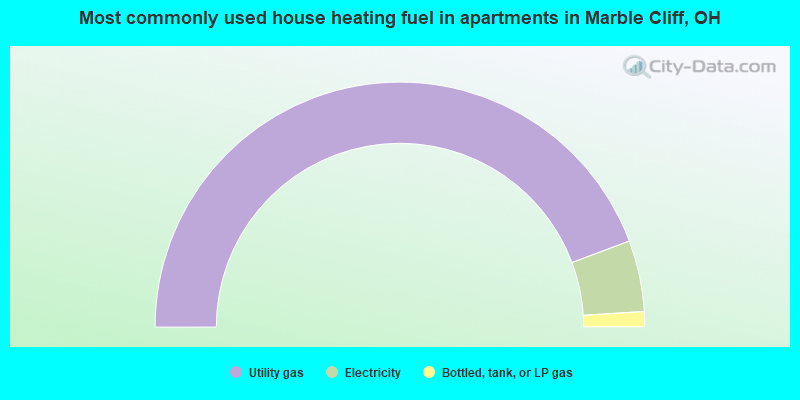
- 88.6%Utility gas
- 9.4%Electricity
- 2.0%Bottled, tank, or LP gas
Private vs. public school enrollment:
| Here: | 12.7% |
| Ohio: | 16.0% |
| Here: | 51.0% |
| Ohio: | 13.1% |
| Here: | 0.0% |
| Ohio: | 22.3% |


