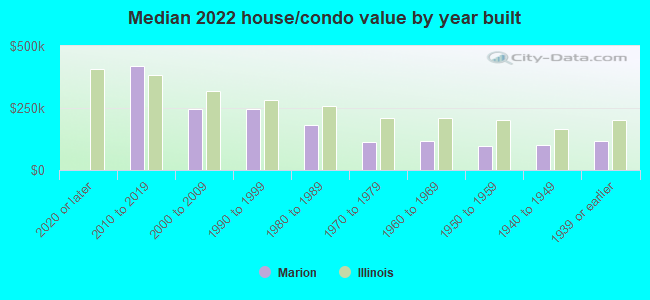
Marion, IL (Illinois) Houses and Residents
| Marion: | $159,658 |
| Illinois: | $251,600 |
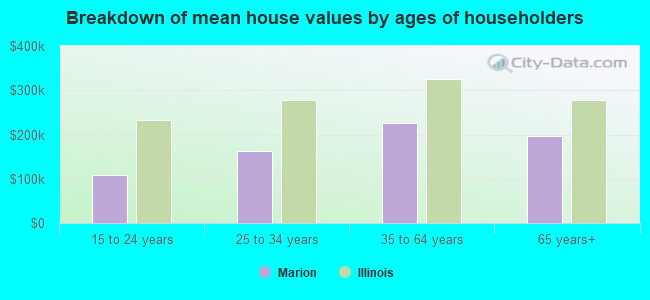
Mean price in 2022:
Detached houses: $194,653
Here: $194,653 State: $310,164 Townhouses or other attached units: $323,127
Here: $323,127 State: $286,230 In 2-unit structures: $81,205
Here: $81,205 State: $299,638 Mobile homes: $60,347
Here: $60,347 State: $78,855
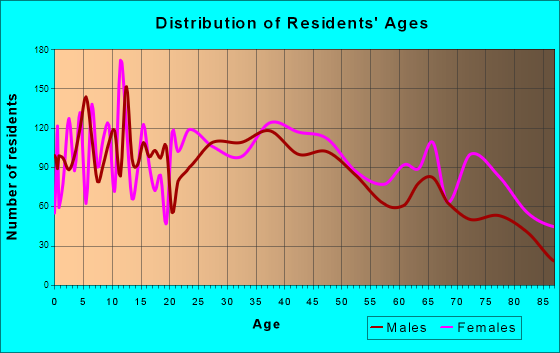
Total population: 17,438 (Urban population: 15,578 (all inside urban clusters), Rural population: 415 (13 farm, 402 nonfarm))
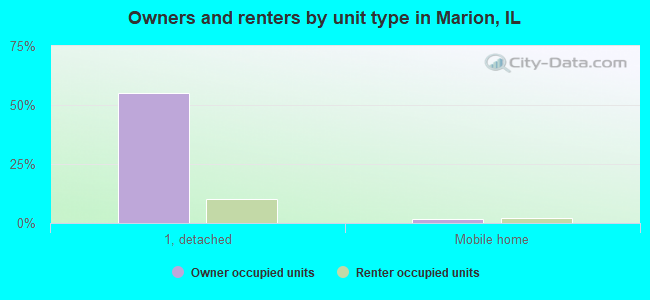
Houses: 8,859 (8,093 occupied: 5,091 owner occupied, 3,118 renter occupied)
| % of renters here: | 38% |
| State: | 33% |
Housing density: 691 houses/condos per square mile
Median price asked for vacant for-sale houses and condos in 2022: $164,848.
Median contract rent in 2022: $630 (lower quartile is $388, upper quartile is $798)
Median rent asked for vacant for-rent units in 2022: $477
Median gross rent in Marion, IL in 2022: $784
Housing units in Marion with a mortgage: 3,027 (334 second mortgage, 5 home equity loan, 291 both second mortgage and home equity loan)
Houses without a mortgage: 58
Median household income for houses/condos with a mortgage: $96,490
Median household income for apartments without a mortgage: $65,602
Median monthly housing costs: $858
Compare current foreclosures in Marion, IL:
| Photo | Address | Area | Beds / Baths | Price | Details |
|---|---|---|---|---|---|

|
#1
E Boyton St
Marion, IL 62959
|
925 sq. feet
|
1 baths 3 beds |
show details | |

|
#2
N State St
Marion, IL 62959
|
2,978 sq. feet
|
2 baths 4 beds |
show details | |

|
#3
Napolean Rd
Marion, IL 62959
|
920 sq. feet
|
2 baths 3 beds |
show details | |

|
#4
Roberts Rd
Marion, IL 62959
|
- sq. feet
|
2 baths 3 beds |
show details | |

|
#5
Fawn Dr
Marion, IL 62959
|
1,671 sq. feet
|
- baths - beds |
show details | |

|
#6
Spring Garden Rd
Marion, IL 62959
|
- sq. feet
|
- baths - beds |
show details | |

|
#7
Emerson Ave # 104
Marion, IL 62959
|
- sq. feet
|
- baths - beds |
show details | |

|
#8
Darren Dr
Marion, IL 62959
|
- sq. feet
|
- baths - beds |
show details | |

|
#9
Saraville Rd
Marion, IL 62959
|
- sq. feet
|
- baths - beds |
show details | |

|
#10
Stotlar Rd
Marion, IL 62959
|
- sq. feet
|
- baths - beds |
show details |
| Photo | Address | Area | Beds / Baths | Price | Details |
|---|---|---|---|---|---|

|
#11
Remington Rd
Marion, IL 62959
|
- sq. feet
|
- baths - beds |
show details | |

|
#12
Teske Rd
Marion, IL 62959
|
- sq. feet
|
- baths - beds |
show details | |

|
#13
N Van Buren St
Marion, IL 62959
|
- sq. feet
|
- baths - beds |
show details | |

|
#14
Galatia Post Rd
Marion, IL 62959
|
- sq. feet
|
- baths - beds |
show details | |

|
#15
Crab Orchard Rd
Marion, IL 62959
|
- sq. feet
|
- baths - beds |
show details | |

|
#16
Stilleys Mill Rd
Marion, IL 62959
|
- sq. feet
|
- baths - beds |
show details | |

|
#17
Bragg Ave
Marion, IL 62959
|
- sq. feet
|
- baths - beds |
show details | |

|
#18
Zachary Dr
Marion, IL 62959
|
- sq. feet
|
- baths - beds |
show details | |

|
#19
E Parham St
Marion, IL 62959
|
- sq. feet
|
- baths - beds |
show details | |

|
#20
N Market St # C
Marion, IL 62959
|
- sq. feet
|
- baths - beds |
show details |
| Photo | Address | Area | Beds / Baths | Price | Details |
|---|---|---|---|---|---|

|
#21
Sherman Dr
Marion, IL 62959
|
- sq. feet
|
- baths - beds |
show details | |

|
#22
W Main St # 81
Marion, IL 62959
|
- sq. feet
|
- baths - beds |
show details | |

|
#23
Pittsburg Rd
Marion, IL 62959
|
- sq. feet
|
- baths - beds |
show details | |

|
#24
Mountaineer Ln Apt C
Marion, IL 62959
|
- sq. feet
|
- baths - beds |
show details | |

|
#25
Red Row
Marion, IL 62959
|
- sq. feet
|
- baths - beds |
show details | |

|
#26
E Boulevard St
Marion, IL 62959
|
- sq. feet
|
- baths - beds |
show details | |

|
#27
N Van Buren St Apt B
Marion, IL 62959
|
- sq. feet
|
- baths - beds |
show details | |

|
#28
Rolling Acres Dr
Marion, IL 62959
|
- sq. feet
|
- baths - beds |
show details | |

|
#29
Water Tower Rd
Marion, IL 62959
|
- sq. feet
|
- baths - beds |
show details | |

|
#30
N Court St
Marion, IL 62959
|
- sq. feet
|
- baths - beds |
show details |
| Photo | Address | Area | Beds / Baths | Price | Details |
|---|---|---|---|---|---|

|
#31
Route 37
Marion, IL 62959
|
- sq. feet
|
- baths - beds |
show details | |

|
#32
Rolling Acres Dr
Marion, IL 62959
|
- sq. feet
|
- baths - beds |
show details | |

|
#33
Melanie Ln Apt H
Marion, IL 62959
|
- sq. feet
|
- baths - beds |
show details | |

|
#34
Lobo Ln
Marion, IL 62959
|
- sq. feet
|
- baths - beds |
show details | |

|
#35
Apache Dr
Marion, IL 62959
|
- sq. feet
|
- baths - beds |
show details | |

|
#36
Calico Rd
Marion, IL 62959
|
- sq. feet
|
- baths - beds |
show details | |

|
#37
Pope St
Marion, IL 62959
|
- sq. feet
|
- baths - beds |
show details | |

|
#38
E Willow Dr
Marion, IL 62959
|
- sq. feet
|
- baths - beds |
show details | |

|
#39
S Dallas Ln
Marion, IL 62959
|
- sq. feet
|
- baths - beds |
show details | |

|
#40
Saline River Rd
Marion, IL 62959
|
- sq. feet
|
- baths - beds |
show details |
| Photo | Address | Area | Beds / Baths | Price | Details |
|---|---|---|---|---|---|

|
#41
Cra Mel Dr
Marion, IL 62959
|
- sq. feet
|
- baths - beds |
show details | |

|
#42
Andrew Rd
Marion, IL 62959
|
- sq. feet
|
- baths - beds |
show details | |

|
#43
E Carter St
Marion, IL 62959
|
- sq. feet
|
- baths - beds |
show details | |

|
#44
Norman Rd
Marion, IL 62959
|
- sq. feet
|
- baths - beds |
show details | |

|
#45
Westernaire Dr
Marion, IL 62959
|
- sq. feet
|
- baths - beds |
show details | |

|
#46
Macie Dr
Marion, IL 62959
|
- sq. feet
|
- baths - beds |
show details | |

|
#47
Old Route 13
Marion, IL 62959
|
- sq. feet
|
- baths - beds |
show details | |

|
#48
E Pickett Ln # C
Marion, IL 62959
|
- sq. feet
|
- baths - beds |
show details | |

|
#49
E College St
Marion, IL 62959
|
- sq. feet
|
- baths - beds |
show details | |

|
Check over 1 million property listings on Foreclosure.com!
|
browse all offers | |||

Latest news about housing in Marion, IL collected exclusively by city-data.com from local newspapers, TV, and radio stations

 | Looking at a house in Wheaton (103 replies) |
| Marion, Illinois (4 replies) |
| anyone know New Horizons Homes in Marion (2 replies) |
| Liberal Southern Illinois Cities? (23 replies) |
| Home rental Carbondale - Marion IL (3 replies) |
| SIU Carbondale, current condition? (30 replies) |
Median year apartment built: 1982
Household type by relationship:
Households: 16,760- Male householders: 3,672 (1,536 living alone), Female householders: 4,304 (1,753 living alone)
2,769 spouses (2,715 opposite-sex spouses), 644 unmarried partners, (610 opposite-sex unmarried partners), 3,924 children (3,622 natural, 32 adopted, 269 stepchildren), 163 grandchildren, 74 brothers or sisters, 101 parents, 100 foster children, 88 other relatives, 497 non-relatives
- In group quarters: 417
Size of family households: 2,269 2-persons, 720 3-persons, 577 4-persons, 449 5-persons, 53 6-persons, 107 7-or-more-persons.
Size of nonfamily households: 3,460 1-person, 501 2-persons, 60 3-persons, 50 4-persons.
1,793 married couples with children.
1,184 single-parent households (545 men, 639 women).
96.2% of residents of Marion speak English at home.
0.5% of residents speak Spanish at home (70% speak English very well, 30% speak English not well).
0.4% of residents speak other Indo-European language at home (100% speak English very well).
2.7% of residents speak Asian or Pacific Island language at home (83% speak English very well, 12% speak English well, 6% speak English not well).
0.2% of residents speak other language at home (100% speak English very well).
Foreign born population: 372 (2.2%)
(28.8% of them are naturalized citizens)
| Here: | 6.2 |
| State: | 6.4 |
| Here: | 4.5 |
| State: | 4.1 |
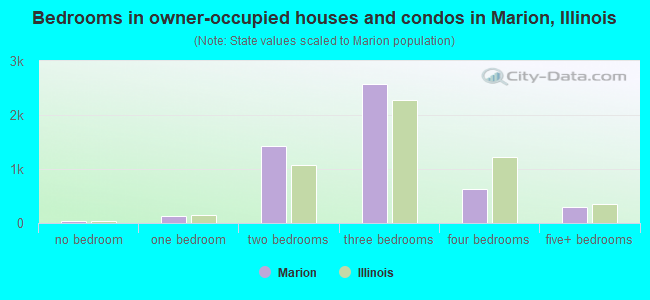
- Bedrooms in owner-occupied houses and condos in Marion, Illinois
- 36no bedroom
- 1221 bedroom
- 1,4232 bedrooms
- 2,5773 bedrooms
- 6304 bedrooms
- 3055+ bedrooms
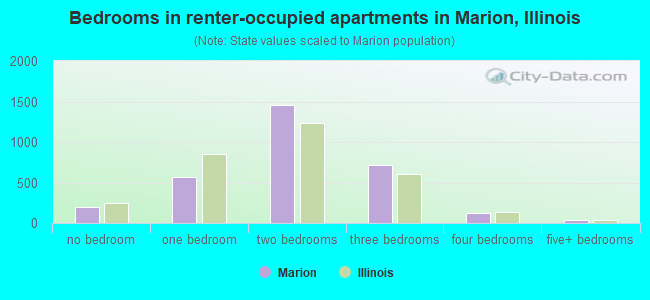
- Bedrooms in renter-occupied apartments in Marion, Illinois
- 193no bedroom
- 5711 bedroom
- 1,4612 bedrooms
- 7213 bedrooms
- 1294 bedrooms
- 435+ bedrooms
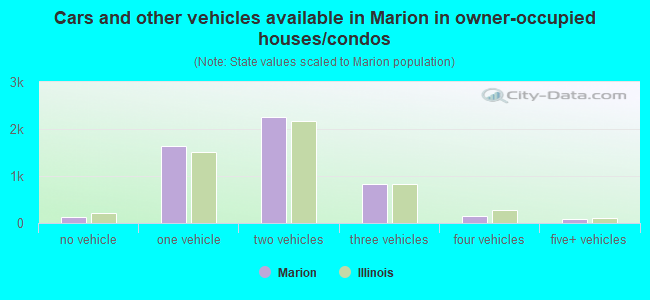
- Cars and other vehicles available in Marion in owner-occupied houses/condos
- 136no vehicle
- 1,6411 vehicle
- 2,2562 vehicles
- 8303 vehicles
- 1394 vehicles
- 895+ vehicles
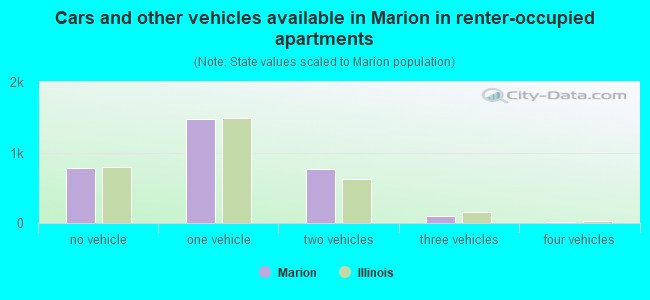
- Cars and other vehicles available in Marion in renter-occupied apartments
- 778no vehicle
- 1,4701 vehicle
- 7632 vehicles
- 953 vehicles
- 124 vehicles
- 05+ vehicles
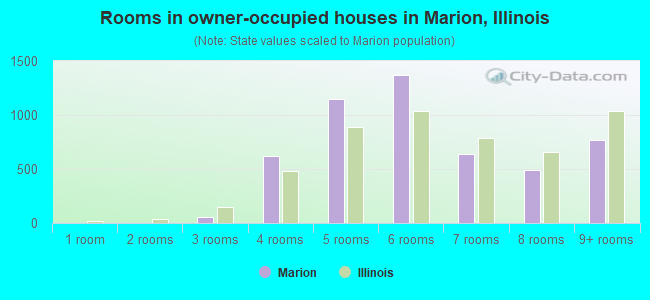
- Rooms in owner-occupied houses in Marion, Illinois
- 01 room
- 02 rooms
- 553 rooms
- 6204 rooms
- 1,1495 rooms
- 1,3666 rooms
- 6357 rooms
- 4938 rooms
- 7739+ rooms
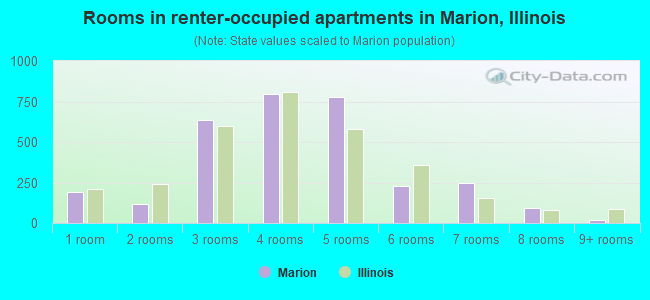
- Rooms in renter-occupied apartments in Marion, Illinois
- 1931 room
- 1202 rooms
- 6373 rooms
- 7974 rooms
- 7785 rooms
- 2306 rooms
- 2507 rooms
- 958 rooms
- 189+ rooms
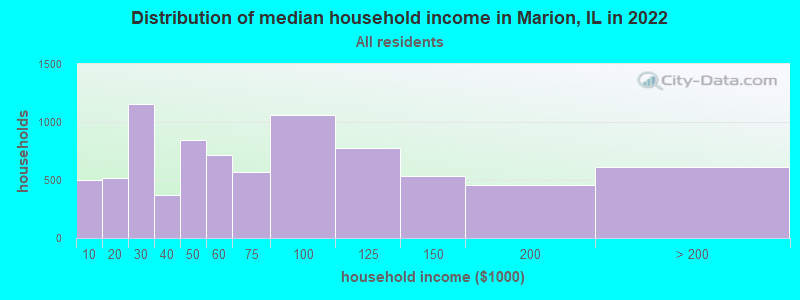
Marion, IL household income distribution

- 496Less than $10,000
- 514$10,000 to $19,999
- 1,152$20,000 to $29,999
- 369$30,000 to $39,999
- 842$40,000 to $49,999
- 713$50,000 to $59,999
- 571$60,000 to $74,999
- 1,057$75,000 to $99,999
- 780$100,000 to $124,999
- 536$125,000 to $149,999
- 456$150,000 to $199,999
- 616$200,000 or more
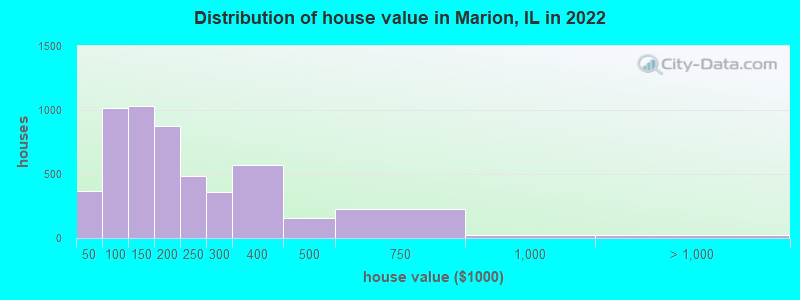
Home value of owner - occupied houses in 2022 in Marion, IL
-
- 126Less than $10,000
- 67$15,000 to $19,999
- 76$20,000 to $24,999
- 6$25,000 to $29,999
- 29$30,000 to $34,999
- 24$35,000 to $39,999
- 38$40,000 to $49,999
- 73$50,000 to $59,999
- 150$60,000 to $69,999
- 222$70,000 to $79,999
- 268$80,000 to $89,999
- 261$90,000 to $99,999
- 723$100,000 to $124,999
- 311$125,000 to $149,999
- 628$150,000 to $174,999
- 243$175,000 to $199,999
- 484$200,000 to $249,999
- 359$250,000 to $299,999
- 571$300,000 to $399,999
- 157$400,000 to $499,999
- 222$500,000 to $749,999
- 26$750,000 to $999,999
- 25$2,000,000 or more
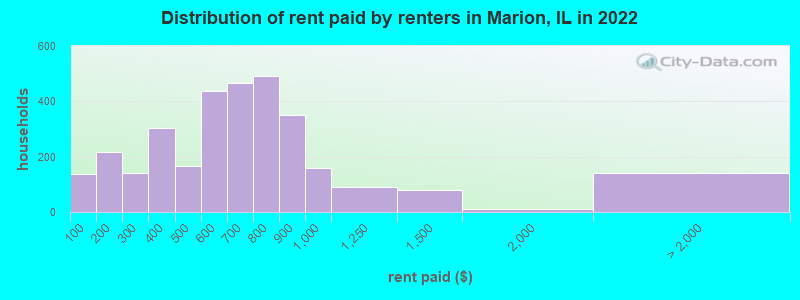
Rent paid by renters in 2022 in Marion, IL
-
- 138Less than $100
- 178$100 to $149
- 38$150 to $199
- 82$200 to $249
- 57$250 to $299
- 154$300 to $349
- 148$350 to $399
- 158$400 to $449
- 6$450 to $499
- 272$500 to $549
- 164$550 to $599
- 241$600 to $649
- 226$650 to $699
- 141$700 to $749
- 349$750 to $799
- 350$800 to $899
- 159$900 to $999
- 90$1,000 to $1,249
- 80$1,250 to $1,499
- 11$1,500 to $1,999
- 6$2,500 to $2,999
- 18$3,000 to $3,499
- 48$3,500 or more
- 69No cash rent
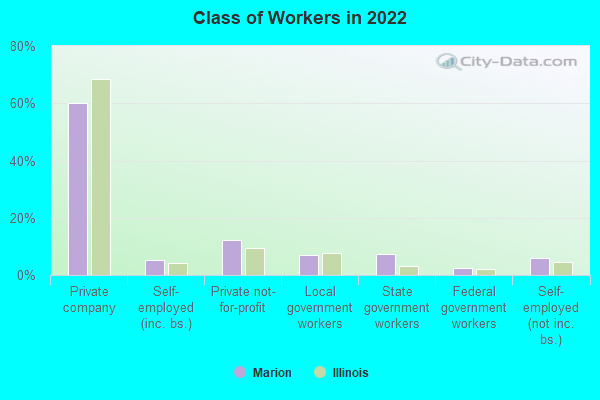
Percentage of workers working in this county: 75.0%
Number of people working at home: 1,005 (13.6% of all workers)
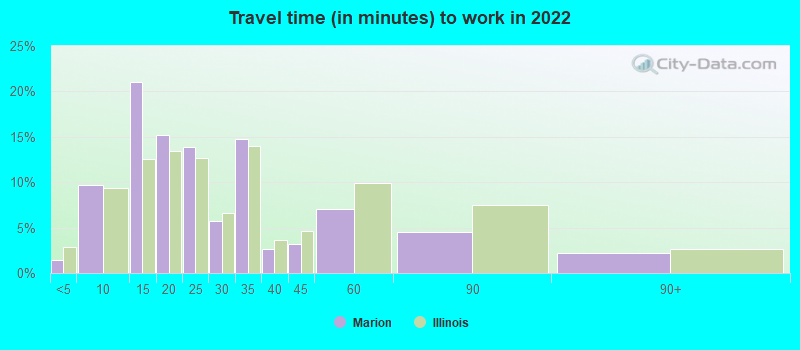
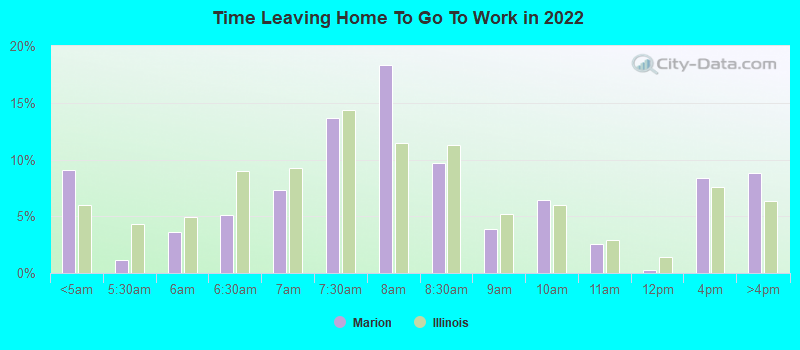
Travel time to work (commute)
- Less than 5 minutes: 168
- 5 to 9 minutes: 1,192
- 10 to 14 minutes: 1,652
- 15 to 19 minutes: 1,102
- 20 to 24 minutes: 396
- 25 to 29 minutes: 397
- 30 to 34 minutes: 809
- 35 to 39 minutes: 154
- 40 to 44 minutes: 149
- 45 to 59 minutes: 373
- 60 to 89 minutes: 213
- 90 or more minutes: 157
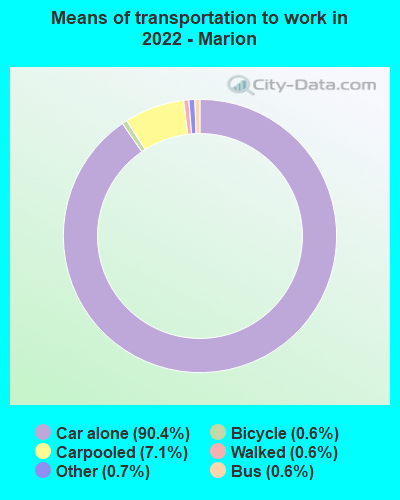
Means of transportation to work:
- Drove a car alone: 14,000 (83.1%)
- Carpooled: 1,177 (7.0%)
- Bus: 90 (0.5%)
- Taxi: 116 (0.7%)
- Bicycle: 98 (0.6%)
- Walked: 95 (0.6%)
- Worked at home: 1,005 (6.0%)
- Unemployment by race in 2022
- Unemployment rate for White non-Hispanic residents
- 6.3%Males
- 2.7%Females
- Unemployment rate for Black residents
- 4.9%Males
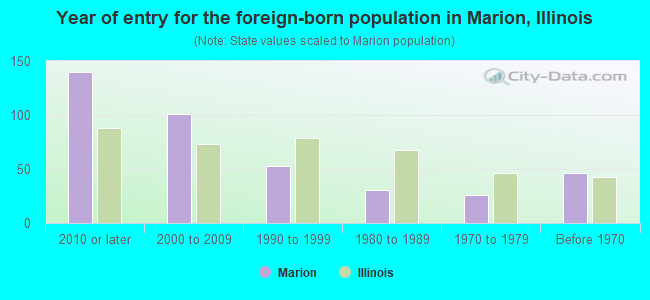
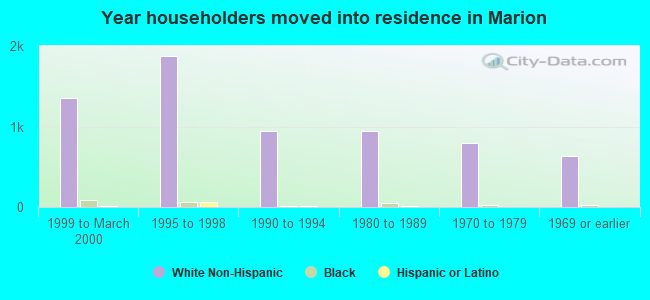
- Year of entry for the foreign-born population in Marion, Illinois
- 1402010 or later
- 1012000 to 2009
- 531990 to 1999
- 311980 to 1989
- 261970 to 1979
- 46Before 1970
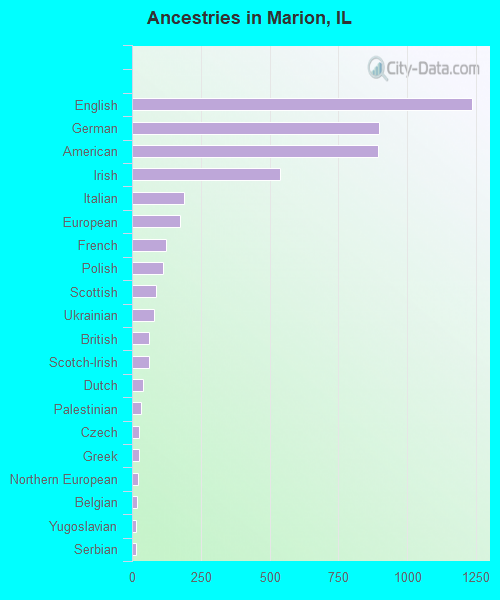
First ancestries reported:
- English: 1,236 (19.9%)
- German: 899 (14.5%)
- American: 896 (14.4%)
- Irish: 538 (8.7%)
- Italian: 188 (3.0%)
- European: 175 (2.8%)
- French: 123 (2.0%)
- Polish: 113 (1.8%)
- Scottish: 87 (1.4%)
- Ukrainian: 81 (1.3%)
- British: 62 (1.0%)
- Scotch-Irish: 62 (1.0%)
- Dutch: 39 (0.6%)
- Palestinian: 33 (0.5%)
- Czech: 24 (0.4%)
- Greek: 24 (0.4%)
- Northern European: 21 (0.3%)
- Belgian: 19 (0.3%)
- Yugoslavian: 16 (0.3%)
- Serbian: 13 (0.2%)
- Norwegian: 11 (0.2%)
- Lebanese: 9 (0.1%)
- Slovak: 8 (0.1%)
- Welsh: 7 (0.1%)
- French Canadian: 6 (0.10%)
- Scandinavian: 2 (0.03%)
Most common places of birth for foreign-born residents (%):
| Marion: | 21.3% (80) |
| Illinois: | 5.2% (93,003) |
| Marion: | 20.5% (77) |
| Illinois: | 4.1% (74,364) |
| Marion: | 20.3% (76) |
| Illinois: | 0.1% (1,780) |
| Marion: | 17.3% (65) |
| Illinois: | 9.2% (166,409) |
| Marion: | 9.9% (37) |
| Illinois: | 1.3% (22,793) |
| Marion: | 7.2% (27) |
| Illinois: | 0.1% (1,954) |
| Marion: | 3.5% (13) |
| Illinois: | 0.0% (143) |
| Marion: | 2.7% (10) |
| Illinois: | 0.1% (2,017) |
| Marion: | 1.6% (6) |
| Illinois: | 1.0% (18,753) |
Place of birth for U.S.-born residents:
- This state: 11,977
- Other state: 4,428
- Northeast: 322
- Midwest: 1,430
- South: 1,829
- West: 722
87.8% of Marion residents lived in the same house 1 years ago.
Out of people who lived in different houses, 34.8% lived in this county.
Out of people who lived in different counties, 77.8% lived in Illinois.
| Marion: | 87.8% |
| State average: | 88.3% |
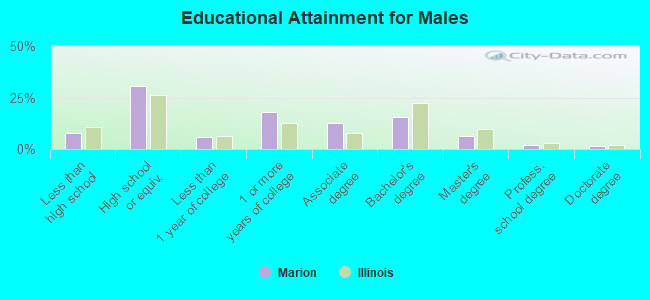
Education attainment for males 25 years and older:
- No schooling: 102
- Nursery to 4th grade: 0
- 5th and 6th grade: 0
- 7th and 8th grade: 32
- 9th grade: 15
- 10th grade: 38
- 11th grade: 194
- 12th grade, no diploma: 69
- High school graduate (or equivalency): 1,817
- Less than 1 year of college: 332
- Some college more than 1 year, no degree: 1,070
- Associate degree: 756
- Bachelor's degree: 926
- Master's degree: 372
- Professional school degree: 126
- Doctorate degree: 73
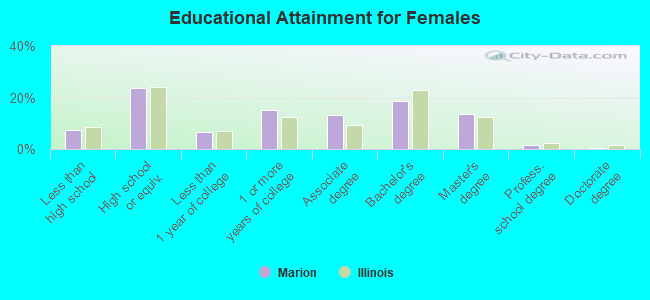
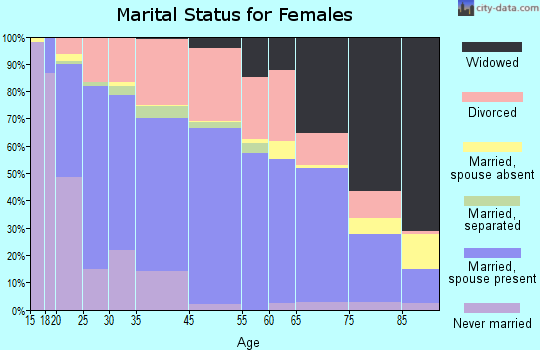
Education attainment for females 25 years and older:
- No schooling: 46
- Nursery to 4th grade: 0
- 5th and 6th grade: 31
- 7th and 8th grade: 34
- 9th grade: 65
- 10th grade: 195
- 11th grade: 100
- 12th grade, no diploma: 20
- High school graduate (or equivalency): 1,554
- Less than 1 year of college: 441
- Some college more than 1 year, no degree: 980
- Associate degree: 852
- Bachelor's degree: 1,218
- Master's degree: 884
- Professional school degree: 92
- Doctorate degree: 28
Housing units in structures:
- One, detached: 5,917
- One, attached: 98
- Two: 795
- 3 or 4: 576
- 5 to 9: 474
- 10 to 19: 95
- 20 to 49: 195
- 50 or more: 352
- Mobile homes: 351
Median worth of mobile homes: $20,156
Housing units lacking complete kitchen facilities in 2022: 1.2%
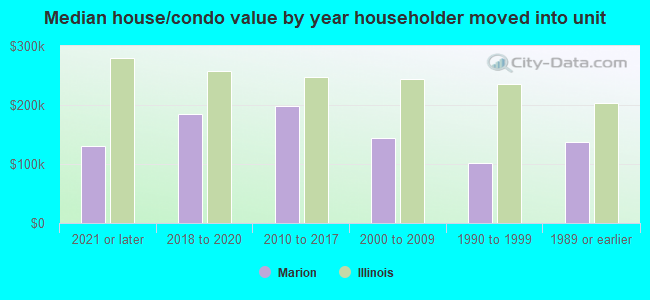
House/condo owner moved in on average 10 years ago
Renter moved in on average 5 years ago
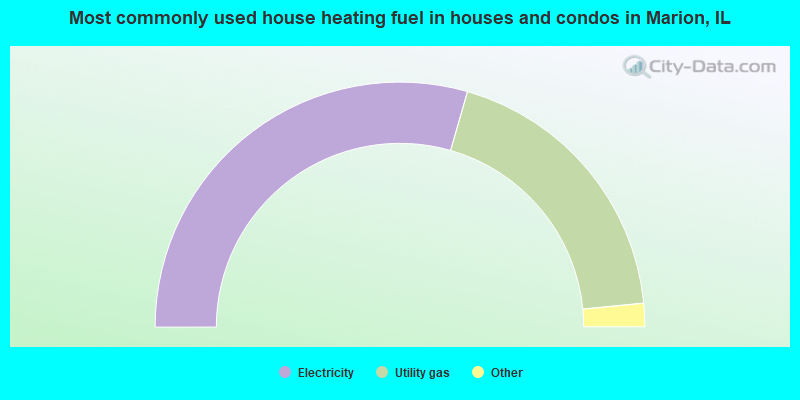
- 58.9%Electricity
- 38.0%Utility gas
- 1.7%Bottled, tank, or LP gas
- 0.7%Coal or coke
- 0.4%No fuel used
- 0.1%Fuel oil, kerosene, etc.
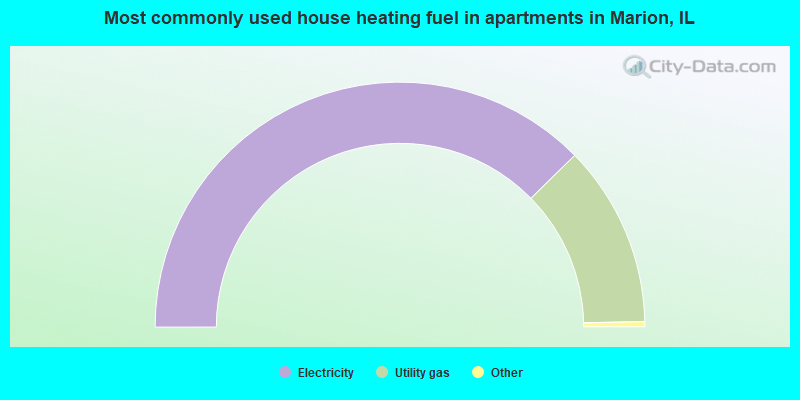
- 75.3%Electricity
- 24.0%Utility gas
- 0.4%Bottled, tank, or LP gas
- 0.3%No fuel used
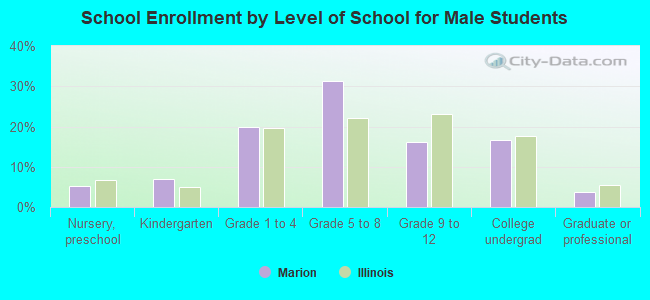
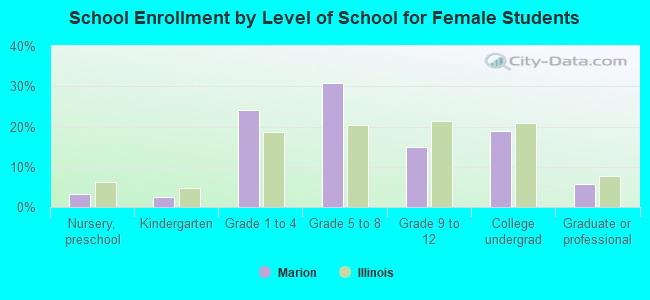
Private vs. public school enrollment:
| Here: | 10.6% |
| Illinois: | 13.3% |
| Here: | 0.0% |
| Illinois: | 9.9% |
| Here: | 0.0% |
| Illinois: | 27.4% |