Martinez, GA (Georgia) Houses and Residents
Estimated median house or condo value in 2022: $237,376 (it was $104,600 in 2000 )
Martinez:
$237,376Georgia:
$297,400
Lower value quartile - upper value quartile: $189,522 - $314,477Mean price in 2022: Detached houses: $288,697 Here:
$288,697State:
$376,364
Townhouses or other attached units: $217,671 Here:
$217,671State:
$341,709
In 3-to-4-unit structures: $245,648 Here:
$245,648State:
$250,092
Mobile homes: $44,580 Here:
$44,580State:
$102,413
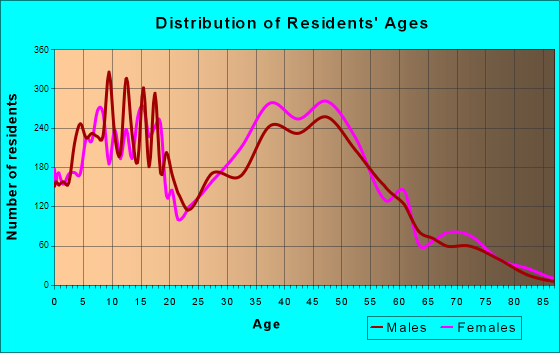
Total population: 35,795 (Urban population: 27,553, Rural population: 0)
Houses: 14,857 (12,509 occupied: 9,608 owner occupied, 3,624 renter occupied )
% of renters here:
27%State:
34%
Housing density: 1,182 houses/condos per square mile
Median price asked for vacant for-sale houses and condos in 2022: $220,569.
Median contract rent in 2022: $1,019 (lower quartile is $816, upper quartile is $1,235)
Median rent asked for vacant for-rent units in 2022: $657
Median gross rent in Martinez, GA in 2022: $1,101
Housing units in Martinez with a mortgage: 5,665 (642 second mortgage, 11 home equity loan, 461 both second mortgage and home equity loan )Houses without a mortgage: 199
Median household income for houses/condos with a mortgage: $99,490
Median household income for apartments without a mortgage: $77,790
Median monthly housing costs: $1,062
Data:
Median house or condo value ($)
Median house or condo value ($ change since 2000)
Median house or condo value ($) - White
Median house or condo value ($) - Black or African American
Median house or condo value ($) - Asian
Median house or condo value ($) - Hispanic or Latino
Median house or condo value ($) - American Indian and Alaska Native
Median house or condo value ($) - Multirace
Median house or condo value ($) - Other Race
Median price asked for mobile homes ($)
Household density (households per square mile)
Mean house or condo value by units in structure - 1, detached ($)
Mean house or condo value by units in structure - 1, attached ($)
Mean house or condo value by units in structure - 2 ($)
Mean house or condo value by units in structure by units in structure - 3 or 4 ($)
Mean house or condo value by units in structure - 5 or more ($)
Mean house or condo value by units in structure - Boat, RV, van, etc. ($)
Mean house or condo value by units in structure - Mobile home ($)
Median contract rent ($)
Median contract rent - Lower quartile ($)
Median contract rent - Upper quartile ($)
Median gross rent ($)
Urban houses (%)
Rural houses (%)
Houses occupied (%)
Houses occupied (% change since 2000)
Houses owner occupied (%)
Houses owner occupied (% change since 2000)
Houses renter occupied (%)
Houses renter occupied (% change since 2000)
Vacant housing units - For rent (%)
Vacant housing units - For rent (% change since 2000)
Vacant housing units - For sale only (%)
Vacant housing units - For sale only (% change since 2000)
Vacant housing units - Rented or sold, not occupied (%)
Vacant housing units - Rented or sold, not occupied (% change since 2000)
Vacant housing units - For seasonal, recreational, or occasional use (%)
Vacant housing units - For seasonal, recreational, or occasional use (% change since 2000)
Vacant housing units - For migrant workers (%)
Vacant housing units - For migrant workers (% change since 2000)
Vacant housing units - Other vacant (%)
Vacant housing units - Other vacant (% change since 2000)
Median monthly housing costs ($)
Median household income for houses/condos with a mortgage ($)
Median household income for houses/condos without a mortgage ($)
Median household income ($)
Median household income ($) - White
Median household income ($) - Black or African American
Median household income ($) - Asian
Median household income ($) - Hispanic or Latino
Median household income ($) - American Indian and Alaska Native
Median household income ($) - Multirace
Median household income ($) - Other Race
Mortgage status - with mortgage (%)
Mortgage status - with second mortgage (%)
Mortgage status - with home equity loan (%)
Mortgage status - with both second mortgage and home equity loan (%)
Mortgage status - without a mortgage (%)
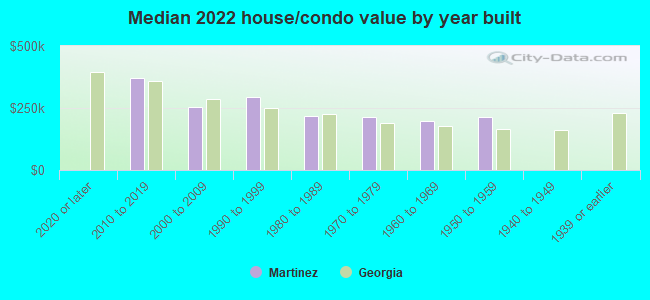
Median year house/condo built
Median year apartment built
Household type by relationship - Male householder living alone (%)
Household type by relationship - Male householder not living alone (%)
Household type by relationship - Female householder living alone (%)
Household type by relationship - Female householder not living alone (%)
Household type by relationship - Opposite-Sex spouse (%)
Household type by relationship - Same-Sex spouse (%)
Household type by relationship - Opposite-Sex unmarried partner (%)
Household type by relationship - Same-Sex unmarried partner (%)
Household type by relationship - In group quarters (%)
Size of family households - 2-person household (%)
Size of family households - 3-person household (%)
Size of family households - 4-person household (%)
Size of family households - 5-person household (%)
Size of family households - 6-person household (%)
Size of family households - 7-or-more-person household (%)
Size of nonfamily households - 1-person household (%)
Size of nonfamily households - 2-person household (%)
Size of nonfamily households - 3-person household (%)
Size of nonfamily households - 4-person household (%)
Size of nonfamily households - 5-person household (%)
Size of nonfamily households - 6-person household (%)
Size of nonfamily households - 7-or-moreperson household (%)
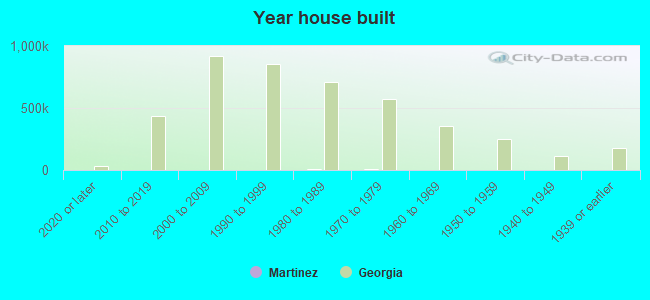
Year house built - Built 2010 or later (%)
Year house built - Built 2000 to 2009 (%)
Year house built - Built 1990 to 1999 (%)
Year house built - Built 1980 to 1989 (%)
Year house built - Built 1970 to 1979 (%)
Year house built - Built 1960 to 1969 (%)
Year house built - Built 1950 to 1959 (%)
Year house built - Built 1940 to 1949 (%)
Year house built - Built 1939 or earlier (%)
Median number of rooms in houses and condos
Median number of rooms in apartments
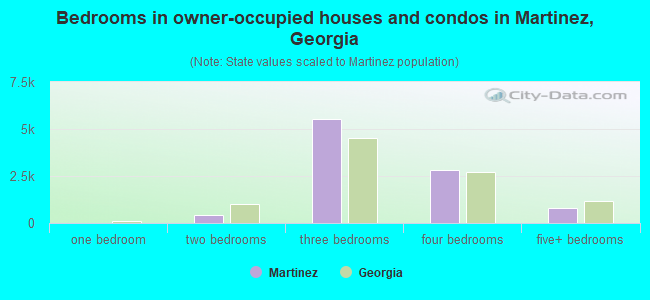
Median number of bedrooms in owner occupied houses
Mean number of bedrooms in owner occupied houses
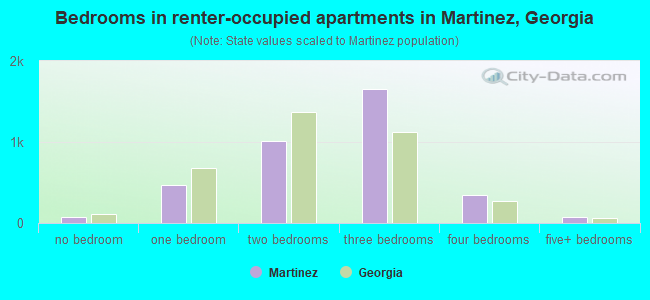
Median number of bedrooms in renter occupied houses
Mean number of bedrooms in renter occupied houses
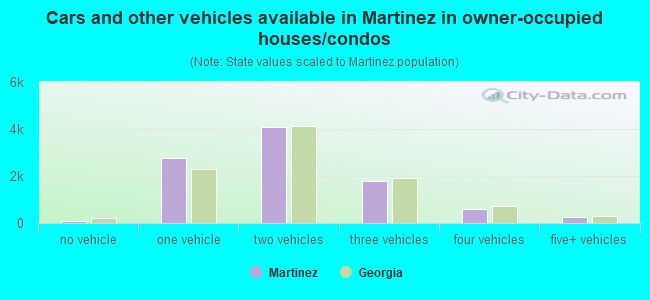
Median number of vehichles in owner occupied houses
Mean number of vehichles in owner occupied houses
Median number of vehichles in renter occupied houses
Mean number of vehichles in renter occupied houses
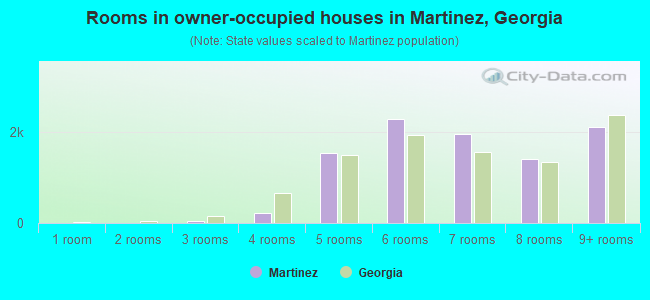
Rooms in owner-occupied houses - 1 room (%)
Rooms in owner-occupied houses - 2 rooms (%)
Rooms in owner-occupied houses - 3 rooms (%)
Rooms in owner-occupied houses - 4 rooms (%)
Rooms in owner-occupied houses - 5 rooms (%)
Rooms in owner-occupied houses - 6 rooms (%)
Rooms in owner-occupied houses - 7 rooms (%)
Rooms in owner-occupied houses - 8 rooms (%)
Rooms in owner-occupied houses - 9+ rooms (%)
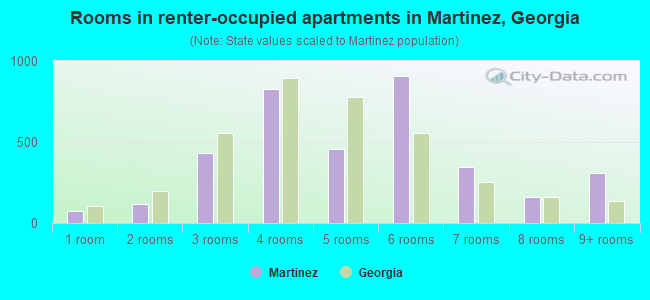
Rooms in renter-occupied houses - 1 room (%)
Rooms in renter-occupied houses - 2 rooms (%)
Rooms in renter-occupied houses - 3 rooms (%)
Rooms in renter-occupied houses - 4 rooms (%)
Rooms in renter-occupied houses - 5 rooms (%)
Rooms in renter-occupied houses - 6 rooms (%)
Rooms in renter-occupied houses - 7 rooms (%)
Rooms in renter-occupied houses - 8 rooms (%)
Rooms in renter-occupied houses - 9+ rooms (%)
Bedrooms in owner-occupied houses - no bedrooms (%)
Bedrooms in owner-occupied houses - 1 bedroom (%)
Bedrooms in owner-occupied houses - 2 bedrooms (%)
Bedrooms in owner-occupied houses - 3 bedrooms (%)
Bedrooms in owner-occupied houses - 4 bedrooms (%)
Bedrooms in owner-occupied houses - 5+ bedrooms (%)
Bedrooms in renter-occupied houses - no bedrooms (%)
Bedrooms in renter-occupied houses - 1 bedroom (%)
Bedrooms in renter-occupied houses - 2 bedrooms (%)
Bedrooms in renter-occupied houses - 3 bedrooms (%)
Bedrooms in renter-occupied houses - 4 bedrooms (%)
Bedrooms in renter-occupied houses - 5+ bedrooms (%)
Vehicles available in owner-occupied houses - no vehicle available (%)
Vehicles available in owner-occupied houses - 1 vehicle available(%)
Vehicles available in owner-occupied houses - 2 Vehicles available (%)
Vehicles available in owner-occupied houses - 3 Vehicles available (%)
Vehicles available in owner-occupied houses - 4 Vehicles available (%)
Vehicles available in owner-occupied houses - 5+ Vehicles available (%)
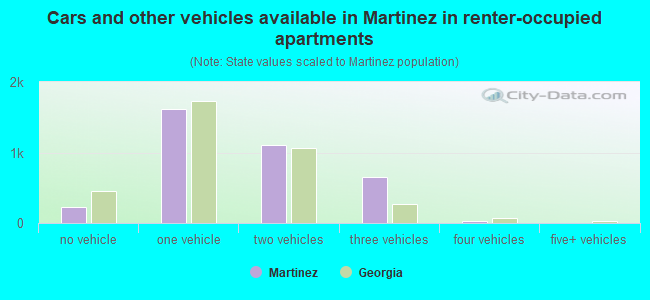
Vehicles available in renter-occupied houses - no vehicle available (%)
Vehicles available in renter-occupied houses - 1 vehicle available (%)
Vehicles available in renter-occupied houses - 2 Vehicles available (%)
Vehicles available in renter-occupied houses - 3 Vehicles available (%)
Vehicles available in renter-occupied houses - 4 Vehicles available (%)
Vehicles available in renter-occupied houses - 5+ Vehicles available (%)
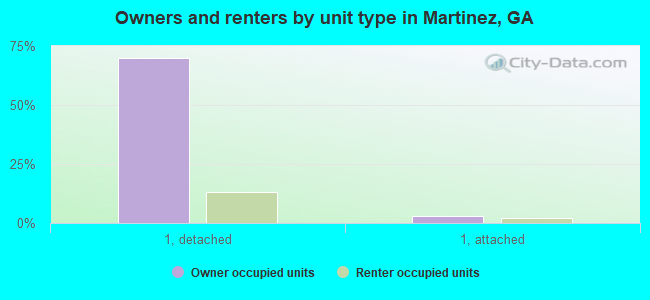
Housing units in structures - 1, detached (%)
Housing units in structures - 1, attached (%)
Housing units in structures - 2 (%)
Housing units in structures - 3 or 4 (%)
Housing units in structures - 5 to 9 (%)
Housing units in structures - 10 to 19 (%)
Housing units in structures - 20 to 49 (%)
Housing units in structures - 50 or more (%)
Housing units in structures - Mobile home (%)
Housing units in structures - Boat, RV, van, etc. (%)
Housing units in structures - Owners - 1, detached (%)
Housing units in structures - Owners - 1, attached (%)
Housing units in structures - Owners - 2 (%)
Housing units in structures - Owners - 3 or 4 (%)
Housing units in structures - Owners - 5 to 9 (%)
Housing units in structures - Owners - 10 to 19 (%)
Housing units in structures - Owners - 20 to 49 (%)
Housing units in structures - Owners - 50 or more (%)
Housing units in structures - Owners - Mobile home (%)
Housing units in structures - Owners - Boat, RV, van, etc. (%)
Housing units in structures - Renters - 1, detached (%)
Housing units in structures - Renters - 1, attached (%)
Housing units in structures - Renters - 2 (%)
Housing units in structures - Renters - 3 or 4 (%)
Housing units in structures - Renters - 5 to 9 (%)
Housing units in structures - Renters - 10 to 19 (%)
Housing units in structures - Renters - 20 to 49 (%)
Housing units in structures - Renters - 50 or more (%)
Housing units in structures - Renters - Mobile home (%)
Housing units in structures - Renters - Boat, RV, van, etc. (%)
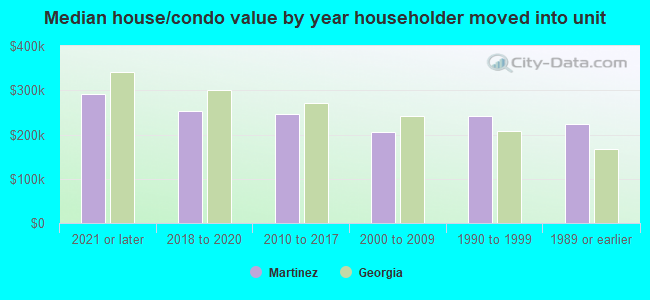
House/condo owner moved in on average (years ago)
Renter moved in on average (years ago)
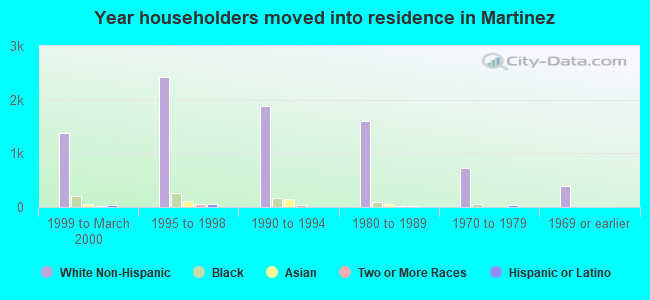
Year householder moved into unit - Moved in 1999 to March 2000 (%)
Year householder moved into unit - Moved in 1999 to March 2000 (%) - White
Year householder moved into unit - Moved in 1999 to March 2000 (%) - Black or African American
Year householder moved into unit - Moved in 1999 to March 2000 (%) - Asian
Year householder moved into unit - Moved in 1999 to March 2000 (%) - Hispanic or Latino
Year householder moved into unit - Moved in 1999 to March 2000 (%) - American Indian and Alaska Native
Year householder moved into unit - Moved in 1999 to March 2000 (%) - Multirace
Year householder moved into unit - Moved in 1999 to March 2000 (%) - Other Race
Year householder moved into unit - Moved in 1995 to 1998 (%)
Year householder moved into unit - Moved in 1995 to 1998 (%) - White
Year householder moved into unit - Moved in 1995 to 1998 (%) - Black or African American
Year householder moved into unit - Moved in 1995 to 1998 (%) - Asian
Year householder moved into unit - Moved in 1995 to 1998 (%) - Hispanic or Latino
Year householder moved into unit - Moved in 1995 to 1998 (%) - American Indian and Alaska Native
Year householder moved into unit - Moved in 1995 to 1998 (%) - Multirace
Year householder moved into unit - Moved in 1995 to 1998 (%) - Other Race
Year householder moved into unit - Moved in 1990 to 1994 (%)
Year householder moved into unit - Moved in 1990 to 1994 (%) - White
Year householder moved into unit - Moved in 1990 to 1994 (%) - Black or African American
Year householder moved into unit - Moved in 1990 to 1994 (%) - Asian
Year householder moved into unit - Moved in 1990 to 1994 (%) - Hispanic or Latino
Year householder moved into unit - Moved in 1990 to 1994 (%) - American Indian and Alaska Native
Year householder moved into unit - Moved in 1990 to 1994 (%) - Multirace
Year householder moved into unit - Moved in 1990 to 1994 (%) - Other Race
Year householder moved into unit - Moved in 1980 to 1989 (%)
Year householder moved into unit - Moved in 1980 to 1989 (%) - White
Year householder moved into unit - Moved in 1980 to 1989 (%) - Black or African American
Year householder moved into unit - Moved in 1980 to 1989 (%) - Asian
Year householder moved into unit - Moved in 1980 to 1989 (%) - Hispanic or Latino
Year householder moved into unit - Moved in 1980 to 1989 (%) - American Indian and Alaska Native
Year householder moved into unit - Moved in 1980 to 1989 (%) - Multirace
Year householder moved into unit - Moved in 1980 to 1989 (%) - Other Race
Year householder moved into unit - Moved in 1970 to 1979 (%)
Year householder moved into unit - Moved in 1970 to 1979 (%) - White
Year householder moved into unit - Moved in 1970 to 1979 (%) - Black or African American
Year householder moved into unit - Moved in 1970 to 1979 (%) - Asian
Year householder moved into unit - Moved in 1970 to 1979 (%) - Hispanic or Latino
Year householder moved into unit - Moved in 1970 to 1979 (%) - American Indian and Alaska Native
Year householder moved into unit - Moved in 1970 to 1979 (%) - Multirace
Year householder moved into unit - Moved in 1970 to 1979 (%) - Other Race
Year householder moved into unit - Moved in 1969 or earlier (%)
Year householder moved into unit - Moved in 1969 or earlier (%) - White
Year householder moved into unit - Moved in 1969 or earlier (%) - Black or African American
Year householder moved into unit - Moved in 1969 or earlier (%) - Asian
Year householder moved into unit - Moved in 1969 or earlier (%) - Hispanic or Latino
Year householder moved into unit - Moved in 1969 or earlier (%) - American Indian and Alaska Native
Year householder moved into unit - Moved in 1969 or earlier (%) - Multirace
Year householder moved into unit - Moved in 1969 or earlier (%) - Other Race
Housing units lacking complete plumbing facilities (%)
Housing units lacking complete kitchen facilities (%)
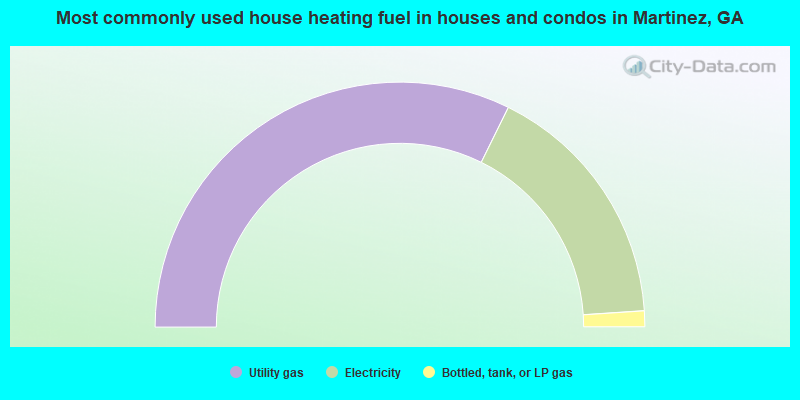
House heating fuel used in houses and condos - Utility gas (%)
House heating fuel used in houses and condos - Bottled, tank, or LP gas (%)
House heating fuel used in houses and condos - Electricity (%)
House heating fuel used in houses and condos - Fuel oil, kerosene, etc. (%)
House heating fuel used in houses and condos - Coal or coke (%)
House heating fuel used in houses and condos - Wood (%)
House heating fuel used in houses and condos - Solar energy (%)
House heating fuel used in houses and condos - Other fuel (%)
House heating fuel used in houses and condos - No fuel used (%)
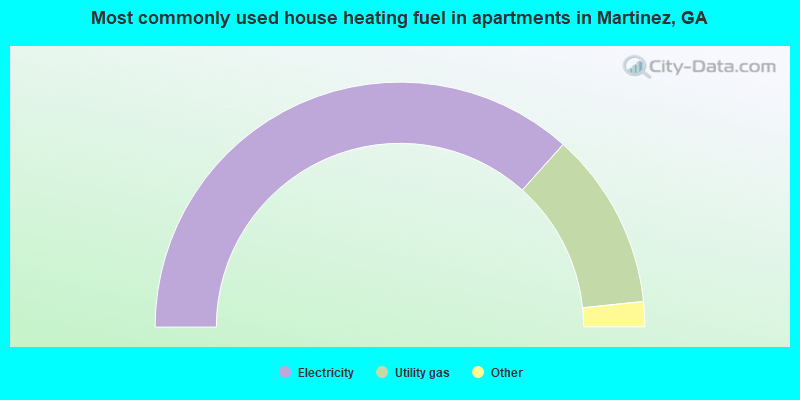
House heating fuel used in apartments - Utility gas (%)
House heating fuel used in apartments - Bottled, tank, or LP gas (%)
House heating fuel used in apartments - Electricity (%)
House heating fuel used in apartments - Fuel oil, kerosene, etc. (%)
House heating fuel used in apartments - Coal or coke (%)
House heating fuel used in apartments - Wood (%)
House heating fuel used in apartments - Solar energy (%)
House heating fuel used in apartments - Other fuel (%)
House heating fuel used in apartments - No fuel used (%)
Latest news about housing in Martinez, GA collected exclusively by city-data.com from local newspapers, TV, and radio stations
Median year house/condo built: 1988Median year apartment built: 1986Household type by relationship:
Households: 34,956
Male householders: 5,932 (1,428 living alone ), Female householders: 6,454 (1,965 living alone )6,363 spouses (6,307 opposite-sex spouses ), 685 unmarried partners , (666 opposite-sex unmarried partners ), 11,832 children (10,756 natural , 406 adopted , 669 stepchildren ), 537 grandchildren , 283 brothers or sisters , 1,214 parents , 0 foster children , 652 other relatives , 919 non-relatives In group quarters: 81
Size of family households: 3,765 2-persons , 2,241 3-persons , 1,778 4-persons , 936 5-persons , 312 6-persons , 66 7-or-more-persons .
Size of nonfamily households: 3,476 1-person , 370 2-persons , 93 3-persons , 4 4-persons .
4,826 married couples with children. single-parent households (606 men , 2,092 women ).
87.4% of residents of Martinez speak English at home. of residents speak Spanish at home (82% speak English very well , 8% speak English well , 9% speak English not well , 1% don't speak English at all ).of residents speak other Indo-European language at home (83% speak English very well , 13% speak English well , 4% speak English not well ).of residents speak Asian or Pacific Island language at home (63% speak English very well , 27% speak English well , 8% speak English not well , 2% don't speak English at all ).of residents speak other language at home (86% speak English very well , 1% speak English well , 12% speak English not well ).
Foreign born population: 3,837 (11.0%)of them are naturalized citizens )
Median number of rooms in houses and condos:
Median number of rooms in apartments
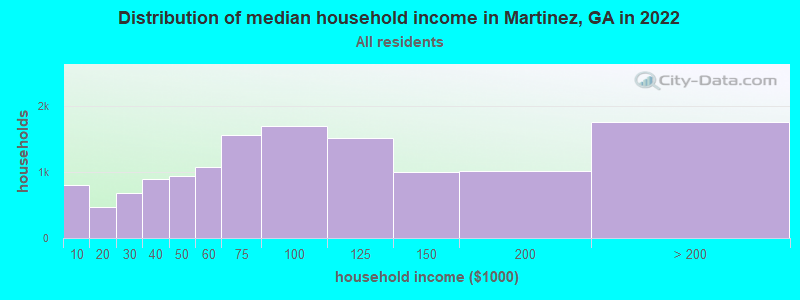
Martinez, GA household income distribution 795 Less than $10,000474 $10,000 to $19,999672 $20,000 to $29,999896 $30,000 to $39,999931 $40,000 to $49,9991,075 $50,000 to $59,9991,548 $60,000 to $74,9991,693 $75,000 to $99,9991,517 $100,000 to $124,999998 $125,000 to $149,9991,006 $150,000 to $199,9991,751 $200,000 or more
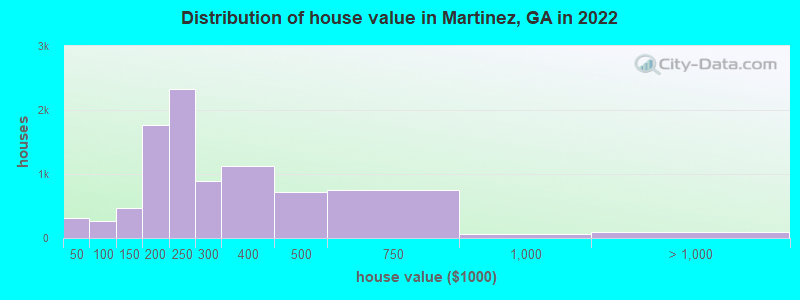
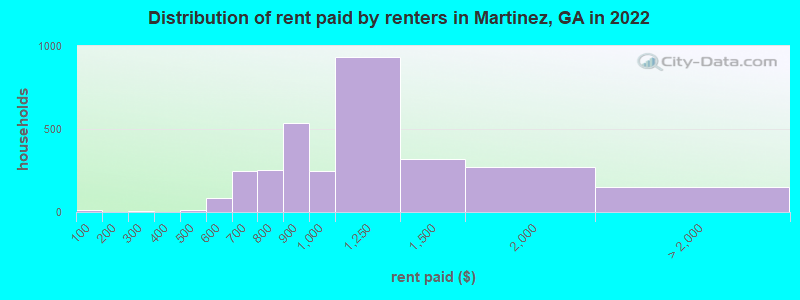
Home value of owner - occupied houses in 2022 in Martinez, GA 107 Less than $10,00030 $10,000 to $14,9997 $15,000 to $19,99912 $20,000 to $24,99930 $30,000 to $34,99925 $35,000 to $39,99998 $40,000 to $49,99911 $50,000 to $59,99977 $80,000 to $89,99983 $90,000 to $99,999192 $100,000 to $124,999274 $125,000 to $149,999954 $150,000 to $174,999808 $175,000 to $199,9992,322 $200,000 to $249,999893 $250,000 to $299,9991,118 $300,000 to $399,999724 $400,000 to $499,999751 $500,000 to $749,99955 $750,000 to $999,99968 $1,000,000 to $1,499,99918 $2,000,000 or moreRent paid by renters in 2022 in Martinez, GA 12 Less than $1006 $250 to $2993 $350 to $39913 $450 to $49927 $500 to $54957 $550 to $599236 $600 to $6497 $650 to $69930 $700 to $749222 $750 to $799536 $800 to $899246 $900 to $999933 $1,000 to $1,249316 $1,250 to $1,499274 $1,500 to $1,99916 $3,500 or more136 No cash rent
Percentage of workers working in this county: 50.1%Number of people working at home: 1,475 (8.7% of all workers )
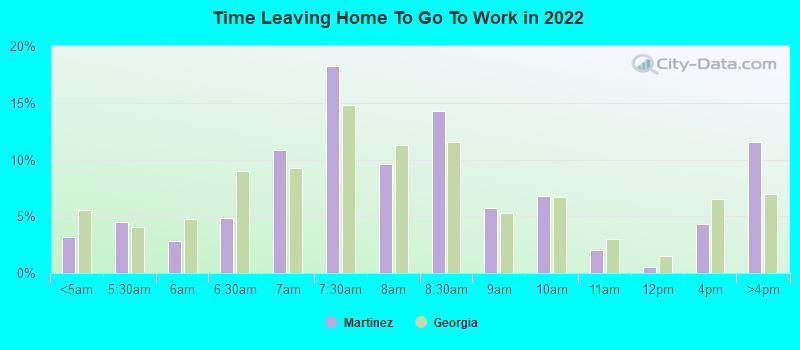
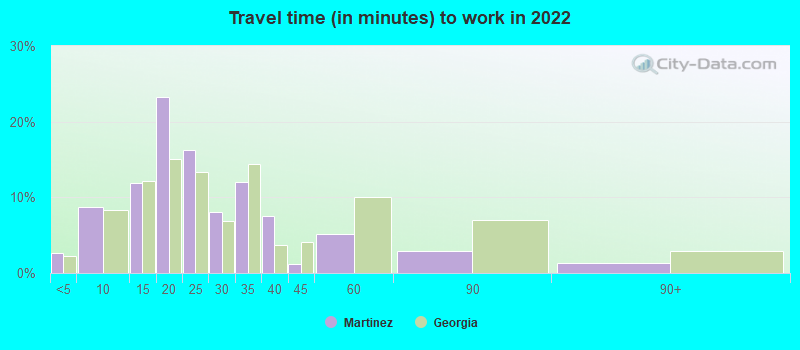
Travel time to work (commute)
Less than 5 minutes: 4335 to 9 minutes: 1,57010 to 14 minutes: 1,97115 to 19 minutes: 2,97720 to 24 minutes: 3,00025 to 29 minutes: 96630 to 34 minutes: 1,64135 to 39 minutes: 20640 to 44 minutes: 21545 to 59 minutes: 85560 to 89 minutes: 52690 or more minutes: 178
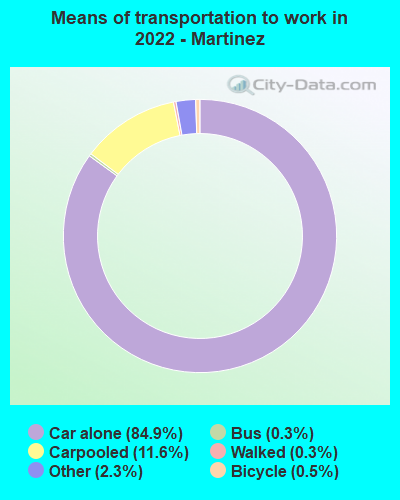
Means of transportation to work:
Drove a car alone: 9,704 (74.0%)Carpooled: 1,386 (10.6%)Bus : 27 (0.2%)Taxi: 283 (2.2%)Bicycle: 51 (0.4%)Walked: 39 (0.3%)Worked at home: 1,475 (11.3%)
Unemployment by race in 2022
Unemployment rate for White non-Hispanic residents 4.4% Males1.6% FemalesUnemployment rate for Black residents 3.9% Males1.0% FemalesUnemployment rate for American Indian and Alaska Native residents 100.0% FemalesUnemployment rate for Asian residents 14.8% Males5.0% FemalesUnemployment rate for other race residents 15.2% MalesUnemployment rate for two or more race residents 3.1% MalesUnemployment rate for Hispanic or Latino residents 3.8% Males2.2% Females
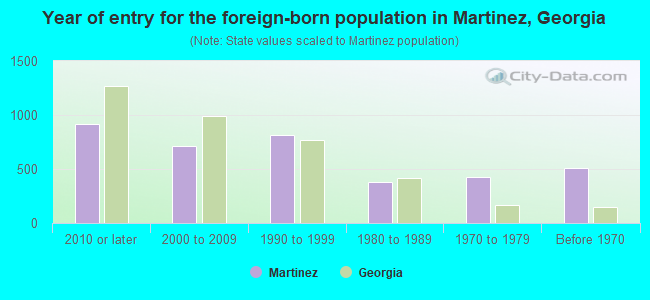
Year of entry for the foreign-born population in Martinez, Georgia
919 2010 or later 710 2000 to 2009 819 1990 to 1999 382 1980 to 1989 425 1970 to 1979 513 Before 1970
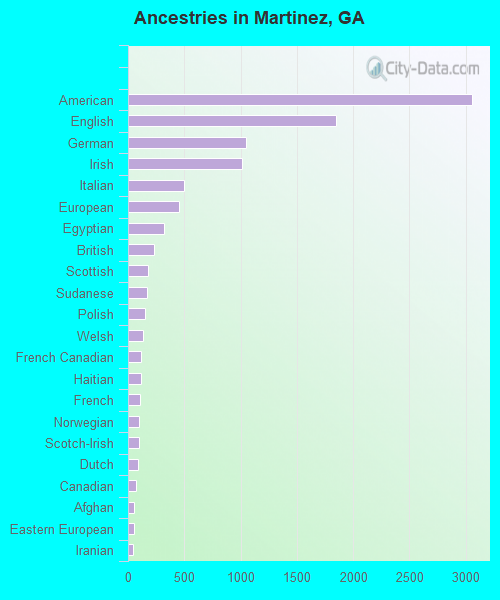
First ancestries reported:
American: 3,056 (17.4%)
English: 1,849 (10.6%)
German: 1,045 (6.0%)
Irish: 1,013 (5.8%)
Italian: 497 (2.8%)
European: 455 (2.6%)
Egyptian: 319 (1.8%)
British: 231 (1.3%)
Scottish: 176 (1.0%)
Sudanese: 166 (0.9%)
Polish: 153 (0.9%)
Welsh: 129 (0.7%)
French Canadian: 118 (0.7%)
Haitian: 113 (0.6%)
French: 106 (0.6%)
Norwegian: 99 (0.6%)
Scotch-Irish: 96 (0.5%)
Dutch: 88 (0.5%)
Canadian: 71 (0.4%)
Afghan: 56 (0.3%)
Eastern European: 49 (0.3%)
Iranian: 46 (0.3%)
Jamaican: 25 (0.1%)
Trinidadian and Tobagonian: 25 (0.1%)
Pennsylvania German: 22 (0.1%)
Russian: 20 (0.1%)
Hungarian: 19 (0.1%)
Slovak: 19 (0.1%)
Ukrainian: 19 (0.1%)
Finnish: 18 (0.1%)
Belizean: 17 (0.10%)
Armenian: 16 (0.09%)
African: 15 (0.09%)
Serbian: 14 (0.08%)
Swiss: 14 (0.08%)
Nigerian: 13 (0.07%)
Palestinian: 10 (0.06%)
Lebanese: 9 (0.05%)
Swedish: 8 (0.05%)
West Indian: 8 (0.05%)
Austrian: 6 (0.03%)
Portuguese: 5 (0.03%) Most common places of birth for foreign-born residents (%): India Martinez:
16.7% (606)Georgia:
9.2% (103,325)
Korea Martinez:
14.2% (517)Georgia:
3.9% (43,756)
Mexico Martinez:
9.4% (341)Georgia:
20.0% (223,400)
Egypt Martinez:
7.1% (257)Georgia:
0.3% (2,940)
Germany Martinez:
6.5% (235)Georgia:
1.7% (18,651)
Taiwan Martinez:
4.4% (159)Georgia:
0.6% (6,160)
Vietnam Martinez:
4.2% (153)Georgia:
4.1% (45,797)
China, excluding Hong Kong and Taiwan Martinez:
4.0% (146)Georgia:
3.5% (39,227)
Sudan Martinez:
3.9% (140)Georgia:
0.1% (1,212)
Canada Martinez:
3.6% (132)Georgia:
1.6% (17,851)
Poland Martinez:
2.9% (107)Georgia:
0.3% (3,179)
Bangladesh Martinez:
1.8% (65)Georgia:
0.7% (7,441)
Pakistan Martinez:
1.7% (60)Georgia:
1.1% (12,223)
Haiti Martinez:
1.6% (57)Georgia:
1.6% (17,476)
Philippines Martinez:
1.5% (55)Georgia:
1.8% (20,700)
Place of birth for U.S.-born residents:
This state: 16,125Other state: 13,861Northeast: 2,197Midwest: 3,381South: 6,851West: 1,479 84.0% of Martinez residents lived in the same house 1 years ago.
Out of people who lived in different houses, 20.0% lived in this county.
Out of people who lived in different counties, 49.1% lived in Georgia.
Martinez:
84.0%State average:
86.6%
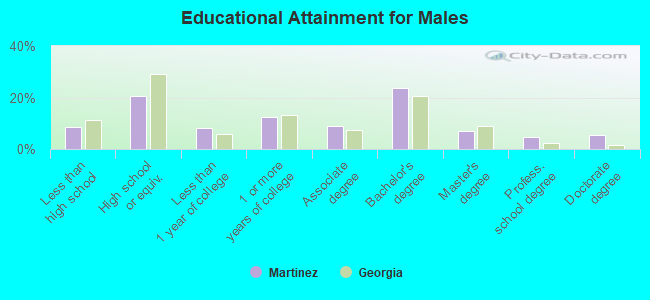
Education attainment for males 25 years and older:
No schooling: 325Nursery to 4th grade: 05th and 6th grade: 07th and 8th grade: 29th grade: 12110th grade: 2011th grade: 11012th grade, no diploma: 412High school graduate (or equivalency): 2,359Less than 1 year of college: 952Some college more than 1 year, no degree: 1,436Associate degree: 1,028Bachelor's degree: 2,743Master's degree: 799Professional school degree: 552Doctorate degree: 647
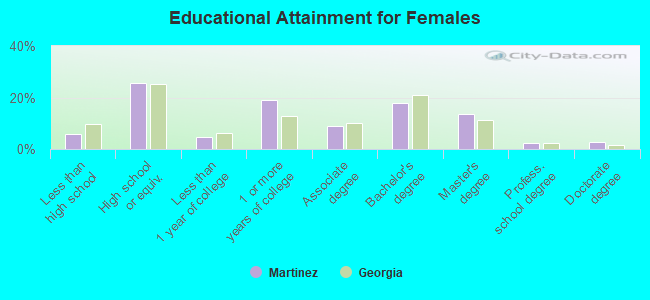
Education attainment for females 25 years and older:
No schooling: 97Nursery to 4th grade: 05th and 6th grade: 77th and 8th grade: 2379th grade: 21810th grade: 6111th grade: 7512th grade, no diploma: 85High school graduate (or equivalency): 3,362Less than 1 year of college: 605Some college more than 1 year, no degree: 2,484Associate degree: 1,164Bachelor's degree: 2,337Master's degree: 1,793Professional school degree: 288Doctorate degree: 349
Housing units in structures:
One, detached: 11,871One, attached: 760Two: 753 or 4: 6625 to 9: 50010 to 19: 62220 to 49: 13050 or more: 163Mobile homes: 68Median worth of mobile homes: $46,364
Housing units lacking complete plumbing facilities in 2022: 1.1%Housing units lacking complete kitchen facilities in 2022: 1.8%House/condo owner moved in on average 13 years ago
Renter moved in on average 1 years ago
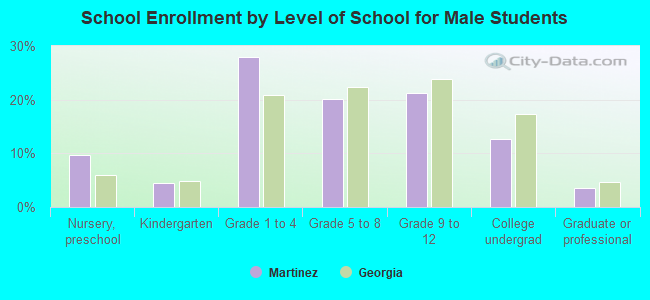
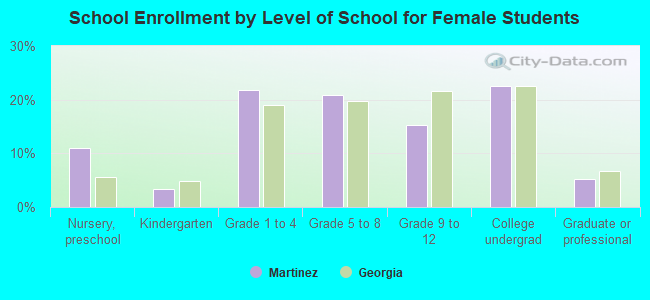
Private vs. public school enrollment:
Students in private schools in grades 1 to 8 (elementary and middle school): 543 Students in private schools in grades 9 to 12 (high school): 206 Students in private undergraduate colleges: 283