Housing density: 1,539 houses/condos per square mile
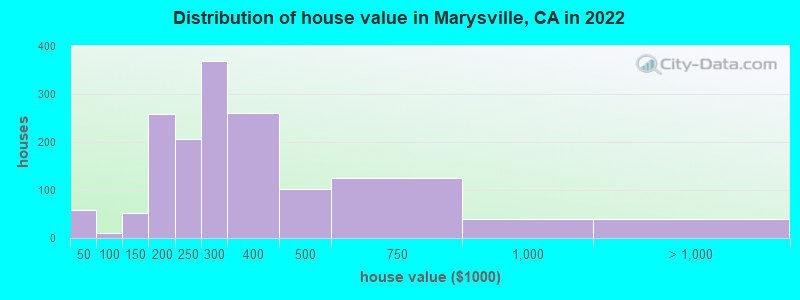
Median price asked for vacant for-sale houses and condos in 2022: $340,079.
Median contract rent in 2022: $932 (lower quartile is $641, upper quartile is $1,128)
Median rent asked for vacant for-rent units in 2022: $1,050
Median gross rent in Marysville, CA in 2022: $1,085
Housing units in Marysville with a mortgage: 1,460 (51 second mortgage, 0 home equity loan, 56 both second mortgage and home equity loan) Houses without a mortgage: 57
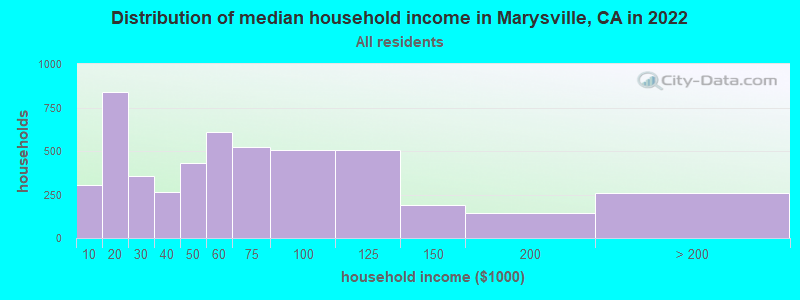
Median household income for houses/condos with a mortgage: $77,280
Median household income for apartments without a mortgage: $55,358
Size of family households: 1,286 2-persons, 768 3-persons, 409 4-persons, 337 5-persons, 318 6-persons, 15 7-or-more-persons.
Size of nonfamily households: 1,573 1-person, 224 2-persons, 7 3-persons.
1,622 married couples with children.
1,918 single-parent households (180 men, 1,738 women).
74.6% of residents of Marysville speak English at home.
16.7% of residents speak Spanish at home (55% speak English very well, 23% speak English well, 18% speak English not well, 5% don't speak English at all).
2.2% of residents speak other Indo-European language at home (40% speak English very well, 12% speak English well, 28% speak English not well, 21% don't speak English at all).
5.7% of residents speak Asian or Pacific Island language at home (69% speak English very well, 18% speak English well, 13% speak English not well).
0.1% of residents speak other language at home (46% speak English well, 54% don't speak English at all).
Foreign born population: 1,588 (12.1%)
(55.5% of them are naturalized citizens)
Percentage of workers working in this county: 37.3% Number of people working at home: 215 (4.3% of all workers)
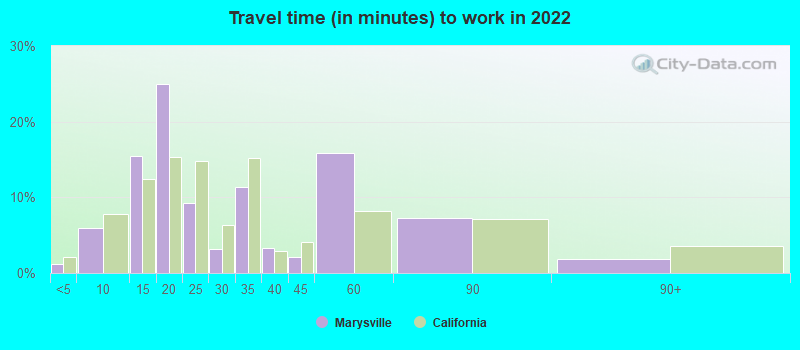
Travel time to work (commute)
Less than 5 minutes: 77
5 to 9 minutes: 545
10 to 14 minutes: 810
15 to 19 minutes: 828
20 to 24 minutes: 229
25 to 29 minutes: 254
30 to 34 minutes: 347
35 to 39 minutes: 96
40 to 44 minutes: 224
45 to 59 minutes: 1,141
60 to 89 minutes: 217
90 or more minutes: 308
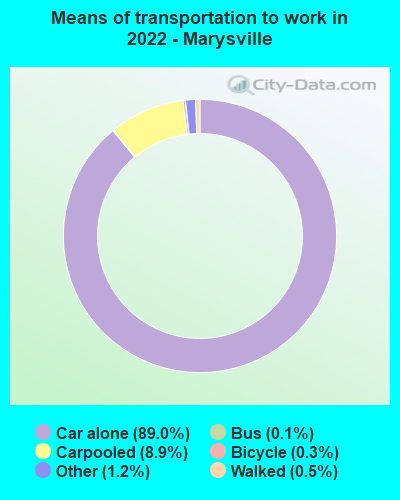
Means of transportation to work:
Drove a car alone: 6,691 (83.4%)
Carpooled: 723 (9.0%)
Bus: 8 (0.1%)
Taxi: 94 (1.2%)
Bicycle: 22 (0.3%)
Walked: 35 (0.4%)
Worked at home: 215 (2.7%)
Unemployment by race in 2022
Unemployment rate for White non-Hispanic residents
3.6%Males
7.5%Females
Unemployment rate for Asian residents
9.7%Males
15.0%Females
Unemployment rate for other race residents
5.3%Females
Unemployment rate for two or more race residents
22.6%Males
2.3%Females
Unemployment rate for Hispanic or Latino residents
3.7%Males
5.1%Females
Year of entry for the foreign-born population in Marysville, California
3862010 or later
3342000 to 2009
4831990 to 1999
5281980 to 1989
2491970 to 1979
188Before 1970
First ancestries reported:
American: 323 (6.7%)
German: 323 (6.7%)
European: 256 (5.3%)
Irish: 229 (4.8%)
Italian: 150 (3.1%)
English: 129 (2.7%)
Afghan: 114 (2.4%)
Portuguese: 93 (1.9%)
French: 91 (1.9%)
British: 71 (1.5%)
Norwegian: 38 (0.8%)
Russian: 22 (0.5%)
Swiss: 21 (0.4%)
Slavic: 20 (0.4%)
Ukrainian: 18 (0.4%)
Moroccan: 14 (0.3%)
Scandinavian: 13 (0.3%)
Scottish: 13 (0.3%)
Haitian: 10 (0.2%)
Swedish: 9 (0.2%)
Scotch-Irish: 8 (0.2%)
Welsh: 8 (0.2%)
Northern European: 7 (0.1%)
Polish: 7 (0.1%)
Armenian: 6 (0.1%)
French Canadian: 6 (0.1%)
Most common places of birth for foreign-born residents (%):
Mexico
Marysville:
52.0% (868)
California:
37.2% (3,881,193)
Afghanistan
Marysville:
10.6% (177)
California:
0.5% (53,260)
Philippines
Marysville:
6.1% (102)
California:
7.8% (818,297)
India
Marysville:
4.5% (75)
California:
5.2% (539,184)
China, excluding Hong Kong and Taiwan
Marysville:
3.5% (59)
California:
6.6% (684,672)
Asia, n.e.c.
Marysville:
3.2% (53)
California:
0.1% (11,122)
Spain
Marysville:
2.8% (47)
California:
0.2% (16,586)
Thailand
Marysville:
2.8% (46)
California:
0.6% (65,335)
Vietnam
Marysville:
2.6% (43)
California:
4.9% (512,335)
Laos
Marysville:
2.2% (37)
California:
0.5% (48,911)
Guatemala
Marysville:
2.0% (33)
California:
2.8% (290,436)
Place of birth for U.S.-born residents:
This state: 9,948
Other state: 1,619
Northeast: 288
Midwest: 302
South: 260
West: 743
87.7% of Marysville residents lived in the same house 1 years ago. Out of people who lived in different houses, 22.6% lived in this county. Out of people who lived in different counties, 92.5% lived in California.
Marysville:
87.7%
State average:
88.9%
Education attainment for males 25 years and older:
No schooling: 181
Nursery to 4th grade: 67
5th and 6th grade: 21
7th and 8th grade: 46
9th grade: 46
10th grade: 115
11th grade: 31
12th grade, no diploma: 158
High school graduate (or equivalency): 1,476
Less than 1 year of college: 147
Some college more than 1 year, no degree: 778
Associate degree: 463
Bachelor's degree: 265
Master's degree: 171
Professional school degree: 80
Doctorate degree: 0
Education attainment for females 25 years and older:
No schooling: 129
Nursery to 4th grade: 50
5th and 6th grade: 36
7th and 8th grade: 111
9th grade: 21
10th grade: 71
11th grade: 46
12th grade, no diploma: 155
High school graduate (or equivalency): 917
Less than 1 year of college: 504
Some college more than 1 year, no degree: 971
Associate degree: 618
Bachelor's degree: 738
Master's degree: 103
Professional school degree: 63
Doctorate degree: 0
Housing units in structures:
One, detached: 2,383
One, attached: 527
Two: 212
3 or 4: 721
5 to 9: 485
10 to 19: 403
20 to 49: 369
50 or more: 291
Housing units lacking complete plumbing facilities in 2022: 0.6%
Housing units lacking complete kitchen facilities in 2022: 2.8%
House/condo owner moved in on average 13 years ago