Marysville, MI (Michigan) Houses and Residents
| Marysville: | $186,484 |
| Michigan: | $224,400 |
Total population: 9,793 (Urban population: 9,724, Rural population: 0)
Houses: 4,670 (4,379 occupied: 3,907 owner occupied, 640 renter occupied)
| % of renters here: | 14% |
| State: | 27% |
Housing density: 673 houses/condos per square mile
Median price asked for vacant for-sale houses and condos in 2022: $133,605.
Median contract rent in 2022: $825 (lower quartile is $710, upper quartile is $936)
Median rent asked for vacant for-rent units in 2022: $1,446
Median gross rent in Marysville, MI in 2022: $969
Housing units in Marysville with a mortgage: 2,182 (136 second mortgage, 3 home equity loan, 114 both second mortgage and home equity loan)
Houses without a mortgage: 16
Median household income for houses/condos with a mortgage: $84,523
Median household income for apartments without a mortgage: $47,178
Median monthly housing costs: $986
Compare current foreclosures near Marysville, MI:
| Photo | Address | Area | Beds / Baths | Price | Details |
|---|---|---|---|---|---|

|
#1
Rosewood Dr
Marysville, MI 48040
|
- sq. feet
|
- baths - beds |
show details | |

|
#2
Illinois St
Marysville, MI 48040
|
- sq. feet
|
- baths - beds |
show details | |

|
#3
River Rd Apt G-5
Marysville, MI 48040
|
- sq. feet
|
- baths - beds |
show details | |

|
#4
Illinois St
Marysville, MI 48040
|
- sq. feet
|
- baths - beds |
show details | |

|
#5
Koula Rd
Marysville, MI 48040
|
- sq. feet
|
- baths - beds |
show details | |

|
#6
Karla Ln
Marysville, MI 48040
|
- sq. feet
|
- baths - beds |
show details | |

|
#7
18th St
Marysville, MI 48040
|
- sq. feet
|
- baths - beds |
show details | |

|
#8
Range Rd
Marysville, MI 48040
|
- sq. feet
|
- baths - beds |
show details | |

|
#9
Joanwood Dr
Marysville, MI 48040
|
- sq. feet
|
- baths - beds |
show details | |

|
#10
Ravenswood Rd
Marysville, MI 48040
|
- sq. feet
|
- baths - beds |
show details |
| Photo | Address | Area | Beds / Baths | Price | Details |
|---|---|---|---|---|---|

|
#11
New York Ave
Marysville, MI 48040
|
- sq. feet
|
- baths - beds |
show details | |

|
#12
Saint James St
Marysville, MI 48040
|
- sq. feet
|
- baths - beds |
show details | |

|
#13
Rattle Run Rd
Saint Clair, MI 48079
|
1,188 sq. feet
|
1 baths 3 beds |
show details | |

|
#14
Military St
Port Huron, MI 48060
|
3,000 sq. feet
|
3 baths 5 beds |
show details | |

|
#15
Wadhams Rd
Smiths Creek, MI 48074
|
1,081 sq. feet
|
1 baths 3 beds |
show details | |

|
#16
7th St
Port Huron, MI 48060
|
1,512 sq. feet
|
1 baths 3 beds |
show details | |

|
#17
Lewis Dr
Port Huron, MI 48060
|
1,196 sq. feet
|
1 baths 3 beds |
show details | |

|
#18
Taylor St
Port Huron, MI 48060
|
- sq. feet
|
1 baths 3 beds |
show details | |

|
#19
Crawford Rd
Columbus, MI 48063
|
1,700 sq. feet
|
2 baths 3 beds |
show details | |

|
#20
Richman Rd
Smiths Creek, MI 48074
|
1,183 sq. feet
|
1 baths 3 beds |
show details |
| Photo | Address | Area | Beds / Baths | Price | Details |
|---|---|---|---|---|---|

|
#21
Briggeman Rd
Saint Clair, MI 48079
|
1,448 sq. feet
|
1 baths 4 beds |
show details | |

|
#22
Gratiot Ave
Port Huron, MI 48060
|
1,260 sq. feet
|
1 baths 3 beds |
show details | |

|
#23
Robert St
Memphis, MI 48041
|
1,310 sq. feet
|
1 baths 4 beds |
show details | |

|
#24
Electric Ave
Port Huron, MI 48060
|
- sq. feet
|
1 baths 3 beds |
show details | |

|
#25
Westminister St
Marine City, MI 48039
|
1,041 sq. feet
|
1 baths 3 beds |
show details | |

|
#26
Chestnut St
Port Huron, MI 48060
|
- sq. feet
|
1 baths 3 beds |
show details | |

|
#27
Dove Rd
Smiths Creek, MI 48074
|
1,680 sq. feet
|
2 baths - beds |
show details | |

|
#28
Griswold Rd
Smiths Creek, MI 48074
|
1,384 sq. feet
|
1 baths - beds |
show details | |

|
#29
Ravenswood Rd
Smiths Creek, MI 48074
|
1,108 sq. feet
|
1 baths - beds |
show details | |

|
#30
Circle Ln
Richmond, MI 48062
|
1,522 sq. feet
|
1 baths - beds |
show details |
| Photo | Address | Area | Beds / Baths | Price | Details |
|---|---|---|---|---|---|

|
#31
Wildwood Ln
Smiths Creek, MI 48074
|
1,344 sq. feet
|
1 baths - beds |
show details | |

|
#32
Richman Rd
Smiths Creek, MI 48074
|
1,632 sq. feet
|
1 baths - beds |
show details | |

|
#33
Ravenswood Rd
Smiths Creek, MI 48074
|
1,300 sq. feet
|
1 baths - beds |
show details | |

|
#34
Pickford Rd
Smiths Creek, MI 48074
|
1,420 sq. feet
|
1 baths - beds |
show details | |

|
#35
E Village Ln
Port Huron, MI 48060
|
- sq. feet
|
- baths - beds |
show details | |

|
#36
Krafft Rd Apt 605
Port Huron, MI 48060
|
- sq. feet
|
- baths - beds |
show details | |

|
#37
Ojibway Dr
Fort Gratiot, MI 48059
|
- sq. feet
|
- baths - beds |
show details | |

|
#38
W Water St Apt B
Port Huron, MI 48060
|
- sq. feet
|
- baths - beds |
show details | |

|
#39
Beach Rd Apt 7
Port Huron, MI 48060
|
- sq. feet
|
- baths - beds |
show details | |

|
#40
W Water St Apt A
Port Huron, MI 48060
|
- sq. feet
|
- baths - beds |
show details |
| Photo | Address | Area | Beds / Baths | Price | Details |
|---|---|---|---|---|---|

|
#41
Beach Rd Apt 10
Port Huron, MI 48060
|
- sq. feet
|
- baths - beds |
show details | |

|
#42
Huron Ave # 314a
Port Huron, MI 48060
|
- sq. feet
|
- baths - beds |
show details | |

|
#43
Pittsburgh St
Marine City, MI 48039
|
- sq. feet
|
- baths - beds |
show details | |

|
#44
Laguna Dr
Fort Gratiot, MI 48059
|
- sq. feet
|
- baths - beds |
show details | |

|
#45
Rural St
Port Huron, MI 48060
|
- sq. feet
|
- baths - beds |
show details | |

|
#46
Rural St
Port Huron, MI 48060
|
- sq. feet
|
- baths - beds |
show details | |

|
#47
17th St
Port Huron, MI 48060
|
- sq. feet
|
- baths - beds |
show details | |

|
#48
Nelson St
Port Huron, MI 48060
|
- sq. feet
|
- baths - beds |
show details | |

|
#49
Memoir Dr
Fort Gratiot, MI 48059
|
- sq. feet
|
- baths - beds |
show details | |

|
Check over 1 million property listings on Foreclosure.com!
|
browse all offers | |||

Latest news about housing in Marysville, MI collected exclusively by city-data.com from local newspapers, TV, and radio stations

 | Marysville Summer Housing needed for July and August 2018 (1 reply) |
| Port Huron area: Marysville or St Clair? (1 reply) |
| Port Huron Apartments (6 replies) |
| Need a good rental in a good school district (27 replies) |
| Top 25 Michigan suburbs for families (6 replies) |
| Job re-location to Port Huron..need advice on best places to live (5 replies) |

Median year apartment built: 1972
Household type by relationship:
Households: 9,966- Male householders: 2,203 (444 living alone), Female householders: 2,136 (930 living alone)
2,152 spouses (2,106 opposite-sex spouses), 274 unmarried partners, (274 opposite-sex unmarried partners), 2,861 children (2,737 natural, 55 adopted, 67 stepchildren), 89 grandchildren, 63 brothers or sisters, 19 parents, 0 foster children, 39 other relatives, 119 non-relatives
- In group quarters: 3
Size of family households: 1,521 2-persons, 652 3-persons, 444 4-persons, 210 5-persons, 30 6-persons, 105 7-or-more-persons.
Size of nonfamily households: 1,486 1-person, 95 2-persons, 16 3-persons, 22 4-persons.
1,381 married couples with children.
697 single-parent households (374 men, 323 women).
98.1% of residents of Marysville speak English at home.
0.1% of residents speak Spanish at home (100% speak English very well).
0.8% of residents speak other Indo-European language at home (86% speak English very well, 14% speak English not well).
0.5% of residents speak Asian or Pacific Island language at home (9% speak English very well, 26% speak English well, 65% speak English not well).
0.3% of residents speak other language at home (100% speak English very well).
Foreign born population: 248 (2.5%)
(53.6% of them are naturalized citizens)
| Here: | 6.0 |
| State: | 6.5 |
| Here: | 4.0 |
| State: | 4.3 |

- Bedrooms in owner-occupied houses and condos in Marysville, Michigan
- 0no bedroom
- 271 bedroom
- 1,1172 bedrooms
- 2,0683 bedrooms
- 5934 bedrooms
- 1025+ bedrooms

- Bedrooms in renter-occupied apartments in Marysville, Michigan
- 56no bedroom
- 2871 bedroom
- 1752 bedrooms
- 1163 bedrooms
- 74 bedrooms
- 05+ bedrooms

- Cars and other vehicles available in Marysville in owner-occupied houses/condos
- 84no vehicle
- 1,2171 vehicle
- 1,4792 vehicles
- 8703 vehicles
- 2084 vehicles
- 495+ vehicles

- Cars and other vehicles available in Marysville in renter-occupied apartments
- 77no vehicle
- 3631 vehicle
- 1502 vehicles
- 503 vehicles
- 04 vehicles
- 05+ vehicles

- Rooms in owner-occupied houses in Marysville, Michigan
- 01 room
- 02 rooms
- 973 rooms
- 4094 rooms
- 9815 rooms
- 9166 rooms
- 5857 rooms
- 4188 rooms
- 5009+ rooms

- Rooms in renter-occupied apartments in Marysville, Michigan
- 561 room
- 02 rooms
- 1933 rooms
- 1534 rooms
- 815 rooms
- 846 rooms
- 427 rooms
- 08 rooms
- 349+ rooms


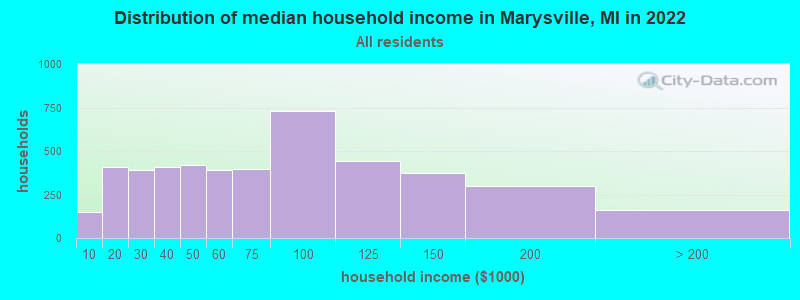
Marysville, MI household income distribution

- 147Less than $10,000
- 408$10,000 to $19,999
- 392$20,000 to $29,999
- 408$30,000 to $39,999
- 417$40,000 to $49,999
- 391$50,000 to $59,999
- 397$60,000 to $74,999
- 730$75,000 to $99,999
- 445$100,000 to $124,999
- 376$125,000 to $149,999
- 298$150,000 to $199,999
- 159$200,000 or more
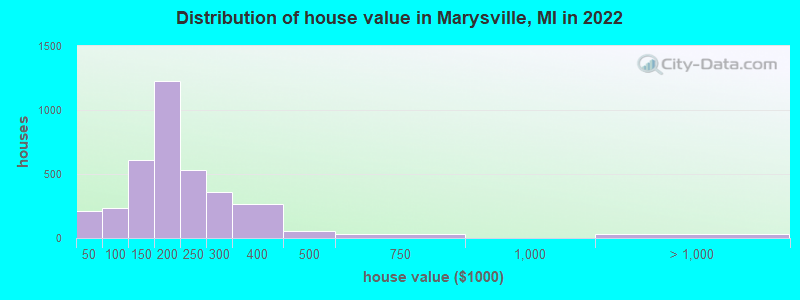
Home value of owner - occupied houses in 2022 in Marysville, MI
-
- 66Less than $10,000
- 18$10,000 to $14,999
- 26$15,000 to $19,999
- 37$20,000 to $24,999
- 12$25,000 to $29,999
- 47$30,000 to $34,999
- 26$50,000 to $59,999
- 44$70,000 to $79,999
- 106$80,000 to $89,999
- 60$90,000 to $99,999
- 273$100,000 to $124,999
- 334$125,000 to $149,999
- 700$150,000 to $174,999
- 523$175,000 to $199,999
- 530$200,000 to $249,999
- 359$250,000 to $299,999
- 264$300,000 to $399,999
- 51$400,000 to $499,999
- 31$500,000 to $749,999
- 24$1,000,000 to $1,499,999
- 5$2,000,000 or more
Rent paid by renters in 2022 in Marysville, MI
-
- 13$200 to $249
- 51$250 to $299
- 29$300 to $349
- 16$350 to $399
- 7$600 to $649
- 38$650 to $699
- 67$700 to $749
- 72$750 to $799
- 103$800 to $899
- 62$900 to $999
- 117$1,000 to $1,249
- 10$1,500 to $1,999
- 12$3,500 or more
- 24No cash rent


Percentage of workers working in this county: 73.1%
Number of people working at home: 460 (10.1% of all workers)
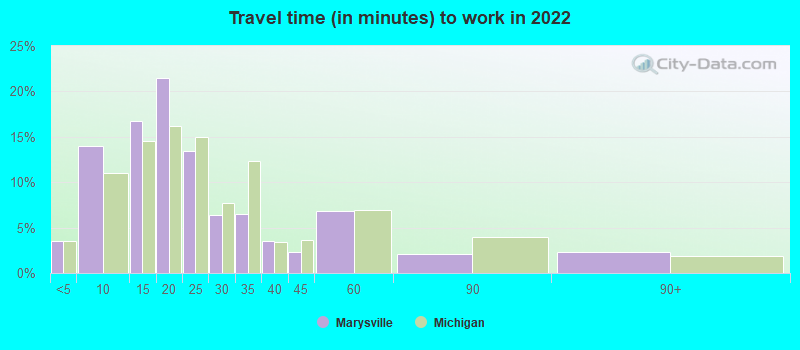
Travel time to work (commute)
- Less than 5 minutes: 221
- 5 to 9 minutes: 686
- 10 to 14 minutes: 697
- 15 to 19 minutes: 590
- 20 to 24 minutes: 455
- 25 to 29 minutes: 103
- 30 to 34 minutes: 371
- 35 to 39 minutes: 187
- 40 to 44 minutes: 184
- 45 to 59 minutes: 242
- 60 to 89 minutes: 299
- 90 or more minutes: 122
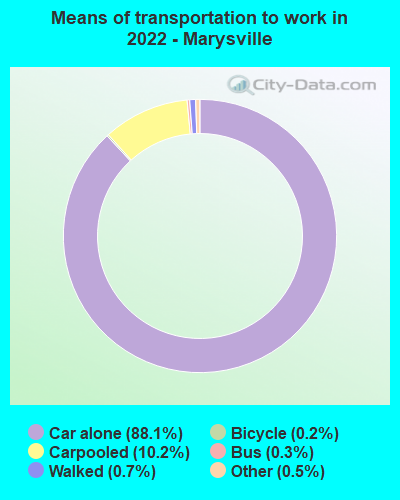
Means of transportation to work:
- Drove a car alone: 4,988 (79.8%)
- Carpooled: 581 (9.3%)
- Bus: 11 (0.2%)
- Taxi: 37 (0.6%)
- Bicycle: 13 (0.2%)
- Walked: 42 (0.7%)
- Worked at home: 460 (7.4%)

- Unemployment by race in 2022
- Unemployment rate for White non-Hispanic residents
- 2.8%Males
- 4.4%Females
- Unemployment rate for Hispanic or Latino residents
- 51.6%Males

- Year of entry for the foreign-born population in Marysville, Michigan
- 832010 or later
- 162000 to 2009
- 481990 to 1999
- 201980 to 1989
- 531970 to 1979
- 177Before 1970

First ancestries reported:
- German: 923 (21.7%)
- Polish: 605 (14.2%)
- English: 409 (9.6%)
- American: 373 (8.8%)
- Irish: 323 (7.6%)
- French: 162 (3.8%)
- Scottish: 162 (3.8%)
- Italian: 154 (3.6%)
- European: 121 (2.8%)
- Albanian: 110 (2.6%)
- Jamaican: 97 (2.3%)
- Dutch: 82 (1.9%)
- Eastern European: 71 (1.7%)
- French Canadian: 55 (1.3%)
- Norwegian: 49 (1.2%)
- Palestinian: 39 (0.9%)
- Assyrian: 32 (0.8%)
- Canadian: 29 (0.7%)
- Danish: 18 (0.4%)
- Swedish: 18 (0.4%)
- Greek: 14 (0.3%)
- Finnish: 13 (0.3%)
- Portuguese: 12 (0.3%)
- Scandinavian: 12 (0.3%)
- Syrian: 11 (0.3%)
- Welsh: 11 (0.3%)
- Slovak: 8 (0.2%)
- British: 7 (0.2%)
- Ukrainian: 6 (0.1%)
Most common places of birth for foreign-born residents (%):
| Marysville: | 28.8% (78) |
| Michigan: | 5.0% (35,052) |
| Marysville: | 17.0% (46) |
| Michigan: | 8.1% (55,954) |
| Marysville: | 13.7% (37) |
| Michigan: | 0.6% (4,087) |
| Marysville: | 10.7% (29) |
| Michigan: | 1.0% (6,730) |
| Marysville: | 8.1% (22) |
| Michigan: | 0.4% (3,074) |
| Marysville: | 4.8% (13) |
| Michigan: | 0.7% (4,645) |
| Marysville: | 2.6% (7) |
| Michigan: | 2.8% (19,112) |
| Marysville: | 2.6% (7) |
| Michigan: | 1.5% (10,225) |
| Marysville: | 1.8% (5) |
| Michigan: | 2.3% (16,126) |
Place of birth for U.S.-born residents:
- This state: 8,361
- Other state: 1,241
- Northeast: 193
- Midwest: 436
- South: 363
- West: 241
94.2% of Marysville residents lived in the same house 1 years ago.
Out of people who lived in different houses, 38.7% lived in this county.
Out of people who lived in different counties, 77.5% lived in Michigan.
| Marysville: | 94.2% |
| State average: | 88.4% |
Education attainment for males 25 years and older:
- No schooling: 66
- Nursery to 4th grade: 0
- 5th and 6th grade: 0
- 7th and 8th grade: 105
- 9th grade: 10
- 10th grade: 31
- 11th grade: 33
- 12th grade, no diploma: 55
- High school graduate (or equivalency): 857
- Less than 1 year of college: 342
- Some college more than 1 year, no degree: 722
- Associate degree: 307
- Bachelor's degree: 590
- Master's degree: 166
- Professional school degree: 26
- Doctorate degree: 16

Education attainment for females 25 years and older:
- No schooling: 37
- Nursery to 4th grade: 0
- 5th and 6th grade: 0
- 7th and 8th grade: 32
- 9th grade: 30
- 10th grade: 32
- 11th grade: 94
- 12th grade, no diploma: 27
- High school graduate (or equivalency): 938
- Less than 1 year of college: 293
- Some college more than 1 year, no degree: 525
- Associate degree: 804
- Bachelor's degree: 621
- Master's degree: 311
- Professional school degree: 45
- Doctorate degree: 8


Housing units in structures:
- One, detached: 3,078
- One, attached: 451
- Two: 91
- 3 or 4: 59
- 5 to 9: 292
- 10 to 19: 178
- 20 to 49: 34
- 50 or more: 152
- Mobile homes: 331
Median worth of mobile homes: $30,317
House/condo owner moved in on average 8 years ago
Renter moved in on average 3 years ago

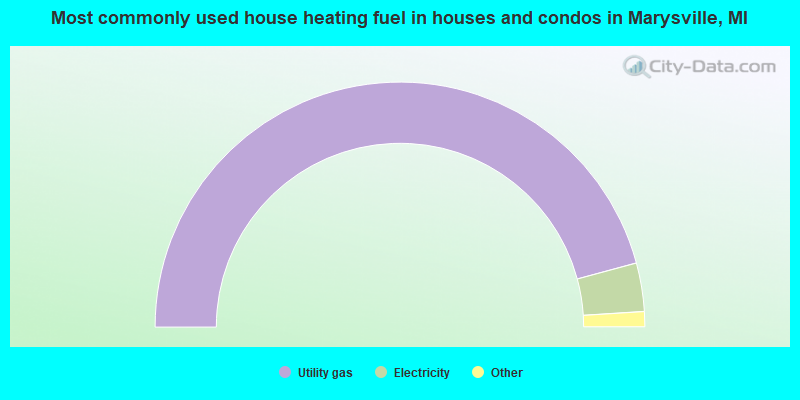
- 91.7%Utility gas
- 6.4%Electricity
- 1.7%Bottled, tank, or LP gas
- 0.2%Wood
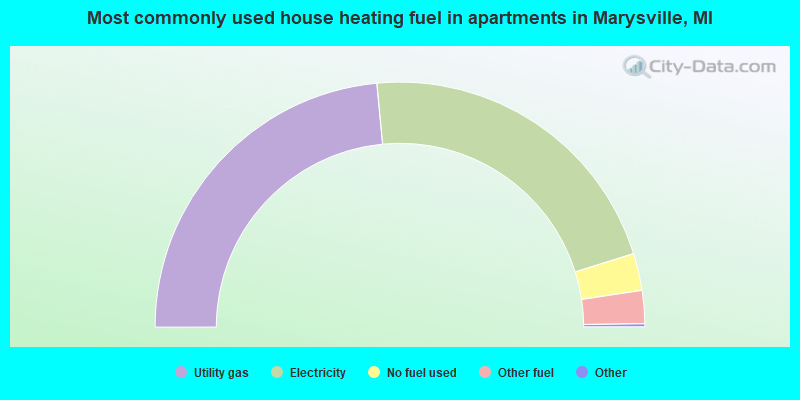
- 47.2%Utility gas
- 43.5%Electricity
- 4.9%No fuel used
- 4.4%Other fuel
Private vs. public school enrollment:
| Here: | 8.3% |
| Michigan: | 12.4% |
| Here: | 0.0% |
| Michigan: | 9.8% |
| Here: | 0.0% |
| Michigan: | 14.9% |


