Maryville, TN (Tennessee) Houses and Residents
| Maryville: | $331,759 |
| Tennessee: | $284,800 |
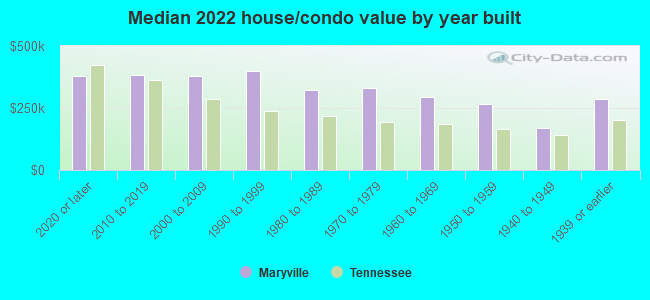
Mean price in 2022:
Detached houses: $387,908
Here: $387,908 State: $374,382 Townhouses or other attached units: $342,255
Here: $342,255 State: $354,101 In 2-unit structures: $390,176
Here: $390,176 State: $247,693 In 3-to-4-unit structures: $230,609
Here: $230,609 State: $239,060 In 5-or-more-unit structures: $242,736
Here: $242,736 State: $317,434 Mobile homes: $44,200
Here: $44,200 State: $101,421
Total population: 28,329 (Urban population: 23,164, Rural population: 3 (all nonfarm))
Houses: 13,175 (12,273 occupied: 8,674 owner occupied, 3,882 renter occupied)
| % of renters here: | 31% |
| State: | 33% |
Housing density: 828 houses/condos per square mile
Median price asked for vacant for-sale houses and condos in 2022: $280,563.
Median contract rent in 2022: $865 (lower quartile is $606, upper quartile is $1,258)
Median rent asked for vacant for-rent units in 2022: $928
Median gross rent in Maryville, TN in 2022: $993
Housing units in Maryville with a mortgage: 5,451 (539 second mortgage, 0 home equity loan, 363 both second mortgage and home equity loan)
Houses without a mortgage: 124
Median household income for houses/condos with a mortgage: $94,019
Median household income for apartments without a mortgage: $85,408
Median monthly housing costs: $1,031
Compare current foreclosures in Maryville, TN:
| Photo | Address | Area | Beds / Baths | Price | Details |
|---|---|---|---|---|---|

|
#1
Calderwood Hwy
Maryville, TN 37801
|
1,271 sq. feet
|
2 baths 2 beds |
show details | |

|
#2
Arthur Ave
Maryville, TN 37804
|
836 sq. feet
|
1 baths 3 beds |
show details | |

|
#3
Haverford Ln
Maryville, TN 37804
|
1,326 sq. feet
|
2 baths - beds |
show details | |

|
#4
Mcnabb Pl
Maryville, TN 37801
|
960 sq. feet
|
1 baths - beds |
show details | |

|
#5
Fletcher St
Maryville, TN 37804
|
729 sq. feet
|
1 baths - beds |
show details | |

|
#6
Southern Oaks Dr
Maryville, TN 37801
|
1,436 sq. feet
|
2 baths - beds |
show details | |

|
#7
Montvale Rd
Maryville, TN 37803
|
2,244 sq. feet
|
2 baths - beds |
show details | |

|
#8
Woodlawn Ave
Maryville, TN 37804
|
1,912 sq. feet
|
1 baths - beds |
show details | |

|
#9
Pea Ridge Rd
Maryville, TN 37804
|
2,950 sq. feet
|
3 baths - beds |
show details | |

|
#10
Hutton Ridge Rd
Maryville, TN 37801
|
864 sq. feet
|
1 baths - beds |
show details |
| Photo | Address | Area | Beds / Baths | Price | Details |
|---|---|---|---|---|---|

|
#11
Hope St
Maryville, TN 37801
|
1,120 sq. feet
|
1 baths - beds |
show details | |

|
#12
W Ray Ave
Maryville, TN 37803
|
975 sq. feet
|
1 baths - beds |
show details | |

|
#13
Sevierville Rd
Maryville, TN 37804
|
2,286 sq. feet
|
2 baths - beds |
show details | |

|
#14
Manchester Dr
Maryville, TN 37803
|
2,044 sq. feet
|
2 baths - beds |
show details | |

|
#15
Howell Cir
Maryville, TN 37803
|
1,672 sq. feet
|
2 baths - beds |
show details | |

|
#16
Country Meadows Ln
Maryville, TN 37803
|
1,968 sq. feet
|
3 baths - beds |
show details | |

|
#17
Orton Dr
Maryville, TN 37804
|
1,070 sq. feet
|
1 baths - beds |
show details | |

|
#18
Tuckaleechee Pike
Maryville, TN 37803
|
3,612 sq. feet
|
2 baths - beds |
show details | |

|
#19
Middlewood Dr
Maryville, TN 37803
|
3,624 sq. feet
|
3 baths - beds |
show details | |

|
#20
Druid Hill Dr
Maryville, TN 37804
|
1,352 sq. feet
|
2 baths - beds |
show details |
| Photo | Address | Area | Beds / Baths | Price | Details |
|---|---|---|---|---|---|

|
#21
Pineview Rd
Maryville, TN 37803
|
1,960 sq. feet
|
1 baths - beds |
show details | |

|
#22
Glenfield Cir
Maryville, TN 37804
|
1,572 sq. feet
|
2 baths - beds |
show details | |

|
#23
Belle St
Maryville, TN 37803
|
969 sq. feet
|
1 baths - beds |
show details | |

|
#24
Highland Rd
Maryville, TN 37801
|
1,560 sq. feet
|
2 baths - beds |
show details | |

|
#25
Ingrid Dr
Maryville, TN 37801
|
1,674 sq. feet
|
2 baths - beds |
show details | |

|
#26
Martin St
Maryville, TN 37804
|
1,286 sq. feet
|
1 baths - beds |
show details | |

|
#27
Linda Ln
Maryville, TN 37803
|
2,528 sq. feet
|
1 baths - beds |
show details | |

|
#28
Old Niles Ferry Rd
Maryville, TN 37803
|
2,650 sq. feet
|
1 baths - beds |
show details | |

|
#29
Tech Dr
Maryville, TN 37803
|
1,232 sq. feet
|
2 baths - beds |
show details | |

|
#30
Tarpley St
Maryville, TN 37804
|
1,590 sq. feet
|
2 baths - beds |
show details |
| Photo | Address | Area | Beds / Baths | Price | Details |
|---|---|---|---|---|---|

|
#31
Ridgecrest Dr
Maryville, TN 37803
|
1,281 sq. feet
|
2 baths - beds |
show details | |

|
#32
Foxglove Ln
Maryville, TN 37801
|
1,878 sq. feet
|
2 baths - beds |
show details | |

|
#33
Ocoee Dr
Maryville, TN 37801
|
1,675 sq. feet
|
1 baths - beds |
show details | |

|
#34
Old Niles Ferry Rd
Maryville, TN 37803
|
2,156 sq. feet
|
3 baths - beds |
show details | |

|
#35
Gateway Rd
Maryville, TN 37804
|
1,338 sq. feet
|
2 baths - beds |
show details | |

|
#36
Crest Rd
Maryville, TN 37804
|
1,909 sq. feet
|
2 baths - beds |
show details | |

|
#37
Ingrid Dr
Maryville, TN 37801
|
1,232 sq. feet
|
2 baths - beds |
show details | |

|
#38
Meade St
Maryville, TN 37804
|
918 sq. feet
|
1 baths - beds |
show details | |

|
#39
Madison Ave
Maryville, TN 37804
|
1,176 sq. feet
|
1 baths - beds |
show details | |

|
#40
Big Springs Rd
Maryville, TN 37801
|
1,766 sq. feet
|
1 baths - beds |
show details |
| Photo | Address | Area | Beds / Baths | Price | Details |
|---|---|---|---|---|---|

|
#41
Fletcher St
Maryville, TN 37804
|
736 sq. feet
|
1 baths - beds |
show details | |

|
#42
Country Meadows Ln
Maryville, TN 37803
|
2,650 sq. feet
|
2 baths - beds |
show details | |

|
#43
Jefferson Ave
Maryville, TN 37804
|
1,287 sq. feet
|
1 baths - beds |
show details | |

|
#44
Old Piney Rd
Maryville, TN 37803
|
840 sq. feet
|
1 baths - beds |
show details | |

|
#45
Lenore Ln
Maryville, TN 37804
|
3,887 sq. feet
|
4 baths - beds |
show details | |

|
#46
Portland Dr
Maryville, TN 37803
|
1,692 sq. feet
|
2 baths - beds |
show details | |

|
#47
Mo Dell Way
Maryville, TN 37801
|
1,544 sq. feet
|
2 baths - beds |
show details | |

|
#48
Ridgeway Trl
Maryville, TN 37801
|
1,720 sq. feet
|
2 baths - beds |
show details | |

|
#49
Mcginley St
Maryville, TN 37804
|
728 sq. feet
|
1 baths - beds |
show details | |

|
Check over 1 million property listings on Foreclosure.com!
|
browse all offers | |||

Latest news about housing in Maryville, TN collected exclusively by city-data.com from local newspapers, TV, and radio stations

 | Apartments in Downtown Maryville Tennessee (5 replies) |
| Maryville home rental contracts (2 replies) |
| Our Knoxville relocation, rental houses, and impressions (13 replies) |
| Maryville apartments?? (1 reply) |
| Homes to rent on a month to month only (6 replies) |
| Help need to find house to rent Mid June Maryville Area (1 reply) |
Median year apartment built: 1980
Household type by relationship:
Households: 32,815- Male householders: 5,804 (1,264 living alone), Female householders: 6,488 (2,070 living alone)
6,521 spouses (6,478 opposite-sex spouses), 444 unmarried partners, (412 opposite-sex unmarried partners), 9,630 children (8,574 natural, 449 adopted, 606 stepchildren), 469 grandchildren, 402 brothers or sisters, 460 parents, 32 foster children, 451 other relatives, 351 non-relatives
- In group quarters: 1,757
Size of family households: 4,000 2-persons, 1,828 3-persons, 2,069 4-persons, 683 5-persons, 362 6-persons, 86 7-or-more-persons.
Size of nonfamily households: 3,277 1-person, 359 2-persons, 44 5-persons.
4,752 married couples with children.
1,329 single-parent households (634 men, 695 women).
96.0% of residents of Maryville speak English at home.
2.0% of residents speak Spanish at home (41% speak English very well, 28% speak English well, 29% speak English not well, 2% don't speak English at all).
0.7% of residents speak other Indo-European language at home (70% speak English very well, 22% speak English well, 8% speak English not well).
1.0% of residents speak Asian or Pacific Island language at home (41% speak English very well, 59% speak English well).
Foreign born population: 890 (2.7%)
(28.3% of them are naturalized citizens)
| Here: | 6.8 |
| State: | 6.5 |
| Here: | 4.5 |
| State: | 4.4 |
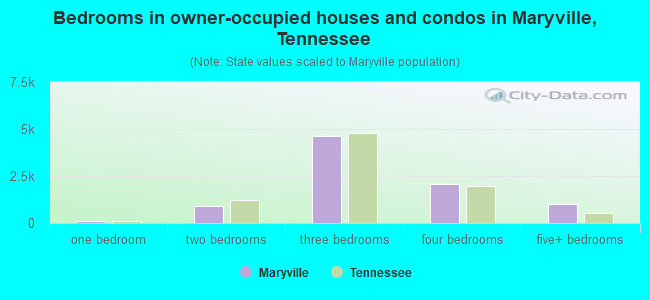
- Bedrooms in owner-occupied houses and condos in Maryville, Tennessee
- 12no bedroom
- 851 bedroom
- 9062 bedrooms
- 4,6033 bedrooms
- 2,0774 bedrooms
- 9925+ bedrooms
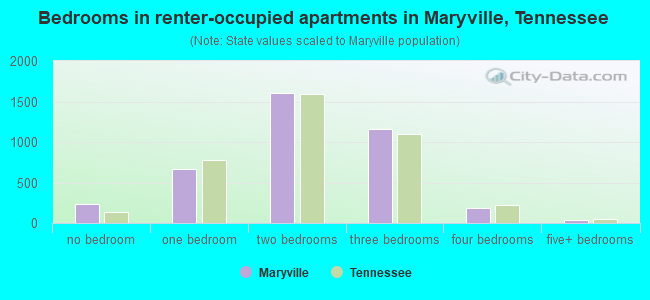
- Bedrooms in renter-occupied apartments in Maryville, Tennessee
- 234no bedroom
- 6671 bedroom
- 1,6032 bedrooms
- 1,1583 bedrooms
- 1854 bedrooms
- 365+ bedrooms
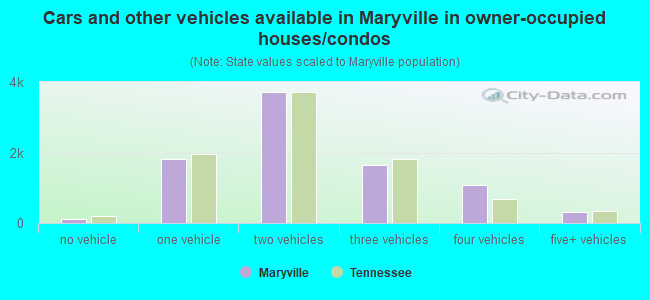
- Cars and other vehicles available in Maryville in owner-occupied houses/condos
- 104no vehicle
- 1,8191 vehicle
- 3,7232 vehicles
- 1,6363 vehicles
- 1,0874 vehicles
- 3045+ vehicles
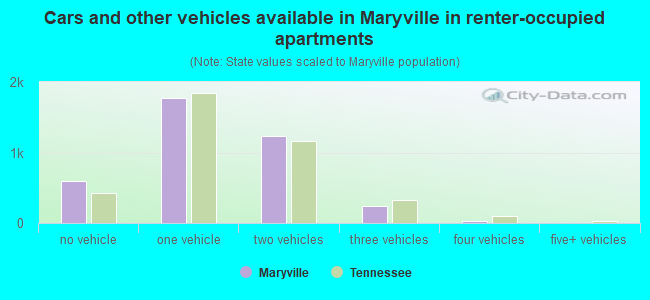
- Cars and other vehicles available in Maryville in renter-occupied apartments
- 600no vehicle
- 1,7781 vehicle
- 1,2312 vehicles
- 2413 vehicles
- 244 vehicles
- 75+ vehicles
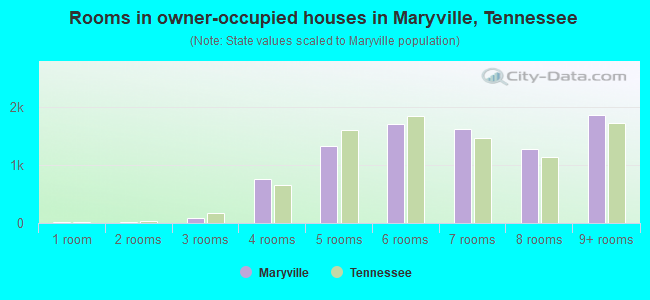
- Rooms in owner-occupied houses in Maryville, Tennessee
- 121 room
- 162 rooms
- 793 rooms
- 7594 rooms
- 1,3275 rooms
- 1,7106 rooms
- 1,6267 rooms
- 1,2788 rooms
- 1,8699+ rooms
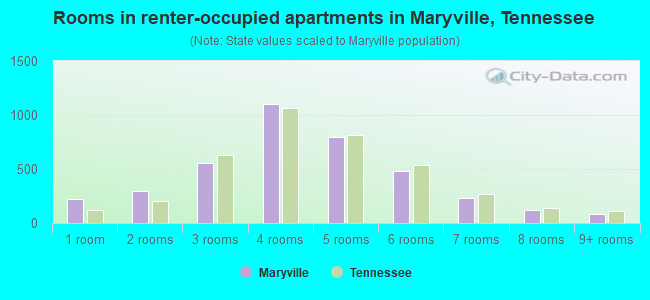
- Rooms in renter-occupied apartments in Maryville, Tennessee
- 2231 room
- 2932 rooms
- 5533 rooms
- 1,1044 rooms
- 7935 rooms
- 4816 rooms
- 2337 rooms
- 1198 rooms
- 839+ rooms
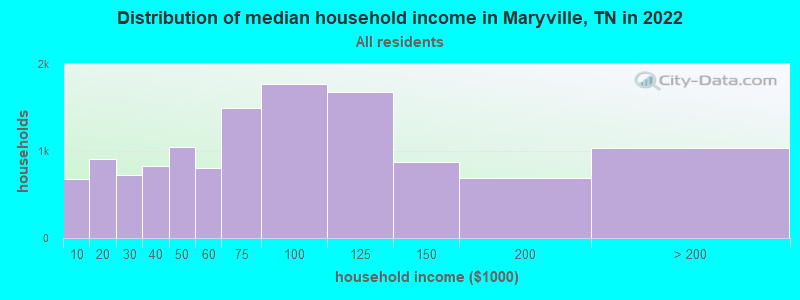
Maryville, TN household income distribution

- 681Less than $10,000
- 903$10,000 to $19,999
- 721$20,000 to $29,999
- 829$30,000 to $39,999
- 1,044$40,000 to $49,999
- 799$50,000 to $59,999
- 1,497$60,000 to $74,999
- 1,770$75,000 to $99,999
- 1,679$100,000 to $124,999
- 869$125,000 to $149,999
- 684$150,000 to $199,999
- 1,038$200,000 or more
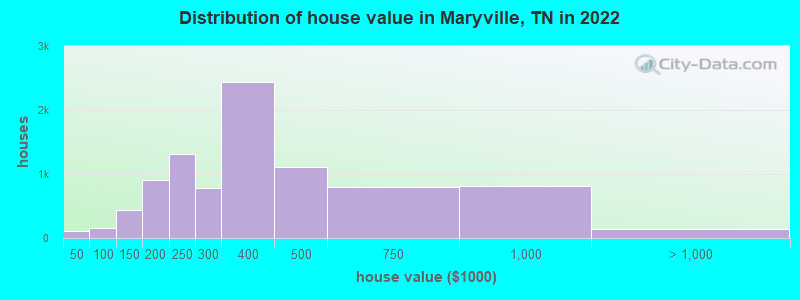
Home value of owner - occupied houses in 2022 in Maryville, TN
-
- 30Less than $10,000
- 33$10,000 to $14,999
- 3$15,000 to $19,999
- 30$20,000 to $24,999
- 8$35,000 to $39,999
- 4$40,000 to $49,999
- 17$50,000 to $59,999
- 13$60,000 to $69,999
- 1$70,000 to $79,999
- 47$80,000 to $89,999
- 65$90,000 to $99,999
- 139$100,000 to $124,999
- 300$125,000 to $149,999
- 496$150,000 to $174,999
- 410$175,000 to $199,999
- 1,318$200,000 to $249,999
- 787$250,000 to $299,999
- 2,441$300,000 to $399,999
- 1,107$400,000 to $499,999
- 791$500,000 to $749,999
- 809$750,000 to $999,999
- 106$1,000,000 to $1,499,999
- 5$1,500,000 to $1,999,999
- 23$2,000,000 or more
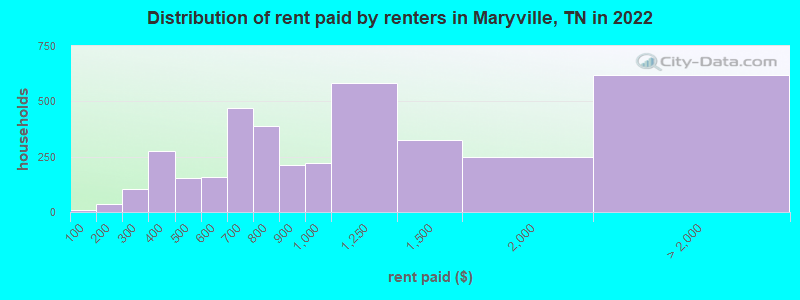
Rent paid by renters in 2022 in Maryville, TN
-
- 8Less than $100
- 38$150 to $199
- 52$200 to $249
- 52$250 to $299
- 126$300 to $349
- 151$350 to $399
- 89$400 to $449
- 62$450 to $499
- 66$500 to $549
- 92$550 to $599
- 381$600 to $649
- 86$650 to $699
- 231$700 to $749
- 156$750 to $799
- 212$800 to $899
- 220$900 to $999
- 580$1,000 to $1,249
- 323$1,250 to $1,499
- 248$1,500 to $1,999
- 261$2,000 to $2,499
- 21$2,500 to $2,999
- 26$3,000 to $3,499
- 73$3,500 or more
- 236No cash rent
Percentage of workers working in this county: 71.5%
Number of people working at home: 1,946 (12.4% of all workers)
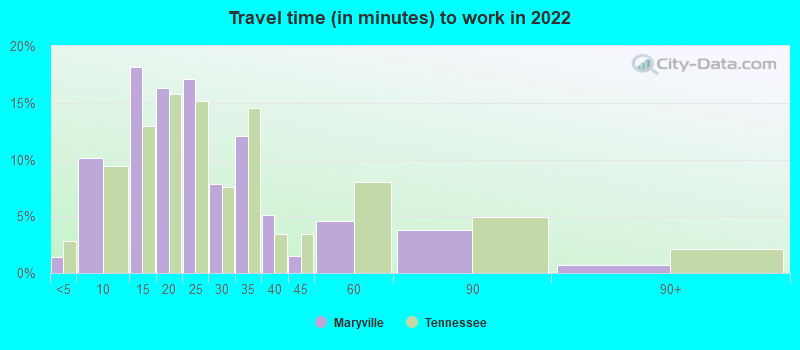
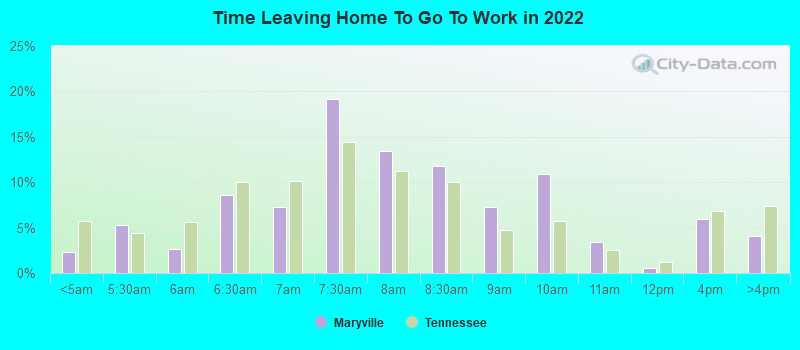
Travel time to work (commute)
- Less than 5 minutes: 262
- 5 to 9 minutes: 1,975
- 10 to 14 minutes: 2,506
- 15 to 19 minutes: 2,090
- 20 to 24 minutes: 1,098
- 25 to 29 minutes: 1,047
- 30 to 34 minutes: 1,708
- 35 to 39 minutes: 1,610
- 40 to 44 minutes: 253
- 45 to 59 minutes: 604
- 60 to 89 minutes: 71
- 90 or more minutes: 60
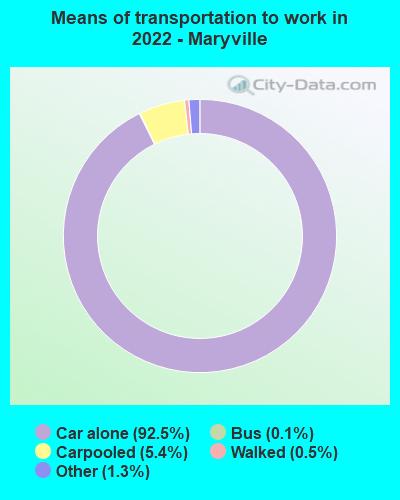
Means of transportation to work:
- Drove a car alone: 22,598 (83.5%)
- Carpooled: 1,391 (5.1%)
- Bus: 29 (0.1%)
- Taxi: 405 (1.5%)
- Bicycle: 15 (0.1%)
- Walked: 137 (0.5%)
- Worked at home: 1,946 (7.2%)
- Unemployment by race in 2022
- Unemployment rate for White non-Hispanic residents
- 2.2%Males
- 1.9%Females
- Unemployment rate for Black residents
- 2.1%Females
- Unemployment rate for two or more race residents
- 12.7%Females
- Unemployment rate for Hispanic or Latino residents
- 4.0%Males
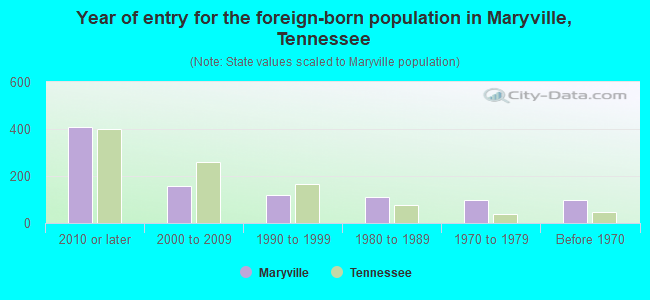
- Year of entry for the foreign-born population in Maryville, Tennessee
- 4092010 or later
- 1572000 to 2009
- 1201990 to 1999
- 1101980 to 1989
- 971970 to 1979
- 96Before 1970
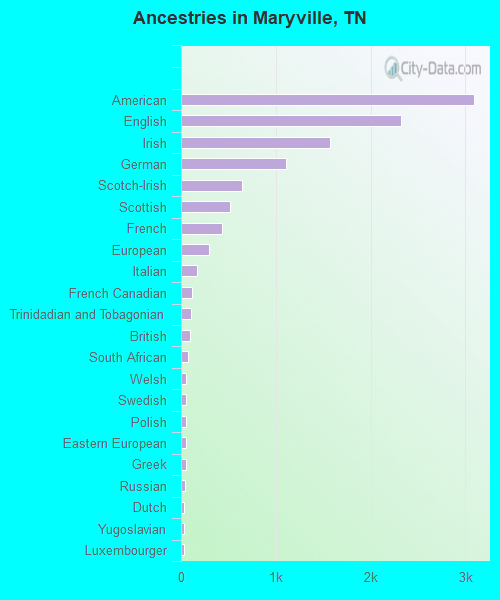
First ancestries reported:
- American: 3,094 (22.4%)
- English: 2,319 (16.8%)
- Irish: 1,569 (11.3%)
- German: 1,110 (8.0%)
- Scotch-Irish: 643 (4.7%)
- Scottish: 522 (3.8%)
- French: 437 (3.2%)
- European: 298 (2.2%)
- Italian: 167 (1.2%)
- French Canadian: 119 (0.9%)
- Trinidadian and Tobagonian: 101 (0.7%)
- British: 93 (0.7%)
- South African: 71 (0.5%)
- Welsh: 57 (0.4%)
- Swedish: 56 (0.4%)
- Polish: 55 (0.4%)
- Eastern European: 53 (0.4%)
- Greek: 48 (0.3%)
- Russian: 47 (0.3%)
- Dutch: 31 (0.2%)
- Yugoslavian: 30 (0.2%)
- Luxembourger: 29 (0.2%)
- Scandinavian: 28 (0.2%)
- Norwegian: 25 (0.2%)
- Turkish: 25 (0.2%)
- Northern European: 24 (0.2%)
- Danish: 17 (0.1%)
- Finnish: 9 (0.07%)
- Hungarian: 9 (0.07%)
- Czech: 8 (0.06%)
- African: 6 (0.04%)
- Swiss: 5 (0.04%)
Most common places of birth for foreign-born residents (%):
| Maryville: | 18.9% (171) |
| Tennessee: | 23.0% (86,435) |
| Maryville: | 10.4% (94) |
| Tennessee: | 5.7% (21,286) |
| Maryville: | 9.5% (86) |
| Tennessee: | 0.8% (3,002) |
| Maryville: | 7.3% (66) |
| Tennessee: | 3.3% (12,582) |
| Maryville: | 6.6% (60) |
| Tennessee: | 0.0% (77) |
| Maryville: | 6.4% (58) |
| Tennessee: | 0.5% (1,731) |
| Maryville: | 6.3% (57) |
| Tennessee: | 2.3% (8,490) |
| Maryville: | 6.3% (57) |
| Tennessee: | 1.1% (4,233) |
| Maryville: | 5.4% (49) |
| Tennessee: | 1.2% (4,587) |
| Maryville: | 3.6% (33) |
| Tennessee: | 0.5% (2,053) |
| Maryville: | 2.6% (24) |
| Tennessee: | 1.0% (3,809) |
| Maryville: | 2.5% (23) |
| Tennessee: | 0.3% (1,109) |
| Maryville: | 2.2% (20) |
| Tennessee: | 2.2% (8,261) |
| Maryville: | 1.7% (15) |
| Tennessee: | 2.7% (10,295) |
| Maryville: | 1.5% (14) |
| Tennessee: | 4.6% (17,433) |
Place of birth for U.S.-born residents:
- This state: 18,659
- Other state: 12,868
- Northeast: 1,713
- Midwest: 3,096
- South: 5,809
- West: 2,366
91.2% of Maryville residents lived in the same house 1 years ago.
Out of people who lived in different houses, 43.8% lived in this county.
Out of people who lived in different counties, 59.8% lived in Tennessee.
| Maryville: | 91.2% |
| State average: | 87.0% |
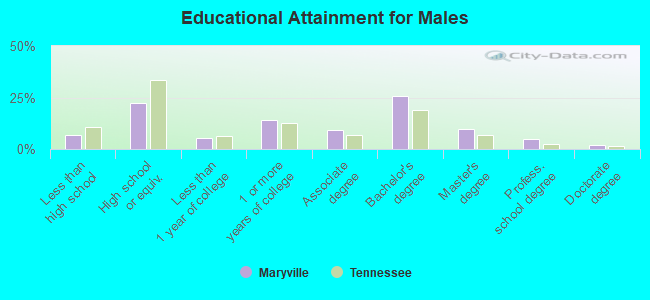
Education attainment for males 25 years and older:
- No schooling: 40
- Nursery to 4th grade: 89
- 5th and 6th grade: 119
- 7th and 8th grade: 48
- 9th grade: 177
- 10th grade: 103
- 11th grade: 100
- 12th grade, no diploma: 55
- High school graduate (or equivalency): 2,422
- Less than 1 year of college: 557
- Some college more than 1 year, no degree: 1,526
- Associate degree: 1,010
- Bachelor's degree: 2,744
- Master's degree: 1,055
- Professional school degree: 496
- Doctorate degree: 188
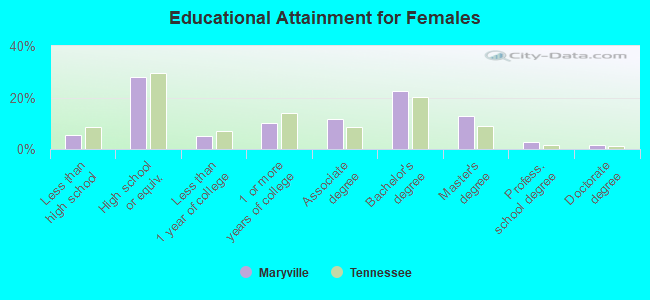
Education attainment for females 25 years and older:
- No schooling: 10
- Nursery to 4th grade: 30
- 5th and 6th grade: 19
- 7th and 8th grade: 162
- 9th grade: 71
- 10th grade: 175
- 11th grade: 129
- 12th grade, no diploma: 84
- High school graduate (or equivalency): 3,432
- Less than 1 year of college: 644
- Some college more than 1 year, no degree: 1,232
- Associate degree: 1,440
- Bachelor's degree: 2,802
- Master's degree: 1,576
- Professional school degree: 352
- Doctorate degree: 191
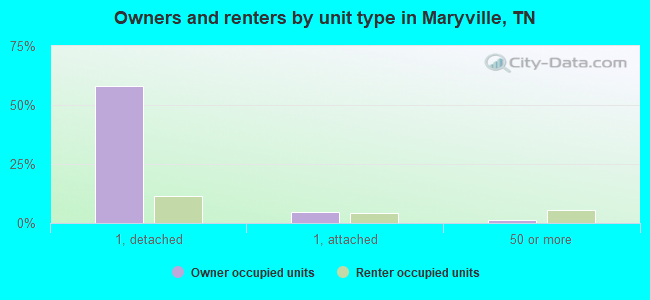
Housing units in structures:
- One, detached: 9,905
- One, attached: 599
- Two: 322
- 3 or 4: 388
- 5 to 9: 462
- 10 to 19: 309
- 20 to 49: 362
- 50 or more: 678
- Mobile homes: 145
Housing units lacking complete kitchen facilities in 2022: 3.3%
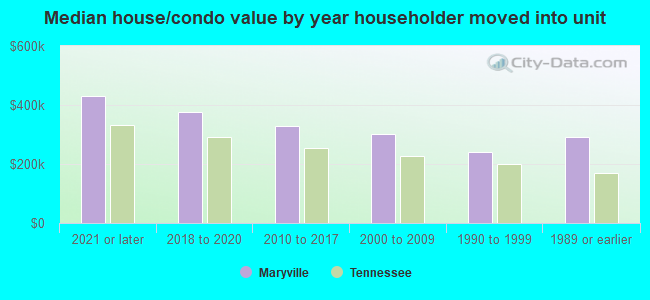
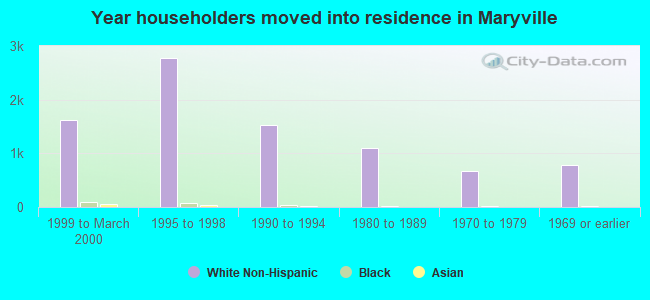
House/condo owner moved in on average 7 years ago
Renter moved in on average 3 years ago

- 54.4%Utility gas
- 44.3%Electricity
- 1.0%Bottled, tank, or LP gas
- 0.3%No fuel used
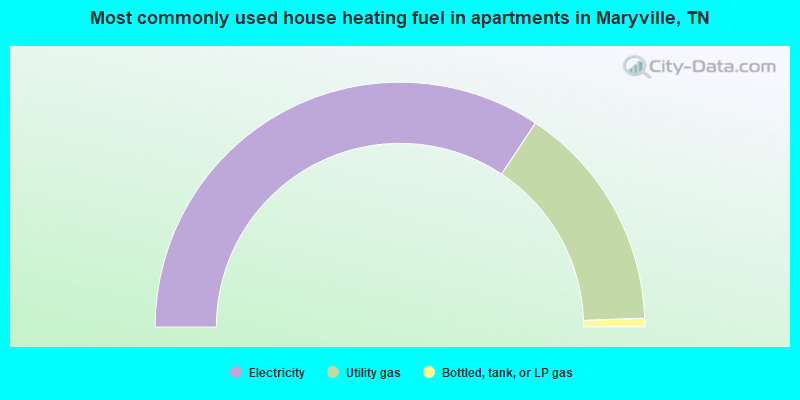
- 68.6%Electricity
- 30.2%Utility gas
- 1.1%Bottled, tank, or LP gas
Private vs. public school enrollment:
| Here: | 5.7% |
| Tennessee: | 15.0% |
| Here: | 7.3% |
| Tennessee: | 16.2% |
| Here: | 48.1% |
| Tennessee: | 23.5% |