Mason City, IL (Illinois) Houses and Residents
| Mason City: | $96,599 |
| Illinois: | $251,600 |
Mean price in 2022:
Detached houses: $115,523
Here: $115,523 State: $310,164 Mobile homes: $27,368
Here: $27,368 State: $78,855
Total population: 2,212 (All urban)
Houses: 1,166 (1,033 occupied: 809 owner occupied, 238 renter occupied)
| % of renters here: | 23% |
| State: | 33% |
Housing density: 1,185 houses/condos per square mile
Median price asked for vacant for-sale houses and condos in 2022 in this county: $54,826.
Median contract rent in 2022: $495 (lower quartile is $425, upper quartile is $718)
Median rent asked for vacant for-rent units in 2022: $334
Median gross rent in Mason City, IL in 2022: $748
Housing units in Mason City with a mortgage: 365 (19 second mortgage, 0 home equity loan, 16 both second mortgage and home equity loan)
Houses without a mortgage: 0
Median household income for houses/condos with a mortgage: $77,447
Median household income for apartments without a mortgage: $67,888
Median monthly housing costs: $669
Compare current foreclosures near Mason City, IL:
| Photo | Address | Area | Beds / Baths | Price | Details |
|---|---|---|---|---|---|

|
#1
E Pine St
Mason City, IL 62664
|
3,960 sq. feet
|
3 baths 4 beds |
show details | |

|
#2
N Keefer St
Mason City, IL 62664
|
- sq. feet
|
2 baths 2 beds |
show details | |

|
#3
N Main St
Mason City, IL 62664
|
- sq. feet
|
- baths - beds |
show details | |

|
#4
W Arch St
Mason City, IL 62664
|
- sq. feet
|
- baths - beds |
show details | |

|
#5
N Main St
Lincoln, IL 62656
|
784 sq. feet
|
1 baths 2 beds |
$117,900
|
show details |

|
#6
N Tonica St
Mason City, IL 62664
|
- sq. feet
|
- baths - beds |
show details | |

|
#7
N Main St
Mason City, IL 62664
|
- sq. feet
|
- baths - beds |
show details | |

|
#8
E Myrtle St
Mason City, IL 62664
|
- sq. feet
|
- baths - beds |
show details | |

|
#9
N Morgan St
Mason City, IL 62664
|
- sq. feet
|
- baths - beds |
show details | |

|
#10
N Pear
Topeka, IL 61567
|
- sq. feet
|
1 baths 2 beds |
$39,900
|
show details |
| Photo | Address | Area | Beds / Baths | Price | Details |
|---|---|---|---|---|---|

|
#11
County Road 1800 N
Topeka, IL 61567
|
1,113 sq. feet
|
1 baths 3 beds |
show details | |

|
#12
S Mill St
Athens, IL 62613
|
1,245 sq. feet
|
2 baths 3 beds |
show details | |

|
#13
E 7th St
Delavan, IL 61734
|
1,064 sq. feet
|
1 baths 2 beds |
show details | |

|
#14
W 5th St
Delavan, IL 61734
|
- sq. feet
|
- baths - beds |
$63,600
|
show details |

|
#15
N Anson St
Middletown, IL 62666
|
3,114 sq. feet
|
2 baths 3 beds |
show details | |

|
#16
N 4th St
Petersburg, IL 62675
|
2,010 sq. feet
|
- baths 2 beds |
show details | |

|
#17
Lincoln St
Emden, IL 62635
|
- sq. feet
|
- baths - beds |
show details | |

|
#18
E Sangamon Ave
Petersburg, IL 62675
|
- sq. feet
|
- baths - beds |
show details | |

|
#19
S 10th St
Petersburg, IL 62675
|
- sq. feet
|
- baths - beds |
show details | |

|
#20
E 4th St
Delavan, IL 61734
|
- sq. feet
|
- baths - beds |
show details |
| Photo | Address | Area | Beds / Baths | Price | Details |
|---|---|---|---|---|---|

|
#21
Peoria St
Athens, IL 62613
|
- sq. feet
|
- baths - beds |
show details | |

|
#22
E Madison St
Athens, IL 62613
|
- sq. feet
|
- baths - beds |
show details | |

|
#23
1500th St
Lincoln, IL 62656
|
- sq. feet
|
- baths - beds |
show details | |

|
#24
E Meadow Lawn St
Manito, IL 61546
|
- sq. feet
|
- baths - beds |
show details | |

|
#25
S Park Ave
Manito, IL 61546
|
- sq. feet
|
- baths - beds |
show details | |

|
#26
W Lincoln Ave
Petersburg, IL 62675
|
- sq. feet
|
- baths - beds |
show details | |

|
#27
Curtis Blacktop Rd
Petersburg, IL 62675
|
- sq. feet
|
- baths - beds |
show details | |

|
#28
E Pheasant Dr
Athens, IL 62613
|
- sq. feet
|
- baths - beds |
show details | |

|
#29
E Oak St
Elkhart, IL 62634
|
- sq. feet
|
- baths - beds |
show details | |

|
#30
Pioneer Dr
Athens, IL 62613
|
- sq. feet
|
- baths - beds |
show details |
| Photo | Address | Area | Beds / Baths | Price | Details |
|---|---|---|---|---|---|

|
Check over 1 million property listings on Foreclosure.com!
|
browse all offers | |||
| Photo | Address | Area | Beds / Baths | Price | Details |
|---|


 | Moving back to Springfield after many years away. (3 replies) |
| Decatur IL Move or stay away? (35 replies) |
| Found possible work in central Illinois (Springfield or Champaign) (12 replies) |
| Place to live- Working family driving in opposite direction- Peoria & Springfield (12 replies) |
| Bartonville IL (19 replies) |
| What's Springfield like??? (21 replies) |

Median year apartment built: 1938
Household type by relationship:
Households: 2,228- Male householders: 511 (173 living alone), Female householders: 502 (218 living alone)
401 spouses (401 opposite-sex spouses), 87 unmarried partners, (87 opposite-sex unmarried partners), 537 children (467 natural, 30 adopted, 39 stepchildren), 45 grandchildren, 13 brothers or sisters, 9 parents, 0 foster children, 9 other relatives, 41 non-relatives
- In group quarters: 67
Size of family households: 314 2-persons, 119 3-persons, 95 4-persons, 19 5-persons, 11 6-persons, 24 7-or-more-persons.
Size of nonfamily households: 413 1-person, 42 2-persons, 11 3-persons.
271 married couples with children.
130 single-parent households (65 men, 65 women).
98.0% of residents of Mason City speak English at home.
0.7% of residents speak Spanish at home (100% speak English very well).
1.2% of residents speak other Indo-European language at home (100% speak English very well).
| Here: | 6.5 |
| State: | 6.4 |
| Here: | 4.9 |
| State: | 4.1 |

- Bedrooms in owner-occupied houses and condos in Mason City, Illinois
- 0no bedroom
- 141 bedroom
- 1472 bedrooms
- 4963 bedrooms
- 1484 bedrooms
- 55+ bedrooms

- Bedrooms in renter-occupied apartments in Mason City, Illinois
- 13no bedroom
- 591 bedroom
- 1202 bedrooms
- 363 bedrooms
- 104 bedrooms
- 05+ bedrooms

- Cars and other vehicles available in Mason City in owner-occupied houses/condos
- 19no vehicle
- 2421 vehicle
- 3402 vehicles
- 1483 vehicles
- 484 vehicles
- 125+ vehicles

- Cars and other vehicles available in Mason City in renter-occupied apartments
- 38no vehicle
- 1531 vehicle
- 362 vehicles
- 123 vehicles
- 04 vehicles
- 05+ vehicles

- Rooms in owner-occupied houses in Mason City, Illinois
- 01 room
- 02 rooms
- 143 rooms
- 844 rooms
- 1315 rooms
- 1816 rooms
- 1327 rooms
- 1128 rooms
- 1549+ rooms

- Rooms in renter-occupied apartments in Mason City, Illinois
- 131 room
- 312 rooms
- 243 rooms
- 404 rooms
- 235 rooms
- 256 rooms
- 687 rooms
- 138 rooms
- 09+ rooms


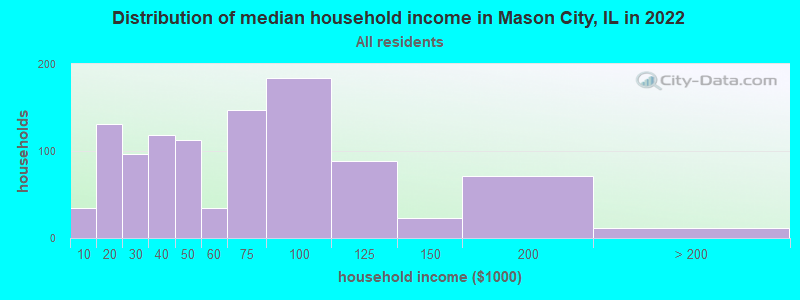
Mason City, IL household income distribution

- 35Less than $10,000
- 131$10,000 to $19,999
- 97$20,000 to $29,999
- 118$30,000 to $39,999
- 113$40,000 to $49,999
- 35$50,000 to $59,999
- 147$60,000 to $74,999
- 184$75,000 to $99,999
- 89$100,000 to $124,999
- 23$125,000 to $149,999
- 71$150,000 to $199,999
- 11$200,000 or more
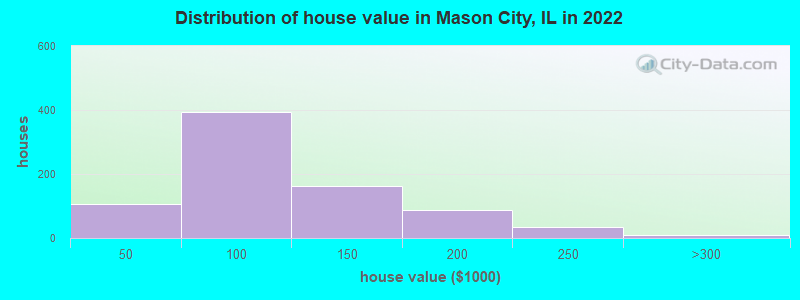
Home value of owner - occupied houses in 2022 in Mason City, IL
-
- 19Less than $10,000
- 20$10,000 to $14,999
- 31$25,000 to $29,999
- 7$30,000 to $34,999
- 6$35,000 to $39,999
- 21$40,000 to $49,999
- 59$50,000 to $59,999
- 93$60,000 to $69,999
- 64$70,000 to $79,999
- 62$80,000 to $89,999
- 92$90,000 to $99,999
- 145$100,000 to $124,999
- 17$125,000 to $149,999
- 62$150,000 to $174,999
- 23$175,000 to $199,999
- 32$200,000 to $249,999
- 3$250,000 to $299,999
- 4$300,000 to $399,999
Rent paid by renters in 2022 in Mason City, IL
-
- 5$200 to $249
- 11$250 to $299
- 7$350 to $399
- 39$400 to $449
- 25$450 to $499
- 33$500 to $549
- 4$550 to $599
- 5$600 to $649
- 11$700 to $749
- 13$750 to $799
- 10$800 to $899
- 13$1,000 to $1,249
- 62No cash rent


Percentage of workers working in this county: 51.9%
Number of people working at home: 87 (9.1% of all workers)
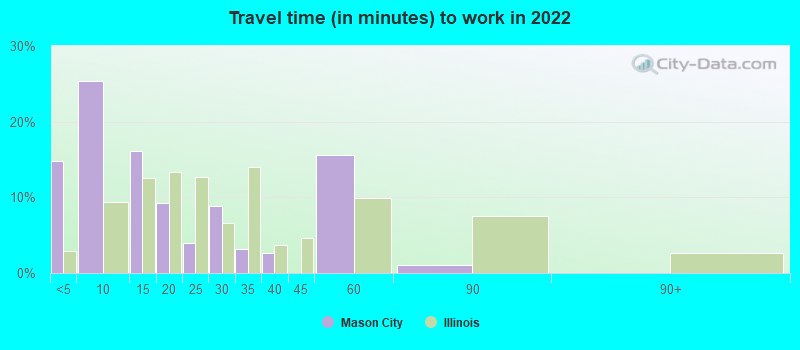
Travel time to work (commute)
- Less than 5 minutes: 88
- 5 to 9 minutes: 162
- 10 to 14 minutes: 64
- 15 to 19 minutes: 74
- 20 to 24 minutes: 55
- 25 to 29 minutes: 75
- 30 to 34 minutes: 103
- 35 to 39 minutes: 3
- 40 to 44 minutes: 49
- 45 to 59 minutes: 118
- 60 to 89 minutes: 40
- 90 or more minutes: 11
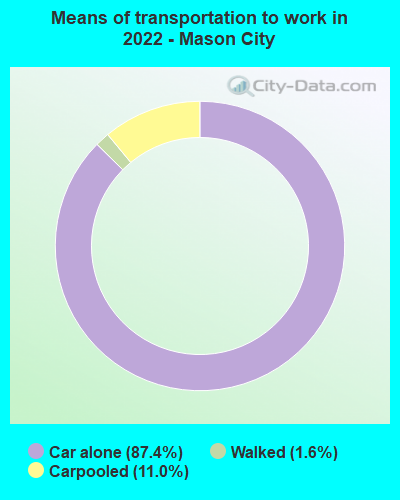
Means of transportation to work:
- Drove a car alone: 476 (75.3%)
- Carpooled: 63 (10.0%)
- Walked: 8 (1.3%)
- Worked at home: 87 (13.8%)

- Unemployment by race in 2022
- Unemployment rate for White non-Hispanic residents
- 1.2%Males
- 2.6%Females

- Year of entry for the foreign-born population in Mason City, Illinois
- 01995 to March 2000
- 51990 to 1994
- 01985 to 1989
- 01980 to 1984
- 01975 to 1979
- 01970 to 1974
- 41965 to 1969
- 5Before 1965

First ancestries reported:
- German: 251 (25.2%)
- American: 225 (22.5%)
- English: 198 (19.8%)
- Irish: 111 (11.1%)
- Australian: 68 (6.8%)
- French: 46 (4.6%)
- Italian: 17 (1.7%)
- Scottish: 13 (1.3%)
- Dutch: 10 (1.0%)
- Austrian: 9 (0.9%)
- Welsh: 8 (0.8%)
- Polish: 6 (0.6%)
- Swedish: 5 (0.5%)
- British: 3 (0.3%)
- Eastern European: 3 (0.3%)
- European: 2 (0.2%)
- Scotch-Irish: 2 (0.2%)
Most common places of birth for foreign-born residents (%):
| Mason City: | 64.3% (9) |
| Illinois: | 2.1% (32,764) |
| Mason City: | 35.7% (5) |
| Illinois: | 0.7% (10,958) |
Place of birth for U.S.-born residents:
- This state: 1,909
- Other state: 309
- Northeast: 26
- Midwest: 150
- South: 121
- West: 9
92.4% of Mason City residents lived in the same house 1 years ago.
Out of people who lived in different houses, 35.7% lived in this county.
Out of people who lived in different counties, 70.8% lived in Illinois.
| Mason City: | 92.4% |
| State average: | 88.3% |
Education attainment for males 25 years and older:
- No schooling: 0
- Nursery to 4th grade: 0
- 5th and 6th grade: 0
- 7th and 8th grade: 44
- 9th grade: 0
- 10th grade: 0
- 11th grade: 42
- 12th grade, no diploma: 4
- High school graduate (or equivalency): 260
- Less than 1 year of college: 97
- Some college more than 1 year, no degree: 85
- Associate degree: 65
- Bachelor's degree: 56
- Master's degree: 31
- Professional school degree: 3
- Doctorate degree: 4

Education attainment for females 25 years and older:
- No schooling: 14
- Nursery to 4th grade: 12
- 5th and 6th grade: 0
- 7th and 8th grade: 0
- 9th grade: 14
- 10th grade: 13
- 11th grade: 6
- 12th grade, no diploma: 16
- High school graduate (or equivalency): 324
- Less than 1 year of college: 58
- Some college more than 1 year, no degree: 163
- Associate degree: 63
- Bachelor's degree: 136
- Master's degree: 43
- Professional school degree: 6
- Doctorate degree: 0


Housing units in structures:
- One, detached: 1,031
- One, attached: 11
- Two: 13
- 3 or 4: 13
- 5 to 9: 45
- 10 to 19: 5
- Mobile homes: 47
Housing units lacking complete kitchen facilities in 2022: 1.7%
House/condo owner moved in on average 18 years ago
Renter moved in on average 2 years ago

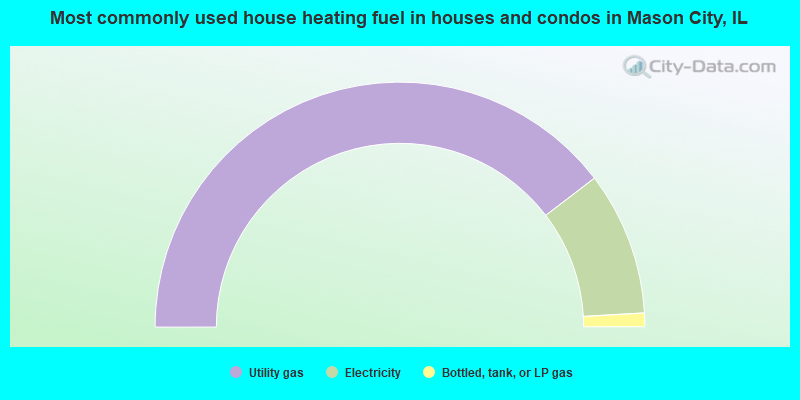
- 79.2%Utility gas
- 19.0%Electricity
- 1.8%Bottled, tank, or LP gas
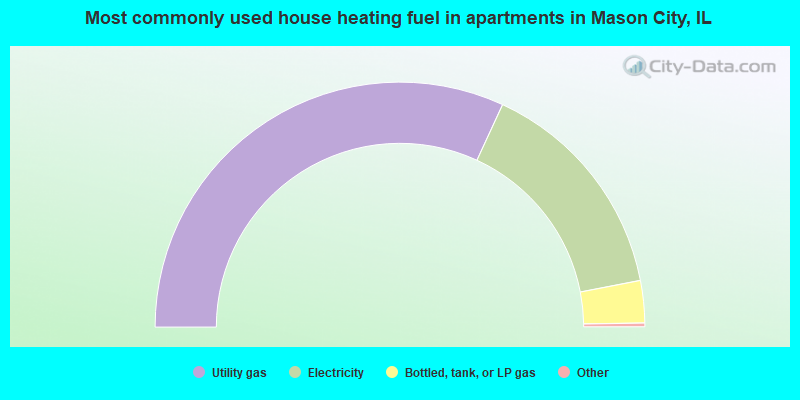
- 64.1%Utility gas
- 30.3%Electricity
- 5.6%Bottled, tank, or LP gas
Private vs. public school enrollment:
| Here: | 4.3% |
| Illinois: | 13.3% |
| Here: | 5.6% |
| Illinois: | 9.9% |
| Here: | 51.5% |
| Illinois: | 27.4% |


