Mason City, IA (Iowa) Houses and Residents
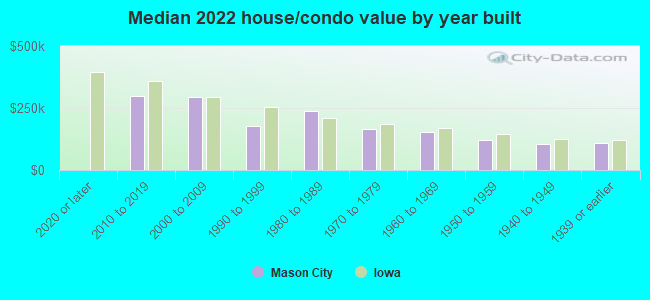
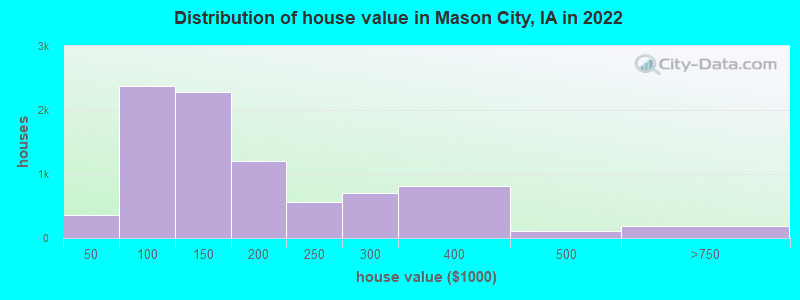
Estimated median house or condo value in 2022: $134,484 (it was $72,500 in 2000 )
Mason City:
$134,484Iowa:
$194,600
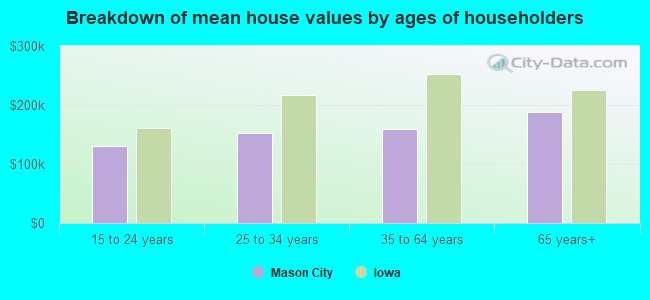
Lower value quartile - upper value quartile: $96,329 - $216,341Mean price in 2022: Detached houses: $196,385 Here:
$196,385State:
$245,224
Townhouses or other attached units: $294,685 Here:
$294,685State:
$238,767
In 2-unit structures: $220,044 Here:
$220,044State:
$243,070
In 3-to-4-unit structures: $182,849 Here:
$182,849State:
$162,139
In 5-or-more-unit structures: $185,790 Here:
$185,790State:
$190,519
Mobile homes: $59,444 Here:
$59,444State:
$51,271
Total population: 27,458 (All urban)
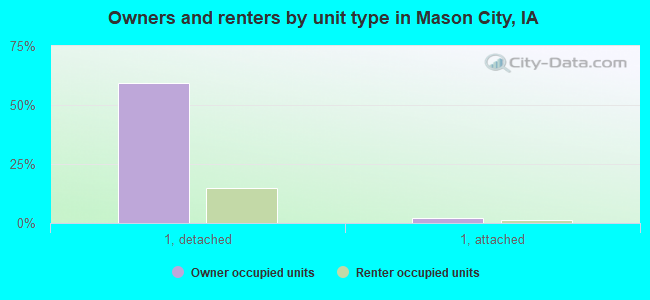
Houses: 14,336 (12,920 occupied: 8,914 owner occupied, 4,216 renter occupied )
% of renters here:
32%State:
28%
Housing density: 556 houses/condos per square mile
Median price asked for vacant for-sale houses and condos in 2022: $63,771.
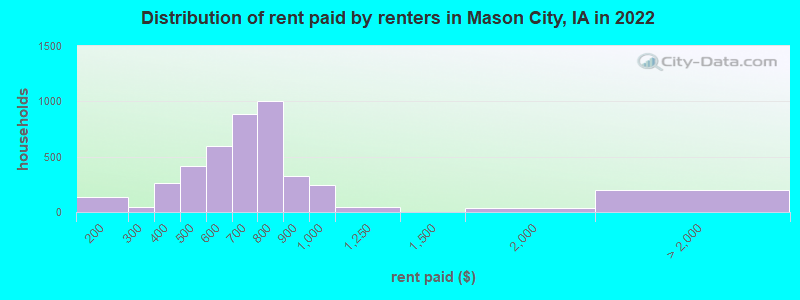
Median contract rent in 2022: $648 (lower quartile is $542, upper quartile is $743)
Median rent asked for vacant for-rent units in 2022: $551
Median gross rent in Mason City, IA in 2022: $819
Housing units in Mason City with a mortgage: 5,249 (426 second mortgage, 24 home equity loan, 386 both second mortgage and home equity loan )Houses without a mortgage: 45
Median household income for houses/condos with a mortgage: $81,719
Median household income for apartments without a mortgage: $57,959
Median monthly housing costs: $823
Data:
Median house or condo value ($)
Median house or condo value ($ change since 2000)
Median house or condo value ($) - White
Median house or condo value ($) - Black or African American
Median house or condo value ($) - Asian
Median house or condo value ($) - Hispanic or Latino
Median house or condo value ($) - American Indian and Alaska Native
Median house or condo value ($) - Multirace
Median house or condo value ($) - Other Race
Median price asked for mobile homes ($)
Household density (households per square mile)
Mean house or condo value by units in structure - 1, detached ($)
Mean house or condo value by units in structure - 1, attached ($)
Mean house or condo value by units in structure - 2 ($)
Mean house or condo value by units in structure by units in structure - 3 or 4 ($)
Mean house or condo value by units in structure - 5 or more ($)
Mean house or condo value by units in structure - Boat, RV, van, etc. ($)
Mean house or condo value by units in structure - Mobile home ($)
Median contract rent ($)
Median contract rent - Lower quartile ($)
Median contract rent - Upper quartile ($)
Median gross rent ($)
Urban houses (%)
Rural houses (%)
Houses occupied (%)
Houses occupied (% change since 2000)
Houses owner occupied (%)
Houses owner occupied (% change since 2000)
Houses renter occupied (%)
Houses renter occupied (% change since 2000)
Vacant housing units - For rent (%)
Vacant housing units - For rent (% change since 2000)
Vacant housing units - For sale only (%)
Vacant housing units - For sale only (% change since 2000)
Vacant housing units - Rented or sold, not occupied (%)
Vacant housing units - Rented or sold, not occupied (% change since 2000)
Vacant housing units - For seasonal, recreational, or occasional use (%)
Vacant housing units - For seasonal, recreational, or occasional use (% change since 2000)
Vacant housing units - For migrant workers (%)
Vacant housing units - For migrant workers (% change since 2000)
Vacant housing units - Other vacant (%)
Vacant housing units - Other vacant (% change since 2000)
Median monthly housing costs ($)
Median household income for houses/condos with a mortgage ($)
Median household income for houses/condos without a mortgage ($)
Median household income ($)
Median household income ($) - White
Median household income ($) - Black or African American
Median household income ($) - Asian
Median household income ($) - Hispanic or Latino
Median household income ($) - American Indian and Alaska Native
Median household income ($) - Multirace
Median household income ($) - Other Race
Mortgage status - with mortgage (%)
Mortgage status - with second mortgage (%)
Mortgage status - with home equity loan (%)
Mortgage status - with both second mortgage and home equity loan (%)
Mortgage status - without a mortgage (%)
Median year house/condo built
Median year apartment built
Household type by relationship - Male householder living alone (%)
Household type by relationship - Male householder not living alone (%)
Household type by relationship - Female householder living alone (%)
Household type by relationship - Female householder not living alone (%)
Household type by relationship - Opposite-Sex spouse (%)
Household type by relationship - Same-Sex spouse (%)
Household type by relationship - Opposite-Sex unmarried partner (%)
Household type by relationship - Same-Sex unmarried partner (%)
Household type by relationship - In group quarters (%)
Size of family households - 2-person household (%)
Size of family households - 3-person household (%)
Size of family households - 4-person household (%)
Size of family households - 5-person household (%)
Size of family households - 6-person household (%)
Size of family households - 7-or-more-person household (%)
Size of nonfamily households - 1-person household (%)
Size of nonfamily households - 2-person household (%)
Size of nonfamily households - 3-person household (%)
Size of nonfamily households - 4-person household (%)
Size of nonfamily households - 5-person household (%)
Size of nonfamily households - 6-person household (%)
Size of nonfamily households - 7-or-moreperson household (%)
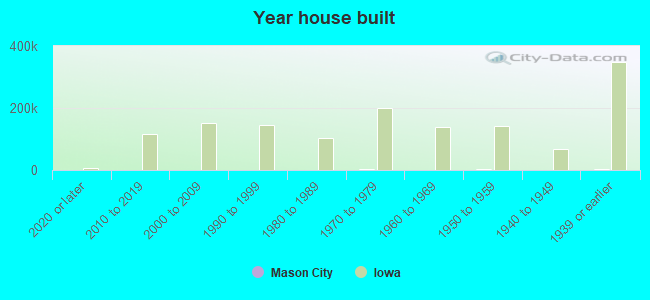
Year house built - Built 2010 or later (%)
Year house built - Built 2000 to 2009 (%)
Year house built - Built 1990 to 1999 (%)
Year house built - Built 1980 to 1989 (%)
Year house built - Built 1970 to 1979 (%)
Year house built - Built 1960 to 1969 (%)
Year house built - Built 1950 to 1959 (%)
Year house built - Built 1940 to 1949 (%)
Year house built - Built 1939 or earlier (%)
Median number of rooms in houses and condos
Median number of rooms in apartments
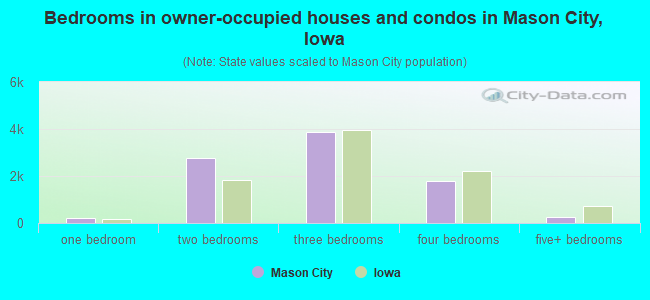
Median number of bedrooms in owner occupied houses
Mean number of bedrooms in owner occupied houses
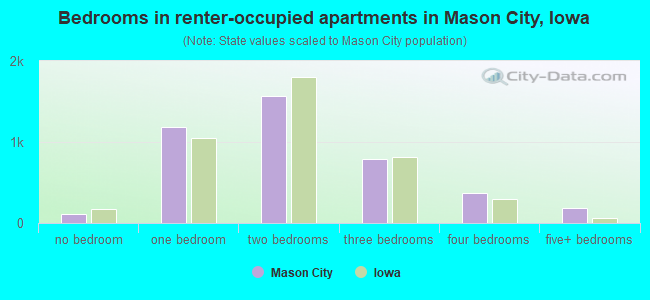
Median number of bedrooms in renter occupied houses
Mean number of bedrooms in renter occupied houses
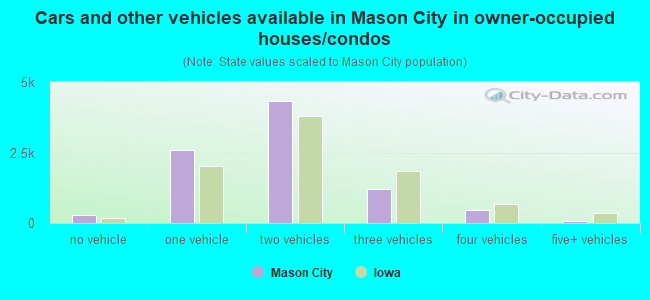
Median number of vehichles in owner occupied houses
Mean number of vehichles in owner occupied houses
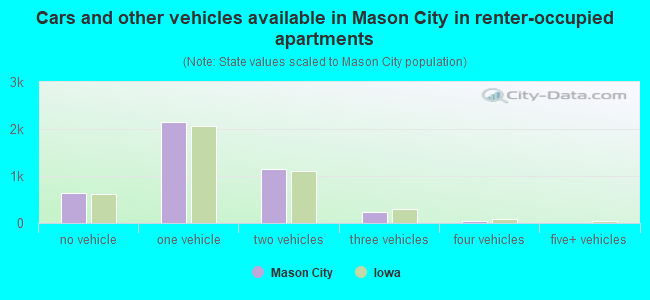
Median number of vehichles in renter occupied houses
Mean number of vehichles in renter occupied houses
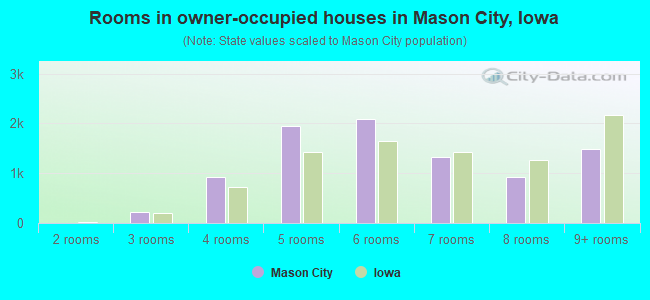
Rooms in owner-occupied houses - 1 room (%)
Rooms in owner-occupied houses - 2 rooms (%)
Rooms in owner-occupied houses - 3 rooms (%)
Rooms in owner-occupied houses - 4 rooms (%)
Rooms in owner-occupied houses - 5 rooms (%)
Rooms in owner-occupied houses - 6 rooms (%)
Rooms in owner-occupied houses - 7 rooms (%)
Rooms in owner-occupied houses - 8 rooms (%)
Rooms in owner-occupied houses - 9+ rooms (%)
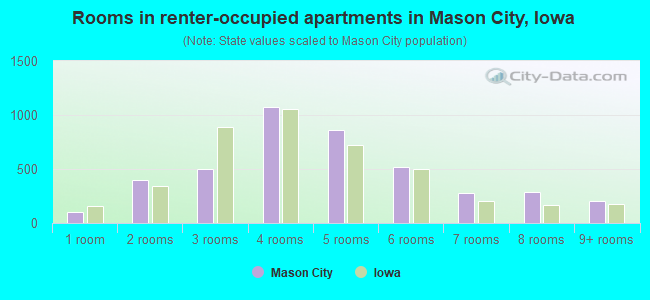
Rooms in renter-occupied houses - 1 room (%)
Rooms in renter-occupied houses - 2 rooms (%)
Rooms in renter-occupied houses - 3 rooms (%)
Rooms in renter-occupied houses - 4 rooms (%)
Rooms in renter-occupied houses - 5 rooms (%)
Rooms in renter-occupied houses - 6 rooms (%)
Rooms in renter-occupied houses - 7 rooms (%)
Rooms in renter-occupied houses - 8 rooms (%)
Rooms in renter-occupied houses - 9+ rooms (%)
Bedrooms in owner-occupied houses - no bedrooms (%)
Bedrooms in owner-occupied houses - 1 bedroom (%)
Bedrooms in owner-occupied houses - 2 bedrooms (%)
Bedrooms in owner-occupied houses - 3 bedrooms (%)
Bedrooms in owner-occupied houses - 4 bedrooms (%)
Bedrooms in owner-occupied houses - 5+ bedrooms (%)
Bedrooms in renter-occupied houses - no bedrooms (%)
Bedrooms in renter-occupied houses - 1 bedroom (%)
Bedrooms in renter-occupied houses - 2 bedrooms (%)
Bedrooms in renter-occupied houses - 3 bedrooms (%)
Bedrooms in renter-occupied houses - 4 bedrooms (%)
Bedrooms in renter-occupied houses - 5+ bedrooms (%)
Vehicles available in owner-occupied houses - no vehicle available (%)
Vehicles available in owner-occupied houses - 1 vehicle available(%)
Vehicles available in owner-occupied houses - 2 Vehicles available (%)
Vehicles available in owner-occupied houses - 3 Vehicles available (%)
Vehicles available in owner-occupied houses - 4 Vehicles available (%)
Vehicles available in owner-occupied houses - 5+ Vehicles available (%)
Vehicles available in renter-occupied houses - no vehicle available (%)
Vehicles available in renter-occupied houses - 1 vehicle available (%)
Vehicles available in renter-occupied houses - 2 Vehicles available (%)
Vehicles available in renter-occupied houses - 3 Vehicles available (%)
Vehicles available in renter-occupied houses - 4 Vehicles available (%)
Vehicles available in renter-occupied houses - 5+ Vehicles available (%)
Housing units in structures - 1, detached (%)
Housing units in structures - 1, attached (%)
Housing units in structures - 2 (%)
Housing units in structures - 3 or 4 (%)
Housing units in structures - 5 to 9 (%)
Housing units in structures - 10 to 19 (%)
Housing units in structures - 20 to 49 (%)
Housing units in structures - 50 or more (%)
Housing units in structures - Mobile home (%)
Housing units in structures - Boat, RV, van, etc. (%)
Housing units in structures - Owners - 1, detached (%)
Housing units in structures - Owners - 1, attached (%)
Housing units in structures - Owners - 2 (%)
Housing units in structures - Owners - 3 or 4 (%)
Housing units in structures - Owners - 5 to 9 (%)
Housing units in structures - Owners - 10 to 19 (%)
Housing units in structures - Owners - 20 to 49 (%)
Housing units in structures - Owners - 50 or more (%)
Housing units in structures - Owners - Mobile home (%)
Housing units in structures - Owners - Boat, RV, van, etc. (%)
Housing units in structures - Renters - 1, detached (%)
Housing units in structures - Renters - 1, attached (%)
Housing units in structures - Renters - 2 (%)
Housing units in structures - Renters - 3 or 4 (%)
Housing units in structures - Renters - 5 to 9 (%)
Housing units in structures - Renters - 10 to 19 (%)
Housing units in structures - Renters - 20 to 49 (%)
Housing units in structures - Renters - 50 or more (%)
Housing units in structures - Renters - Mobile home (%)
Housing units in structures - Renters - Boat, RV, van, etc. (%)
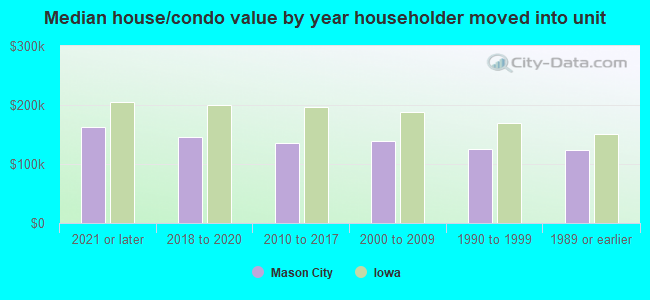
House/condo owner moved in on average (years ago)
Renter moved in on average (years ago)
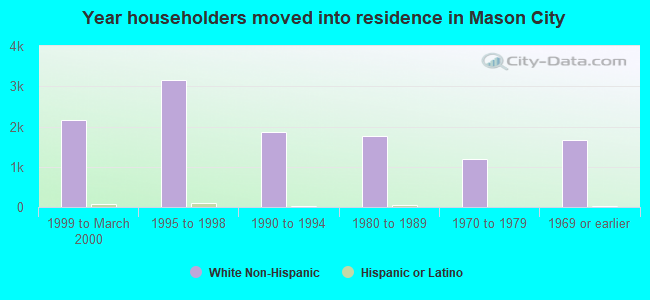
Year householder moved into unit - Moved in 1999 to March 2000 (%)
Year householder moved into unit - Moved in 1999 to March 2000 (%) - White
Year householder moved into unit - Moved in 1999 to March 2000 (%) - Black or African American
Year householder moved into unit - Moved in 1999 to March 2000 (%) - Asian
Year householder moved into unit - Moved in 1999 to March 2000 (%) - Hispanic or Latino
Year householder moved into unit - Moved in 1999 to March 2000 (%) - American Indian and Alaska Native
Year householder moved into unit - Moved in 1999 to March 2000 (%) - Multirace
Year householder moved into unit - Moved in 1999 to March 2000 (%) - Other Race
Year householder moved into unit - Moved in 1995 to 1998 (%)
Year householder moved into unit - Moved in 1995 to 1998 (%) - White
Year householder moved into unit - Moved in 1995 to 1998 (%) - Black or African American
Year householder moved into unit - Moved in 1995 to 1998 (%) - Asian
Year householder moved into unit - Moved in 1995 to 1998 (%) - Hispanic or Latino
Year householder moved into unit - Moved in 1995 to 1998 (%) - American Indian and Alaska Native
Year householder moved into unit - Moved in 1995 to 1998 (%) - Multirace
Year householder moved into unit - Moved in 1995 to 1998 (%) - Other Race
Year householder moved into unit - Moved in 1990 to 1994 (%)
Year householder moved into unit - Moved in 1990 to 1994 (%) - White
Year householder moved into unit - Moved in 1990 to 1994 (%) - Black or African American
Year householder moved into unit - Moved in 1990 to 1994 (%) - Asian
Year householder moved into unit - Moved in 1990 to 1994 (%) - Hispanic or Latino
Year householder moved into unit - Moved in 1990 to 1994 (%) - American Indian and Alaska Native
Year householder moved into unit - Moved in 1990 to 1994 (%) - Multirace
Year householder moved into unit - Moved in 1990 to 1994 (%) - Other Race
Year householder moved into unit - Moved in 1980 to 1989 (%)
Year householder moved into unit - Moved in 1980 to 1989 (%) - White
Year householder moved into unit - Moved in 1980 to 1989 (%) - Black or African American
Year householder moved into unit - Moved in 1980 to 1989 (%) - Asian
Year householder moved into unit - Moved in 1980 to 1989 (%) - Hispanic or Latino
Year householder moved into unit - Moved in 1980 to 1989 (%) - American Indian and Alaska Native
Year householder moved into unit - Moved in 1980 to 1989 (%) - Multirace
Year householder moved into unit - Moved in 1980 to 1989 (%) - Other Race
Year householder moved into unit - Moved in 1970 to 1979 (%)
Year householder moved into unit - Moved in 1970 to 1979 (%) - White
Year householder moved into unit - Moved in 1970 to 1979 (%) - Black or African American
Year householder moved into unit - Moved in 1970 to 1979 (%) - Asian
Year householder moved into unit - Moved in 1970 to 1979 (%) - Hispanic or Latino
Year householder moved into unit - Moved in 1970 to 1979 (%) - American Indian and Alaska Native
Year householder moved into unit - Moved in 1970 to 1979 (%) - Multirace
Year householder moved into unit - Moved in 1970 to 1979 (%) - Other Race
Year householder moved into unit - Moved in 1969 or earlier (%)
Year householder moved into unit - Moved in 1969 or earlier (%) - White
Year householder moved into unit - Moved in 1969 or earlier (%) - Black or African American
Year householder moved into unit - Moved in 1969 or earlier (%) - Asian
Year householder moved into unit - Moved in 1969 or earlier (%) - Hispanic or Latino
Year householder moved into unit - Moved in 1969 or earlier (%) - American Indian and Alaska Native
Year householder moved into unit - Moved in 1969 or earlier (%) - Multirace
Year householder moved into unit - Moved in 1969 or earlier (%) - Other Race
Housing units lacking complete plumbing facilities (%)
Housing units lacking complete kitchen facilities (%)
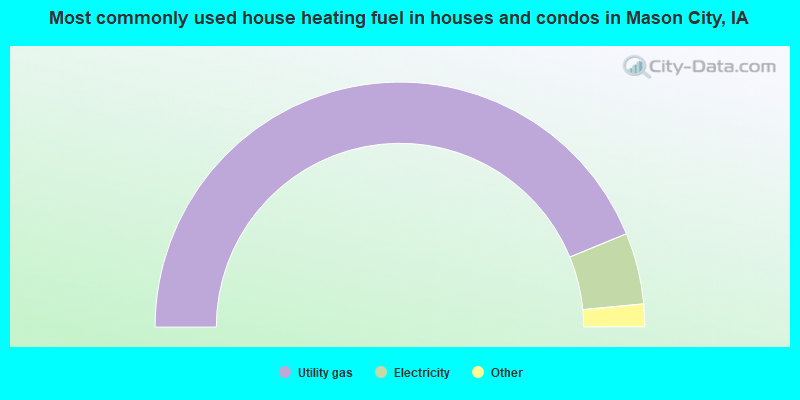
House heating fuel used in houses and condos - Utility gas (%)
House heating fuel used in houses and condos - Bottled, tank, or LP gas (%)
House heating fuel used in houses and condos - Electricity (%)
House heating fuel used in houses and condos - Fuel oil, kerosene, etc. (%)
House heating fuel used in houses and condos - Coal or coke (%)
House heating fuel used in houses and condos - Wood (%)
House heating fuel used in houses and condos - Solar energy (%)
House heating fuel used in houses and condos - Other fuel (%)
House heating fuel used in houses and condos - No fuel used (%)
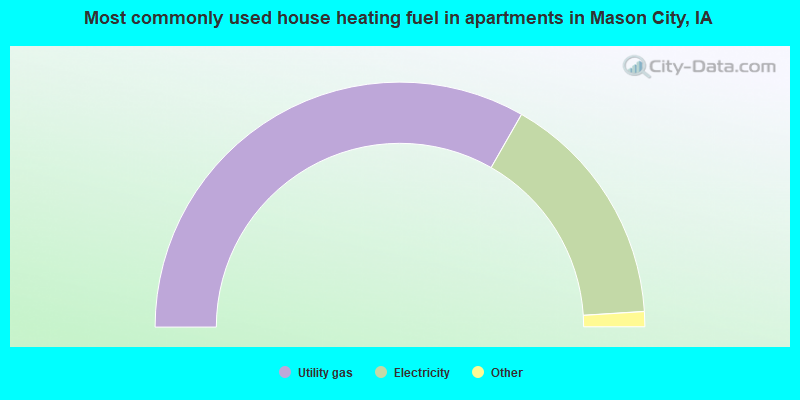
House heating fuel used in apartments - Utility gas (%)
House heating fuel used in apartments - Bottled, tank, or LP gas (%)
House heating fuel used in apartments - Electricity (%)
House heating fuel used in apartments - Fuel oil, kerosene, etc. (%)
House heating fuel used in apartments - Coal or coke (%)
House heating fuel used in apartments - Wood (%)
House heating fuel used in apartments - Solar energy (%)
House heating fuel used in apartments - Other fuel (%)
House heating fuel used in apartments - No fuel used (%)
Median year house/condo built: 1957Median year apartment built: 1955Household type by relationship:
Households: 27,370
Male householders: 6,617 (2,427 living alone ), Female householders: 6,157 (2,358 living alone )5,339 spouses (5,286 opposite-sex spouses ), 1,059 unmarried partners , (1,033 opposite-sex unmarried partners ), 6,205 children (5,644 natural , 195 adopted , 365 stepchildren ), 294 grandchildren , 103 brothers or sisters , 170 parents , 0 foster children , 111 other relatives , 517 non-relatives In group quarters: 793
Size of family households: 4,030 2-persons , 1,483 3-persons , 980 4-persons , 494 5-persons , 143 6-persons , 91 7-or-more-persons .
Size of nonfamily households: 4,977 1-person , 820 2-persons , 122 3-persons , 21 7-or-more-persons .
3,202 married couples with children. single-parent households (509 men , 1,164 women ).
95.9% of residents of Mason City speak English at home. of residents speak Spanish at home (76% speak English very well , 18% speak English well , 6% don't speak English at all ).of residents speak other Indo-European language at home (75% speak English very well , 18% speak English well , 7% speak English not well ).of residents speak Asian or Pacific Island language at home (44% speak English very well , 29% speak English well , 27% speak English not well ).of residents speak other language at home (38% speak English very well , 62% speak English well ).
Foreign born population: 705 (2.6%)of them are naturalized citizens )
Median number of rooms in houses and condos:
Median number of rooms in apartments
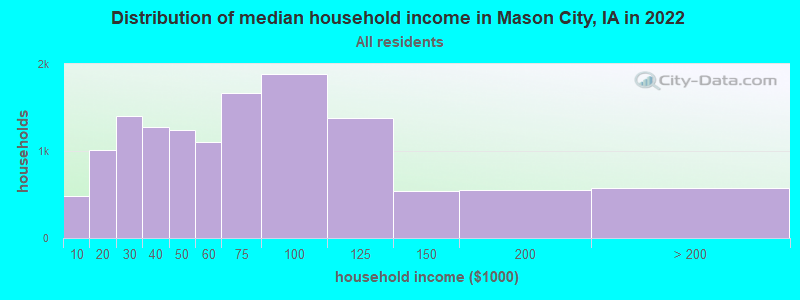
Mason City, IA household income distribution 488 Less than $10,0001,006 $10,000 to $19,9991,402 $20,000 to $29,9991,273 $30,000 to $39,9991,245 $40,000 to $49,9991,107 $50,000 to $59,9991,662 $60,000 to $74,9991,890 $75,000 to $99,9991,385 $100,000 to $124,999543 $125,000 to $149,999552 $150,000 to $199,999575 $200,000 or more
Home value of owner - occupied houses in 2022 in Mason City, IA 122 Less than $10,0004 $10,000 to $14,9994 $15,000 to $19,999117 $20,000 to $24,9998 $25,000 to $29,99912 $30,000 to $34,99953 $35,000 to $39,99931 $40,000 to $49,999228 $50,000 to $59,999582 $60,000 to $69,999473 $70,000 to $79,999500 $80,000 to $89,999558 $90,000 to $99,9991,368 $100,000 to $124,999905 $125,000 to $149,999775 $150,000 to $174,999430 $175,000 to $199,999555 $200,000 to $249,999708 $250,000 to $299,999818 $300,000 to $399,999111 $400,000 to $499,999179 $500,000 to $749,9996 $2,000,000 or moreRent paid by renters in 2022 in Mason City, IA 132 $150 to $19941 $200 to $249126 $300 to $349131 $350 to $399241 $400 to $449171 $450 to $499161 $500 to $549431 $550 to $599503 $600 to $649380 $650 to $699743 $700 to $749258 $750 to $799324 $800 to $899245 $900 to $99947 $1,000 to $1,24932 $1,500 to $1,9995 $2,500 to $2,99951 $3,500 or more141 No cash rent
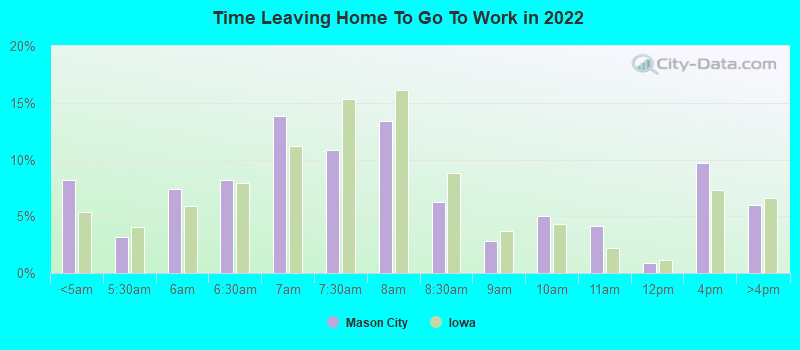
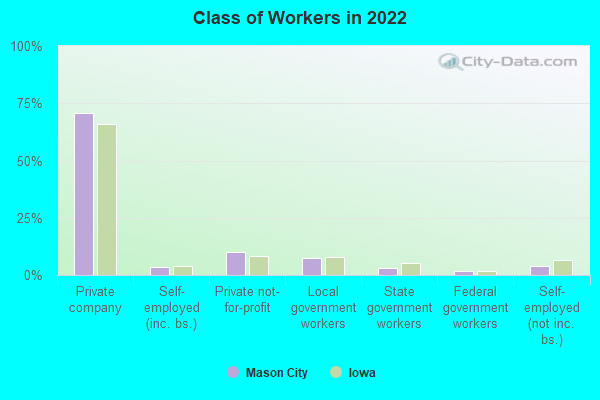
Percentage of workers working in this county: 91.7%Number of people working at home: 771 (5.4% of all workers )
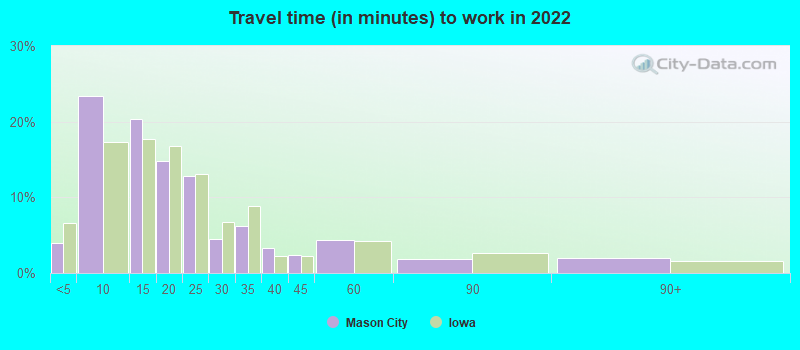
Travel time to work (commute)
Less than 5 minutes: 7545 to 9 minutes: 4,04410 to 14 minutes: 3,64115 to 19 minutes: 1,97320 to 24 minutes: 1,34625 to 29 minutes: 16030 to 34 minutes: 49035 to 39 minutes: 9240 to 44 minutes: 16345 to 59 minutes: 41660 to 89 minutes: 6790 or more minutes: 200
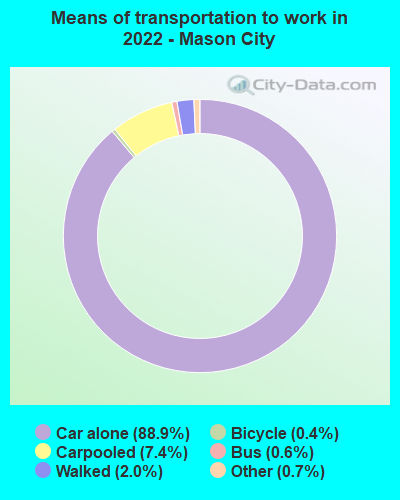
Means of transportation to work:
Drove a car alone: 15,497 (83.7%)Carpooled: 1,354 (7.3%)Bus : 111 (0.6%)Taxi: 115 (0.6%)Bicycle: 89 (0.5%)Walked: 349 (1.9%)Worked at home: 771 (4.2%)
Unemployment by race in 2022
Unemployment rate for White non-Hispanic residents 2.7% Males2.2% FemalesUnemployment rate for Black residents 2.8% FemalesUnemployment rate for other race residents 16.1% MalesUnemployment rate for two or more race residents 0.8% MalesUnemployment rate for Hispanic or Latino residents 4.9% Males3.5% Females
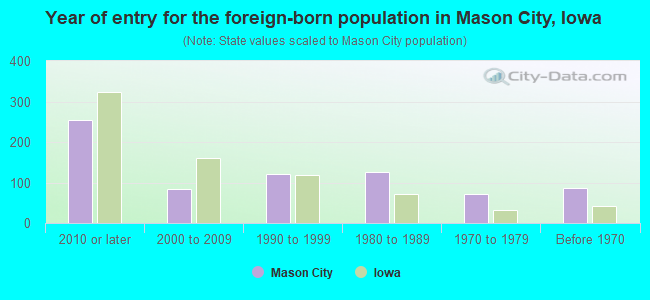
Year of entry for the foreign-born population in Mason City, Iowa
255 2010 or later 85 2000 to 2009 122 1990 to 1999 126 1980 to 1989 71 1970 to 1979 87 Before 1970
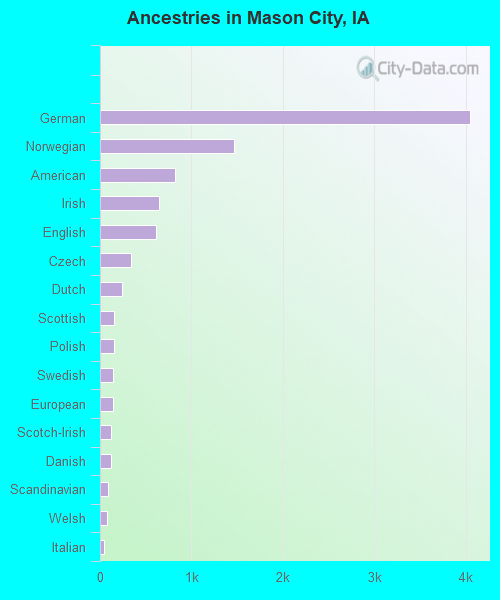
First ancestries reported:
German: 4,050 (34.0%)
Norwegian: 1,469 (12.3%)
American: 818 (6.9%)
Irish: 650 (5.5%)
English: 609 (5.1%)
Czech: 339 (2.8%)
Dutch: 242 (2.0%)
Scottish: 157 (1.3%)
Polish: 148 (1.2%)
Swedish: 143 (1.2%)
European: 137 (1.1%)
Scotch-Irish: 120 (1.0%)
Danish: 119 (1.0%)
Scandinavian: 84 (0.7%)
Welsh: 76 (0.6%)
Italian: 39 (0.3%)
Austrian: 34 (0.3%)
Greek: 33 (0.3%)
French: 31 (0.3%)
Swiss: 30 (0.3%)
Eastern European: 27 (0.2%)
French Canadian: 22 (0.2%)
Portuguese: 19 (0.2%)
Pennsylvania German: 17 (0.1%)
Belgian: 16 (0.1%)
Northern European: 16 (0.1%)
Hungarian: 14 (0.1%)
Czechoslovakian: 13 (0.1%)
Ukrainian: 12 (0.1%)
Serbian: 10 (0.08%)
British: 7 (0.06%)
African: 7 (0.06%)
Ghanaian: 5 (0.04%)
Australian: 4 (0.03%)
Kenyan: 3 (0.03%) Most common places of birth for foreign-born residents (%): Mexico Mason City:
34.6% (233)Iowa:
23.3% (41,625)
Vietnam Mason City:
20.5% (138)Iowa:
4.2% (7,428)
Micronesia Mason City:
13.2% (89)Iowa:
0.7% (1,305)
Democratic Republic of Congo (Zaire) Mason City:
4.8% (32)Iowa:
2.1% (3,735)
Morocco Mason City:
4.3% (29)Iowa:
0.3% (500)
England Mason City:
4.0% (27)Iowa:
0.5% (827)
Other Southern Africa Mason City:
2.8% (19)Iowa:
0.0% (88)
Philippines Mason City:
2.7% (18)Iowa:
2.6% (4,675)
Russia Mason City:
1.9% (13)Iowa:
0.8% (1,425)
Togo Mason City:
1.8% (12)Iowa:
0.4% (798)
Indonesia Mason City:
1.6% (11)Iowa:
0.2% (437)
Place of birth for U.S.-born residents:
This state: 20,104Other state: 6,295Northeast: 247Midwest: 3,898South: 1,202West: 943 87.9% of Mason City residents lived in the same house 1 years ago.
Out of people who lived in different houses, 37.0% lived in this county.
Out of people who lived in different counties, 65.9% lived in Iowa.
Mason City:
87.9%State average:
87.2%
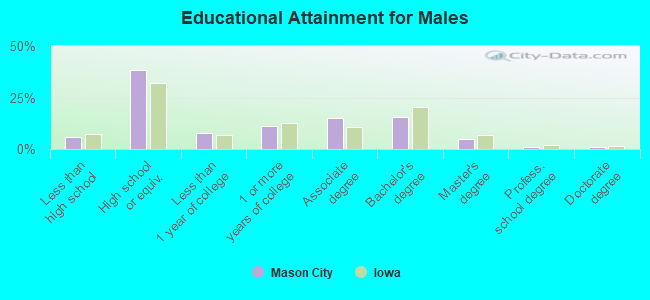
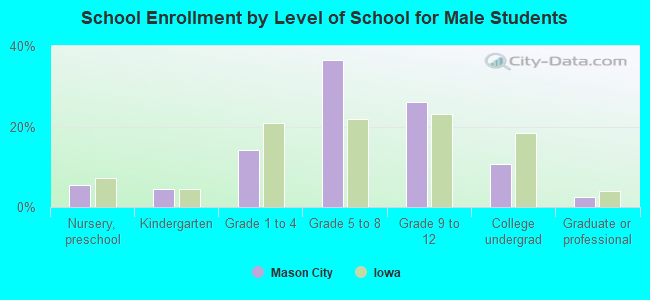
Education attainment for males 25 years and older:
No schooling: 146Nursery to 4th grade: 05th and 6th grade: 07th and 8th grade: 169th grade: 1910th grade: 6611th grade: 21012th grade, no diploma: 89High school graduate (or equivalency): 3,666Less than 1 year of college: 760Some college more than 1 year, no degree: 1,064Associate degree: 1,451Bachelor's degree: 1,477Master's degree: 489Professional school degree: 86Doctorate degree: 78
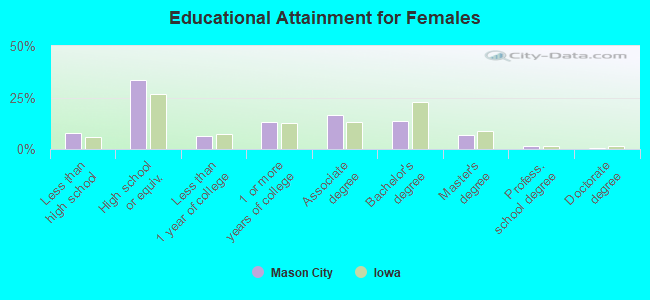
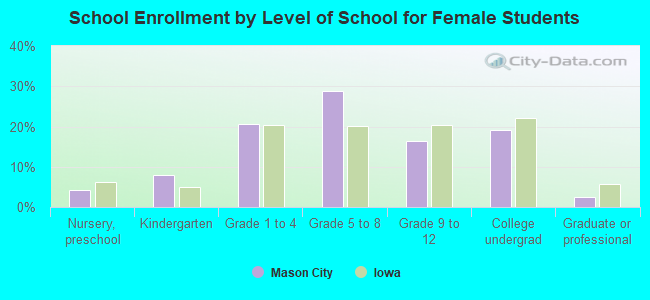
Education attainment for females 25 years and older:
No schooling: 75Nursery to 4th grade: 405th and 6th grade: 87th and 8th grade: 1289th grade: 2810th grade: 13311th grade: 23112th grade, no diploma: 139High school graduate (or equivalency): 3,384Less than 1 year of college: 615Some college more than 1 year, no degree: 1,339Associate degree: 1,653Bachelor's degree: 1,366Master's degree: 687Professional school degree: 152Doctorate degree: 61
Housing units in structures:
One, detached: 10,820One, attached: 512Two: 4823 or 4: 4825 to 9: 50910 to 19: 28720 to 49: 47150 or more: 482Mobile homes: 288Median worth of mobile homes: $25,591
Housing units lacking complete plumbing facilities in 2022: 1.9%Housing units lacking complete kitchen facilities in 2022: 3.3%House/condo owner moved in on average 13 years ago
Renter moved in on average 4 years ago
Private vs. public school enrollment:
Students in private schools in grades 1 to 8 (elementary and middle school): 199 Students in private schools in grades 9 to 12 (high school): 189 Students in private undergraduate colleges: 179