Housing density: 742 houses/condos per square mile
Median price asked for vacant for-sale houses and condos in 2022 in this county: $171,993.
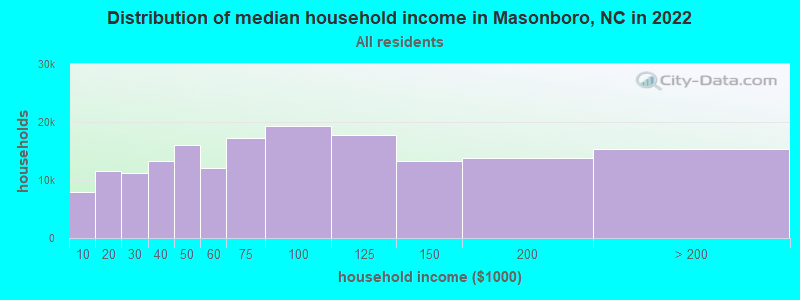
Median contract rent in 2022: $1,602 (lower quartile is $990, upper quartile is $1,998)
Median gross rent in Masonboro, NC in 2022: $1,836
Housing units in Masonboro with a mortgage: 3,118 (439 second mortgage, 653 home equity loan, 15 both second mortgage and home equity loan) Houses without a mortgage: 530
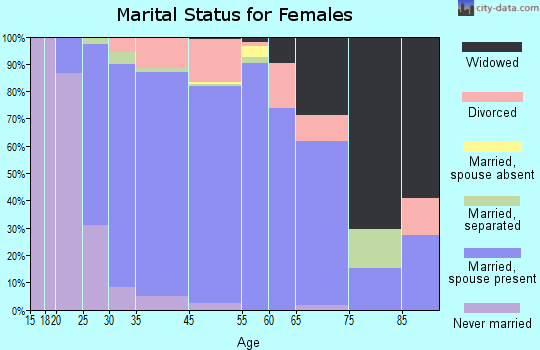
In family households: 147,221 (33,349 male householders, 16,631 female householders)
36,309 spouses, 47,519 children (44,331 natural, 1,287 adopted, 1,901 stepchildren), 3,380 grandchildren, 1,887 brothers or sisters, 1,368 parents, foster children, 1,850 other relatives, 4,148 non-relatives
In nonfamily households: 48,748 (16,567 male householders (11,236 living alone)), 19,499 female householders (15,180 living alone)), 12,682 nonrelatives
In group quarters: 6,698 (1,837 institutionalized population)
21,214 married couples with children.
9,136 single-parent households (1,335 men, 7,801 women).
95.4% of residents of Masonboro speak English at home.
1.4% of residents speak Spanish at home (89% speak English very well, 11% speak English well).
1.9% of residents speak other Indo-European language at home (80% speak English very well, 15% speak English well, 4% speak English not well).
0.5% of residents speak Asian or Pacific Island language at home (51% speak English very well, 33% speak English well, 5% speak English not well, 11% don't speak English at all).
0.8% of residents speak other language at home (79% speak English very well, 11% speak English well, 10% speak English not well).
Foreign born population: 1,170 (6.7%)
(62.1% of them are naturalized citizens)
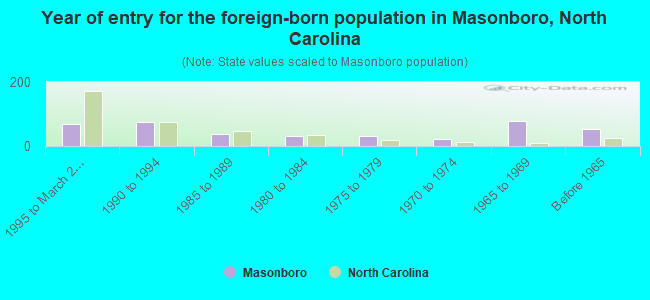
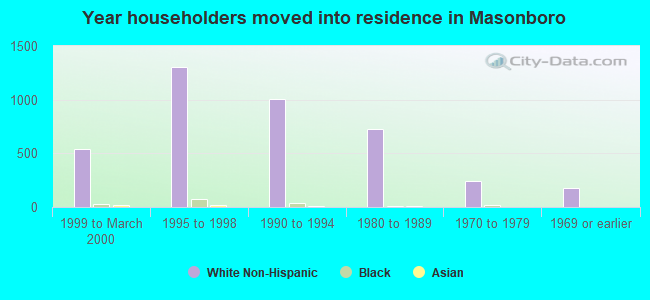
Year of entry for the foreign-born population in Masonboro, North Carolina
681995 to March 2000
751990 to 1994
381985 to 1989
321980 to 1984
311975 to 1979
231970 to 1974
781965 to 1969
53Before 1965
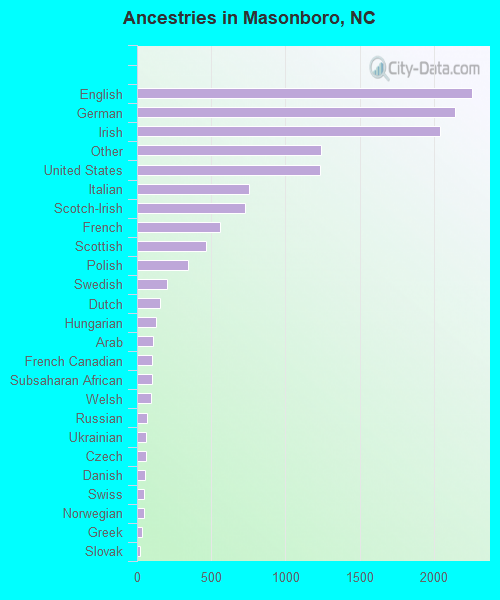
First ancestries reported:
English: 2,259 (17.3%)
German: 2,143 (16.4%)
Irish: 2,045 (15.6%)
Other: 1,242 (9.5%)
United States: 1,231 (9.4%)
Italian: 755 (5.8%)
Scotch-Irish: 725 (5.5%)
French: 560 (4.3%)
Scottish: 467 (3.6%)
Polish: 347 (2.7%)
Swedish: 199 (1.5%)
Dutch: 153 (1.2%)
Hungarian: 127 (1.0%)
Arab: 108 (0.8%)
French Canadian: 102 (0.8%)
Subsaharan African: 101 (0.8%)
Welsh: 97 (0.7%)
Russian: 70 (0.5%)
Ukrainian: 62 (0.5%)
Czech: 61 (0.5%)
Danish: 51 (0.4%)
Swiss: 45 (0.3%)
Norwegian: 44 (0.3%)
Greek: 37 (0.3%)
Slovak: 22 (0.2%)
Lithuanian: 17 (0.1%)
Most common places of birth for foreign-born residents (%):
Canada
Masonboro:
17.3% (69)
North Carolina:
3.3% (14,317)
Germany
Masonboro:
15.6% (62)
North Carolina:
3.8% (16,166)
United Kingdom
Masonboro:
6.5% (26)
North Carolina:
3.3% (14,034)
Korea
Masonboro:
6.0% (24)
North Carolina:
2.3% (9,836)
Nigeria
Masonboro:
5.5% (22)
North Carolina:
0.7% (3,123)
Egypt
Masonboro:
4.0% (16)
North Carolina:
0.4% (1,661)
Venezuela
Masonboro:
4.0% (16)
North Carolina:
0.4% (1,646)
India
Masonboro:
3.5% (14)
North Carolina:
3.8% (16,264)
Sierra Leone
Masonboro:
3.5% (14)
North Carolina:
0.1% (643)
Australia
Masonboro:
3.5% (14)
North Carolina:
0.2% (1,023)
Other Western Asia
Masonboro:
3.3% (13)
North Carolina:
0.4% (1,698)
China, excluding Hong Kong and Taiwan
Masonboro:
3.0% (12)
North Carolina:
2.1% (8,816)
Vietnam
Masonboro:
2.8% (11)
North Carolina:
3.2% (13,608)
Other Northern Africa
Masonboro:
2.5% (10)
North Carolina:
0.4% (1,728)
Colombia
Masonboro:
2.5% (10)
North Carolina:
1.3% (5,529)
Sweden
Masonboro:
2.3% (9)
North Carolina:
0.3% (1,266)
France
Masonboro:
2.0% (8)
North Carolina:
0.5% (2,158)
Italy
Masonboro:
2.0% (8)
North Carolina:
0.5% (2,246)
Russia
Masonboro:
2.0% (8)
North Carolina:
0.6% (2,673)
Japan
Masonboro:
2.0% (8)
North Carolina:
1.1% (4,933)
Ireland
Masonboro:
1.8% (7)
North Carolina:
0.3% (1,145)
Czechoslovakia (includes Czech Republic and Slovakia)
Masonboro:
1.8% (7)
North Carolina:
0.3% (1,087)
Other Eastern Europe
Masonboro:
1.8% (7)
North Carolina:
0.5% (1,980)
Place of birth for U.S.-born residents:
This state: 5,317
Other state: 6,093
Northeast: 2,299
Midwest: 1,102
South: 2,310
West: 382
54% of Masonboro residents lived in the same house 5 years ago. Out of people who lived in different houses, 41% lived in this county. Out of people who lived in different counties, 34% lived in North Carolina.
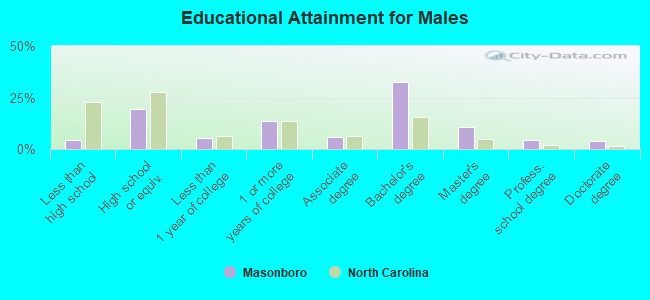
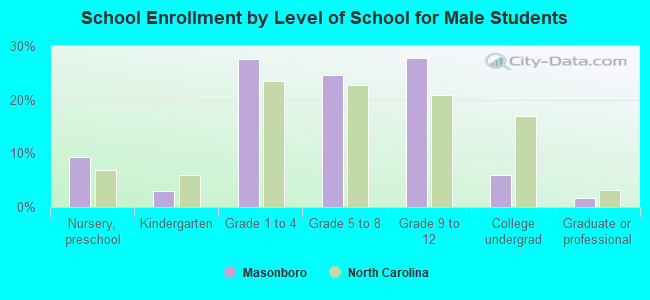
Education attainment for males 25 years and older:
No schooling: 0
Nursery to 4th grade: 9
5th and 6th grade: 16
7th and 8th grade: 16
9th grade: 8
10th grade: 38
11th grade: 40
12th grade, no diploma: 29
High school graduate (or equivalency): 727
Less than 1 year of college: 198
Some college more than 1 year, no degree: 496
Associate degree: 215
Bachelor's degree: 1,203
Master's degree: 404
Professional school degree: 156
Doctorate degree: 145
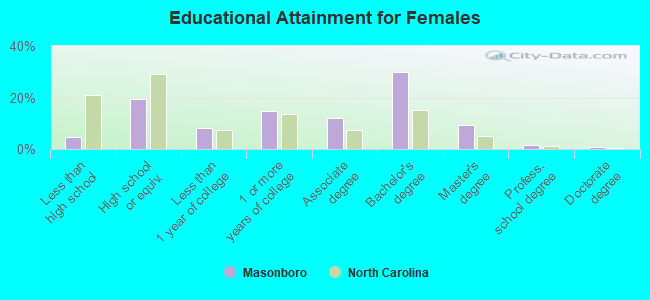
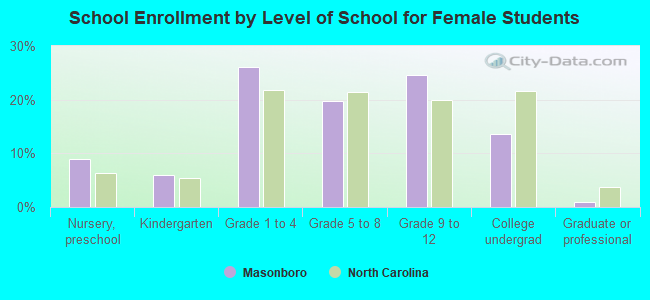
Education attainment for females 25 years and older:
No schooling: 11
Nursery to 4th grade: 0
5th and 6th grade: 16
7th and 8th grade: 19
9th grade: 31
10th grade: 33
11th grade: 35
12th grade, no diploma: 44
High school graduate (or equivalency): 819
Less than 1 year of college: 344
Some college more than 1 year, no degree: 621
Associate degree: 502
Bachelor's degree: 1,258
Master's degree: 386
Professional school degree: 59
Doctorate degree: 25
Housing units in structures:
One, detached: 4,202
One, attached: 68
Two: 46
3 or 4: 8
5 to 9: 21
20 to 49: 9
Mobile homes: 87
Boats, RVs, vans, etc.: 8
Median worth of mobile homes: $46,400
Housing units lacking complete plumbing facilities: 0.3%
Housing units lacking complete kitchen facilities: 0.9%