Mayo, MD (Maryland) Houses and Residents
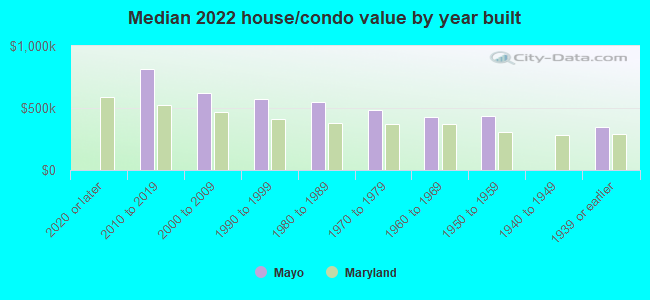
| Mayo: | $577,439 |
| Maryland: | $398,100 |
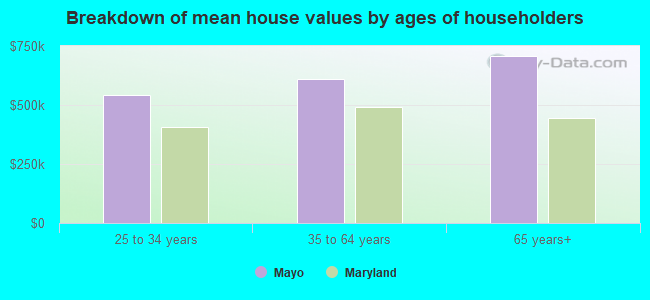
Mean price in 2022:
Detached houses: $663,493
Here: $663,493 State: $526,819
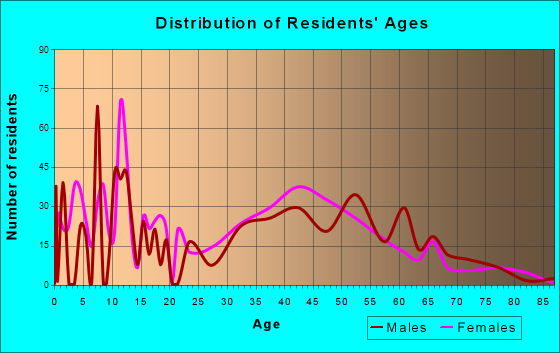
Total population: 8,298 (Urban population: 3,222, Rural population: 0)
Houses: 3,306 (3,010 occupied: 2,537 owner occupied, 491 renter occupied)
| % of renters here: | 16% |
| State: | 32% |
Housing density: 1,304 houses/condos per square mile
Median price asked for vacant for-sale houses and condos in 2022: $347,077.
Median contract rent in 2022: $1,779 (lower quartile is $1,380, upper quartile is over $2,000)
Median rent asked for vacant for-rent units in 2022: $897
Median gross rent in Mayo, MD in 2022: over $2,000
Housing units in Mayo with a mortgage: 1,931 (113 second mortgage, 0 home equity loan, 87 both second mortgage and home equity loan)
Houses without a mortgage: 74
Median household income for houses/condos with a mortgage: $158,677
Median household income for apartments without a mortgage: $136,662
Median monthly housing costs: $2,162
Compare current foreclosures near Mayo, MD:
| Photo | Address | Area | Beds / Baths | Price | Details |
|---|---|---|---|---|---|

|
#1
Gladys Retreat Cir
Bowie, MD 20720
|
2,880 sq. feet
|
3 baths 3 beds |
$409,900
|
show details |

|
#2
Heming Ln
Bowie, MD 20716
|
1,800 sq. feet
|
2 baths 3 beds |
$400,000
|
show details |

|
#3
Rolling Meadows Rd
Upper Marlboro, MD 20772
|
2,459 sq. feet
|
2 baths 3 beds |
$405,000
|
show details |

|
#4
Elkhorn Ln
Bowie, MD 20716
|
1,514 sq. feet
|
2 baths 3 beds |
$425,250
|
show details |

|
#5
Silverwood Cir Apt 2
Annapolis, MD 21403
|
1,312 sq. feet
|
2 baths 2 beds |
$249,600
|
show details |

|
#6
Ensleigh Ln
Bowie, MD 20716
|
1,656 sq. feet
|
2 baths 3 beds |
$374,900
|
show details |

|
#7
Brooke Ln
Upper Marlboro, MD 20772
|
- sq. feet
|
5 baths 6 beds |
$949,000
|
show details |

|
#8
Rexford Way
Upper Marlboro, MD 20774
|
3,334 sq. feet
|
3 baths 5 beds |
show details | |

|
#9
Deale Rd
Tracys Landing, MD 20779
|
1,472 sq. feet
|
1 baths 3 beds |
show details | |

|
#10
1st Ave
Edgewater, MD 21037
|
2,496 sq. feet
|
3 baths 4 beds |
show details |
| Photo | Address | Area | Beds / Baths | Price | Details |
|---|---|---|---|---|---|

|
#11
Eddy Rd
Crownsville, MD 21032
|
1,100 sq. feet
|
2 baths 2 beds |
show details | |

|
#12
Dery Rd
Upper Marlboro, MD 20772
|
816 sq. feet
|
1 baths 3 beds |
show details | |

|
#13
Mainsail Dr
Stevensville, MD 21666
|
2,424 sq. feet
|
3 baths 4 beds |
show details | |

|
#14
Burkes Promise Dr
Bowie, MD 20720
|
2,984 sq. feet
|
4 baths 5 beds |
show details | |

|
#15
Newton Ct
Upper Marlboro, MD 20772
|
1,092 sq. feet
|
2 baths 3 beds |
show details | |

|
#16
Henderson Chapel Ln
Bowie, MD 20720
|
4,002 sq. feet
|
3 baths 4 beds |
show details | |

|
#17
Chesapeake Ave
Chesapeake Beach, MD 20732
|
776 sq. feet
|
1 baths 2 beds |
show details | |

|
#18
Coronella Ct
Upper Marlboro, MD 20774
|
3,386 sq. feet
|
6 baths 6 beds |
show details | |

|
#19
Dennington Dr
Bowie, MD 20721
|
4,164 sq. feet
|
2 baths 4 beds |
show details | |

|
#20
Glenn Dale Rd
Bowie, MD 20720
|
3,072 sq. feet
|
5 baths - beds |
show details |
| Photo | Address | Area | Beds / Baths | Price | Details |
|---|---|---|---|---|---|

|
#21
Holly Hock Ct
Upper Marlboro, MD 20774
|
2,874 sq. feet
|
2 baths - beds |
show details | |

|
#22
Deering Rd
Pasadena, MD 21122
|
1,026 sq. feet
|
1 baths 2 beds |
show details | |

|
#23
Migsby Ct
Upper Marlboro, MD 20774
|
1,560 sq. feet
|
2 baths - beds |
show details | |

|
#24
Oaklawn Ave
Annapolis, MD 21401
|
696 sq. feet
|
1 baths - beds |
show details | |

|
#25
Reverend Boucher Pl
Upper Marlboro, MD 20772
|
1,320 sq. feet
|
2 baths - beds |
show details | |

|
#26
Live Oak Dr
Millersville, MD 21108
|
2,886 sq. feet
|
2 baths - beds |
show details | |

|
#27
Spring Branch Dr
Upper Marlboro, MD 20772
|
816 sq. feet
|
1 baths - beds |
show details | |

|
#28
Galaxy Ln
Bowie, MD 20715
|
2,072 sq. feet
|
2 baths - beds |
show details | |

|
#29
Silver Teal Way
Upper Marlboro, MD 20774
|
1,540 sq. feet
|
2 baths - beds |
show details | |

|
#30
Geese Ct
Upper Marlboro, MD 20772
|
2,545 sq. feet
|
3 baths - beds |
show details |
| Photo | Address | Area | Beds / Baths | Price | Details |
|---|---|---|---|---|---|

|
#31
Burleigh St
Upper Marlboro, MD 20774
|
1,904 sq. feet
|
2 baths - beds |
show details | |

|
#32
Burleigh St
Upper Marlboro, MD 20774
|
1,852 sq. feet
|
2 baths - beds |
show details | |

|
#33
Whiteholm Dr
Upper Marlboro, MD 20774
|
2,102 sq. feet
|
2 baths - beds |
show details | |

|
#34
Colonel Ashton Pl
Upper Marlboro, MD 20772
|
1,496 sq. feet
|
2 baths - beds |
show details | |

|
#35
Baikal Loop
Upper Marlboro, MD 20774
|
1,552 sq. feet
|
3 baths - beds |
show details | |

|
#36
Memphis Ln
Bowie, MD 20715
|
1,575 sq. feet
|
2 baths - beds |
show details | |

|
#37
Edsall St
Upper Marlboro, MD 20772
|
3,164 sq. feet
|
2 baths - beds |
show details | |

|
#38
Pennsylvania Ave
Pasadena, MD 21122
|
1,614 sq. feet
|
2 baths - beds |
show details | |

|
#39
Whistling Duck Dr
Upper Marlboro, MD 20774
|
3,180 sq. feet
|
3 baths - beds |
show details | |

|
#40
Delaware Ave
Pasadena, MD 21122
|
1,526 sq. feet
|
2 baths - beds |
show details |
| Photo | Address | Area | Beds / Baths | Price | Details |
|---|---|---|---|---|---|

|
#41
Dawn Whistle Way
Bowie, MD 20721
|
4,608 sq. feet
|
3 baths - beds |
show details | |

|
#42
Lakevale Ter
Bowie, MD 20720
|
2,802 sq. feet
|
2 baths - beds |
show details | |

|
#43
Andean Goose Way
Upper Marlboro, MD 20774
|
2,848 sq. feet
|
2 baths - beds |
show details | |

|
#44
Cove Rd
Edgewater, MD 21037
|
1,532 sq. feet
|
2 baths - beds |
show details | |

|
#45
Captain Bayne Ct
Upper Marlboro, MD 20772
|
1,334 sq. feet
|
2 baths - beds |
show details | |

|
#46
Isham Ct
Upper Marlboro, MD 20774
|
1,326 sq. feet
|
2 baths - beds |
show details | |

|
#47
Harlem Ave
Pasadena, MD 21122
|
1,880 sq. feet
|
2 baths - beds |
show details | |

|
#48
Pushaw Station Rd
Sunderland, MD 20689
|
1,988 sq. feet
|
1 baths - beds |
show details | |

|
#49
Gwinnett Ln
Bowie, MD 20720
|
2,327 sq. feet
|
2 baths - beds |
show details | |

|
Check over 1 million property listings on Foreclosure.com!
|
browse all offers | |||

Latest news about housing in Mayo, MD collected exclusively by city-data.com from local newspapers, TV, and radio stations

 | Great Crab Cakes — Where to Go Nearby? (College Park) (25 replies) |
| The actual regions of Maryland? (47 replies) |
| Edgewater, MD? (1 reply) |
| Severna park rich people rant by poor person (59 replies) |
| Rural, "Rednecky" Area of Maryland (156 replies) |
| Help needed [ moving to Annapolis] (9 replies) |
Median year apartment built: 1983
Household type by relationship:
Households: 8,327- Male householders: 1,296 (233 living alone), Female householders: 1,697 (307 living alone)
1,913 spouses (1,874 opposite-sex spouses), 107 unmarried partners, (96 opposite-sex unmarried partners), 2,759 children (2,572 natural, 80 adopted, 105 stepchildren), 75 grandchildren, 77 brothers or sisters, 172 parents, 0 foster children, 181 other relatives, 43 non-relatives
- In group quarters: 2
Size of family households: 912 2-persons, 680 3-persons, 458 4-persons, 267 5-persons, 62 6-persons.
Size of nonfamily households: 566 1-person, 45 2-persons.
1,455 married couples with children.
327 single-parent households (166 men, 161 women).
93.1% of residents of Mayo speak English at home.
3.3% of residents speak Spanish at home (97% speak English very well, 3% speak English well).
1.2% of residents speak other Indo-European language at home (86% speak English very well, 4% speak English well, 10% speak English not well).
1.0% of residents speak Asian or Pacific Island language at home (44% speak English very well, 23% speak English well, 33% speak English not well).
0.3% of residents speak other language at home (60% speak English well, 40% speak English not well).
Foreign born population: 266 (3.2%)
(71.4% of them are naturalized citizens)
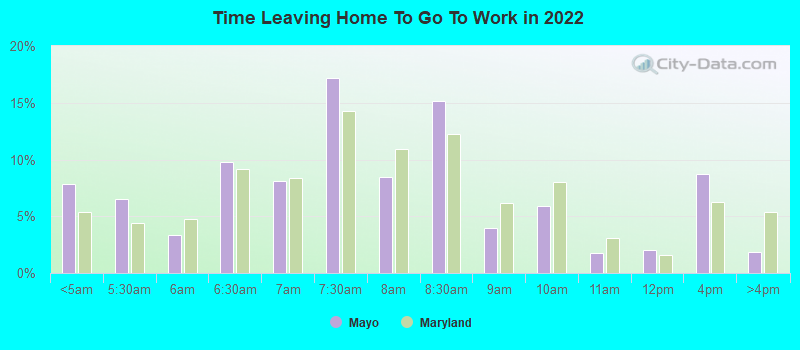
| Here: | 7.9 |
| State: | 7.3 |
| Here: | 6.1 |
| State: | 4.2 |
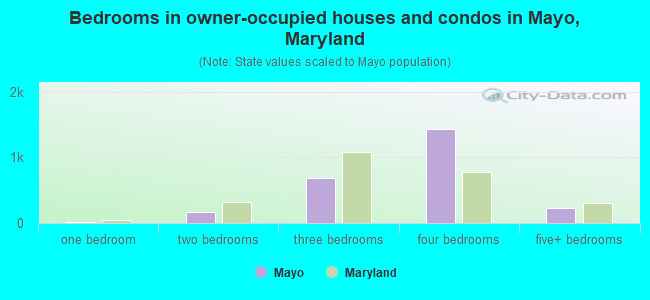
- Bedrooms in owner-occupied houses and condos in Mayo, Maryland
- 0no bedroom
- 121 bedroom
- 1672 bedrooms
- 6933 bedrooms
- 1,4334 bedrooms
- 2325+ bedrooms
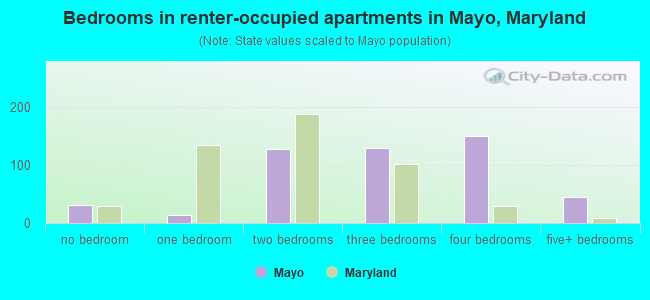
- Bedrooms in renter-occupied apartments in Mayo, Maryland
- 31no bedroom
- 131 bedroom
- 1272 bedrooms
- 1293 bedrooms
- 1494 bedrooms
- 445+ bedrooms
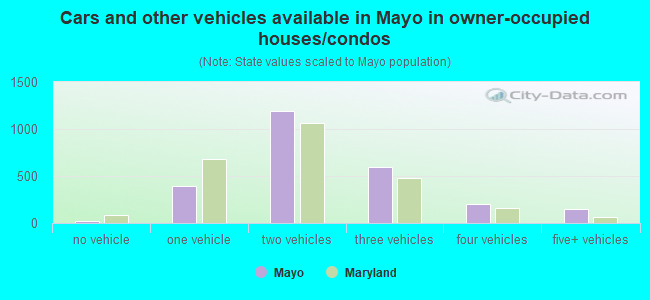
- Cars and other vehicles available in Mayo in owner-occupied houses/condos
- 18no vehicle
- 3941 vehicle
- 1,1872 vehicles
- 5923 vehicles
- 2024 vehicles
- 1445+ vehicles
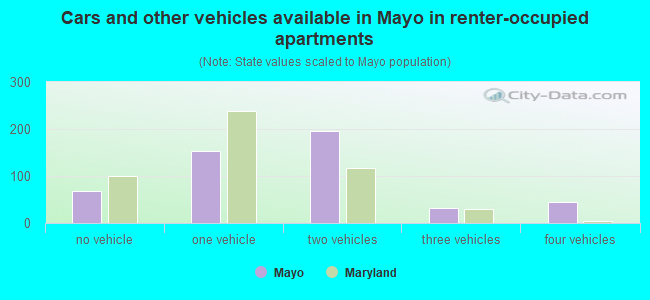
- Cars and other vehicles available in Mayo in renter-occupied apartments
- 69no vehicle
- 1531 vehicle
- 1952 vehicles
- 313 vehicles
- 444 vehicles
- 05+ vehicles
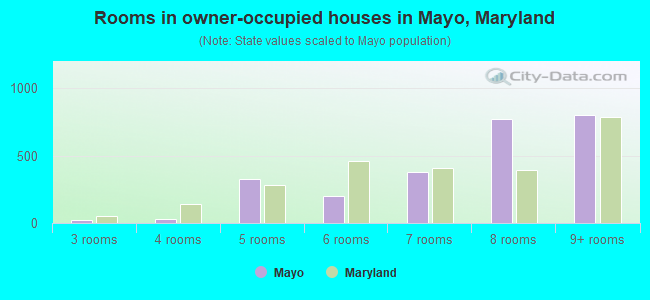
- Rooms in owner-occupied houses in Mayo, Maryland
- 01 room
- 02 rooms
- 223 rooms
- 334 rooms
- 3305 rooms
- 1996 rooms
- 3827 rooms
- 7708 rooms
- 8029+ rooms
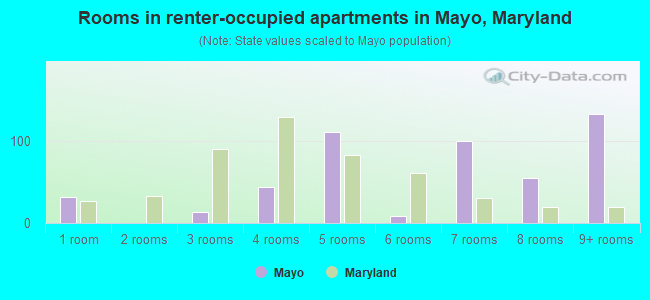
- Rooms in renter-occupied apartments in Mayo, Maryland
- 311 room
- 02 rooms
- 133 rooms
- 444 rooms
- 1105 rooms
- 86 rooms
- 997 rooms
- 558 rooms
- 1329+ rooms
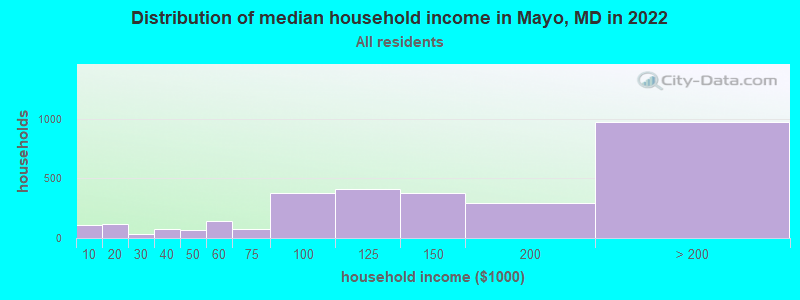
Mayo, MD household income distribution

- 113Less than $10,000
- 118$10,000 to $19,999
- 36$20,000 to $29,999
- 73$30,000 to $39,999
- 64$40,000 to $49,999
- 140$50,000 to $59,999
- 79$60,000 to $74,999
- 376$75,000 to $99,999
- 411$100,000 to $124,999
- 377$125,000 to $149,999
- 291$150,000 to $199,999
- 972$200,000 or more
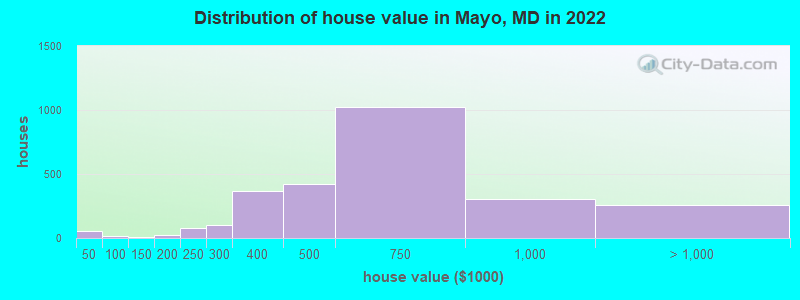
Home value of owner - occupied houses in 2022 in Mayo, MD
-
- 35$30,000 to $34,999
- 15$40,000 to $49,999
- 11$125,000 to $149,999
- 21$150,000 to $174,999
- 77$200,000 to $249,999
- 99$250,000 to $299,999
- 364$300,000 to $399,999
- 419$400,000 to $499,999
- 1,020$500,000 to $749,999
- 301$750,000 to $999,999
- 122$1,000,000 to $1,499,999
- 97$1,500,000 to $1,999,999
- 35$2,000,000 or more
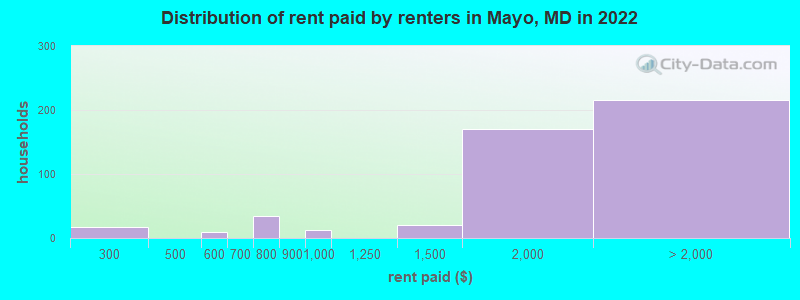
Rent paid by renters in 2022 in Mayo, MD
-
- 17$250 to $299
- 8$550 to $599
- 33$750 to $799
- 13$900 to $999
- 20$1,250 to $1,499
- 170$1,500 to $1,999
- 38$2,000 to $2,499
- 115$2,500 to $2,999
- 8$3,000 to $3,499
- 52No cash rent
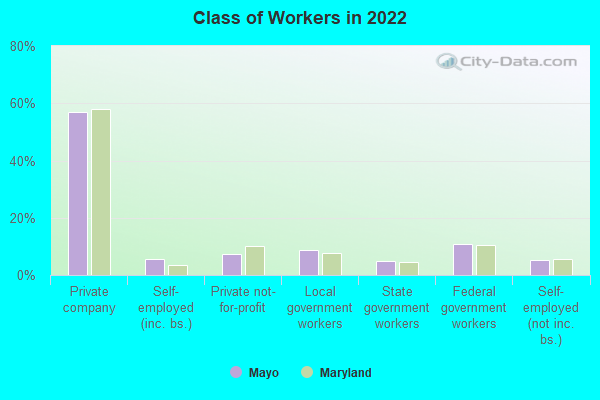
Percentage of workers working in this county: 69.7%
Number of people working at home: 1,487 (33.2% of all workers)
Travel time to work (commute)
- Less than 5 minutes: 36
- 5 to 9 minutes: 157
- 10 to 14 minutes: 116
- 15 to 19 minutes: 415
- 20 to 24 minutes: 255
- 25 to 29 minutes: 256
- 30 to 34 minutes: 399
- 35 to 39 minutes: 179
- 40 to 44 minutes: 436
- 45 to 59 minutes: 357
- 60 to 89 minutes: 351
- 90 or more minutes: 133
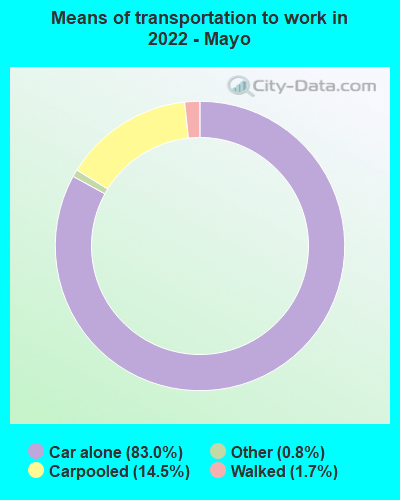
Means of transportation to work:
- Drove a car alone: 494 (27.9%)
- Carpooled: 87 (4.9%)
- Taxi: 5 (0.3%)
- Walked: 10 (0.6%)
- Worked at home: 1,487 (83.9%)
- Unemployment by race in 2022
- Unemployment rate for White non-Hispanic residents
- 8.6%Males
- 1.8%Females
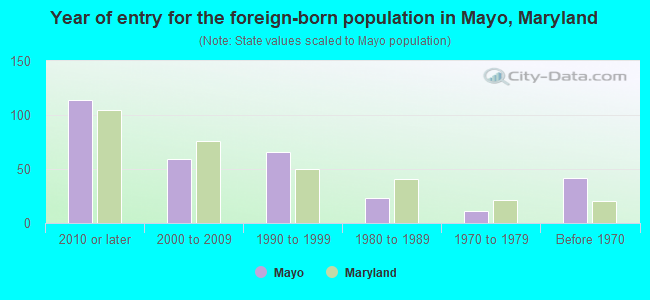
- Year of entry for the foreign-born population in Mayo, Maryland
- 1142010 or later
- 592000 to 2009
- 661990 to 1999
- 231980 to 1989
- 111970 to 1979
- 42Before 1970
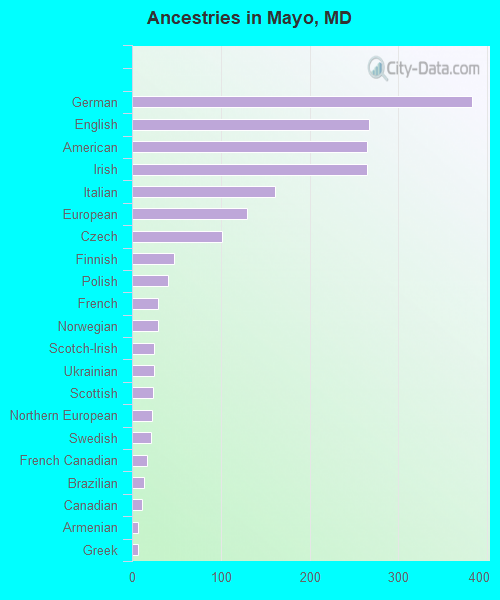
First ancestries reported:
- German: 383 (15.1%)
- English: 267 (10.5%)
- American: 265 (10.4%)
- Irish: 265 (10.4%)
- Italian: 161 (6.3%)
- European: 129 (5.1%)
- Czech: 101 (4.0%)
- Finnish: 47 (1.8%)
- Polish: 41 (1.6%)
- French: 29 (1.1%)
- Norwegian: 29 (1.1%)
- Scotch-Irish: 25 (1.0%)
- Ukrainian: 25 (1.0%)
- Scottish: 24 (0.9%)
- Northern European: 22 (0.9%)
- Swedish: 21 (0.8%)
- French Canadian: 17 (0.7%)
- Brazilian: 14 (0.6%)
- Canadian: 11 (0.4%)
- Armenian: 7 (0.3%)
- Greek: 7 (0.3%)
- Lithuanian: 3 (0.1%)
Most common places of birth for foreign-born residents (%):
| Mayo: | 23.3% (64) |
| Maryland: | 12.0% (115,412) |
| Mayo: | 15.3% (42) |
| Maryland: | 1.8% (17,161) |
| Mayo: | 13.5% (37) |
| Maryland: | 0.4% (3,874) |
| Mayo: | 11.3% (31) |
| Maryland: | 4.6% (44,742) |
| Mayo: | 5.5% (15) |
| Maryland: | 1.2% (11,980) |
| Mayo: | 4.7% (13) |
| Maryland: | 1.0% (9,481) |
| Mayo: | 4.4% (12) |
| Maryland: | 0.1% (502) |
| Mayo: | 4.0% (11) |
| Maryland: | 0.7% (6,326) |
| Mayo: | 4.0% (11) |
| Maryland: | 0.9% (8,603) |
| Mayo: | 3.6% (10) |
| Maryland: | 1.2% (11,265) |
Place of birth for U.S.-born residents:
- This state: 4,693
- Other state: 3,330
- Northeast: 954
- Midwest: 557
- South: 1,510
- West: 303
86.1% of Mayo residents lived in the same house 1 years ago.
Out of people who lived in different houses, 41.2% lived in this county.
Out of people who lived in different counties, 91.7% lived in Maryland.
| Mayo: | 86.1% |
| State average: | 88.5% |
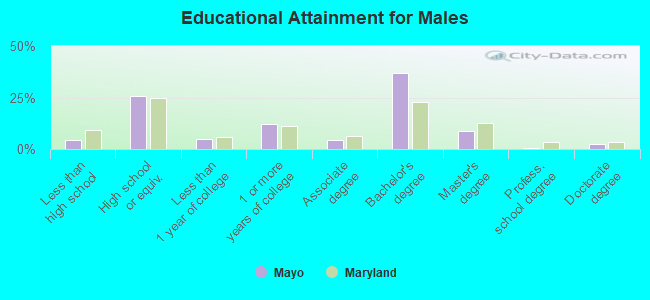
Education attainment for males 25 years and older:
- No schooling: 0
- Nursery to 4th grade: 0
- 5th and 6th grade: 10
- 7th and 8th grade: 10
- 9th grade: 14
- 10th grade: 15
- 11th grade: 0
- 12th grade, no diploma: 71
- High school graduate (or equivalency): 668
- Less than 1 year of college: 133
- Some college more than 1 year, no degree: 313
- Associate degree: 111
- Bachelor's degree: 966
- Master's degree: 230
- Professional school degree: 14
- Doctorate degree: 61
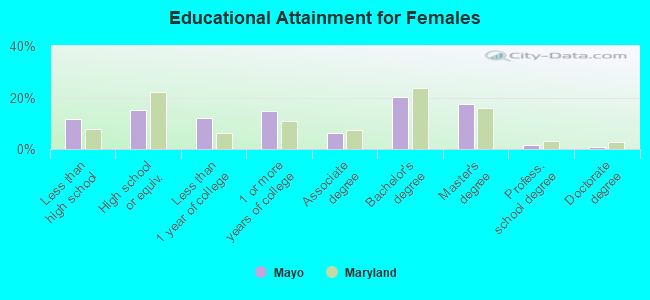
Education attainment for females 25 years and older:
- No schooling: 0
- Nursery to 4th grade: 0
- 5th and 6th grade: 4
- 7th and 8th grade: 0
- 9th grade: 93
- 10th grade: 76
- 11th grade: 60
- 12th grade, no diploma: 126
- High school graduate (or equivalency): 471
- Less than 1 year of college: 378
- Some college more than 1 year, no degree: 460
- Associate degree: 192
- Bachelor's degree: 631
- Master's degree: 539
- Professional school degree: 52
- Doctorate degree: 22
Housing units in structures:
- One, detached: 3,210
- One, attached: 17
- Two: 38
- 20 to 49: 30
- Mobile homes: 10
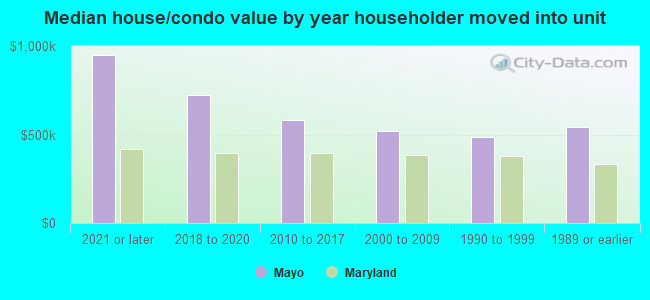
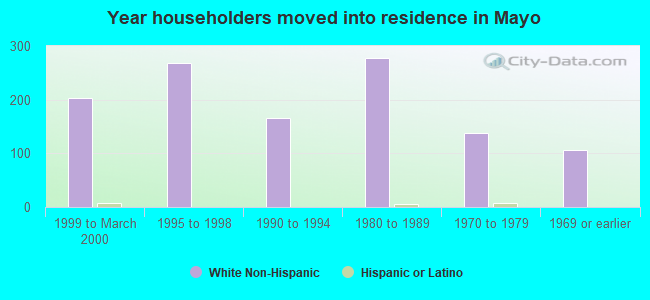
House/condo owner moved in on average 10 years ago
Renter moved in on average 5 years ago
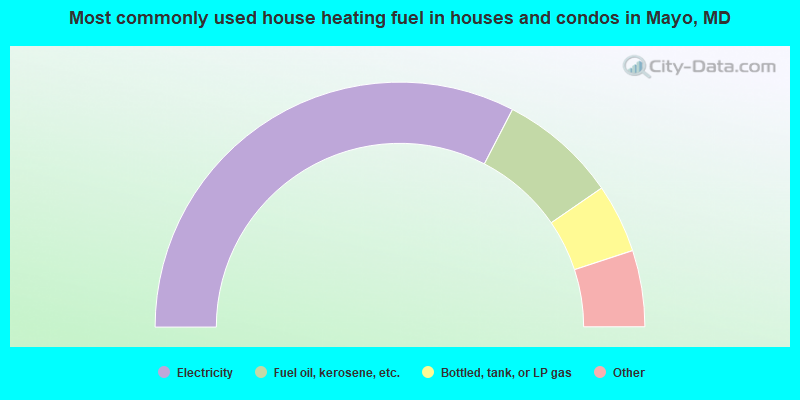
- 65.2%Electricity
- 15.6%Fuel oil, kerosene, etc.
- 9.1%Bottled, tank, or LP gas
- 3.6%Utility gas
- 3.1%Other fuel
- 1.9%Wood
- 0.9%No fuel used
- 0.5%Solar energy
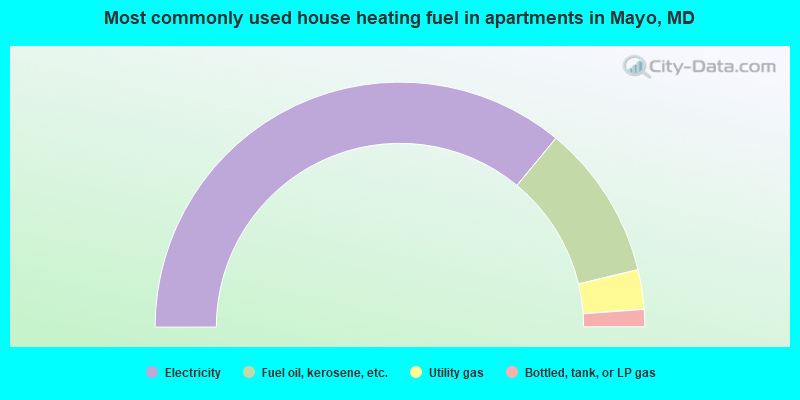
- 72.0%Electricity
- 20.5%Fuel oil, kerosene, etc.
- 5.2%Utility gas
- 2.3%Bottled, tank, or LP gas
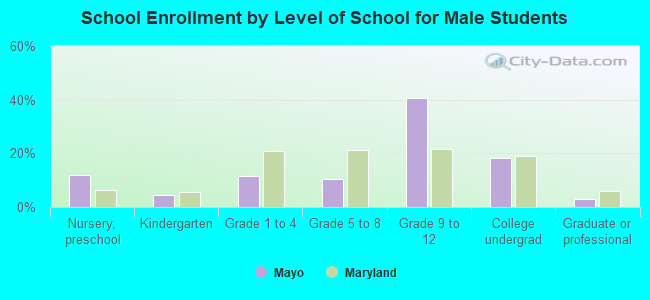
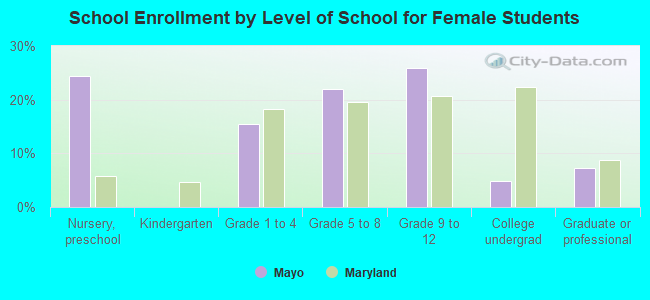
Private vs. public school enrollment:
| Here: | 17.8% |
| Maryland: | 15.2% |
| Here: | 18.5% |
| Maryland: | 14.4% |
| Here: | 13.8% |
| Maryland: | 20.2% |