Maywood, NJ (New Jersey) Houses and Residents
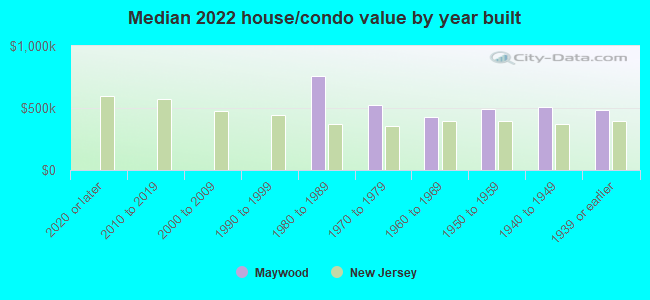
| Maywood: | $484,416 |
| New Jersey: | $428,900 |
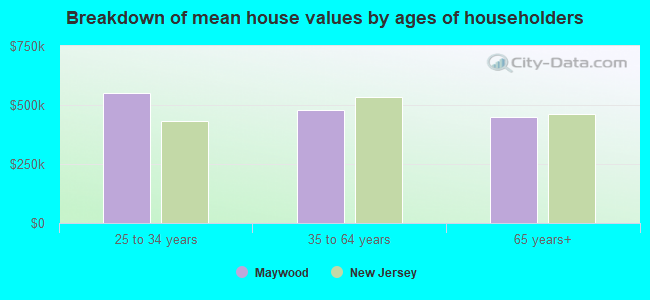
Mean price in 2022:
Detached houses: $504,242
Here: $504,242 State: $537,591 Townhouses or other attached units: $278,349
Here: $278,349 State: $381,113 In 2-unit structures: $624,300
Here: $624,300 State: $444,476
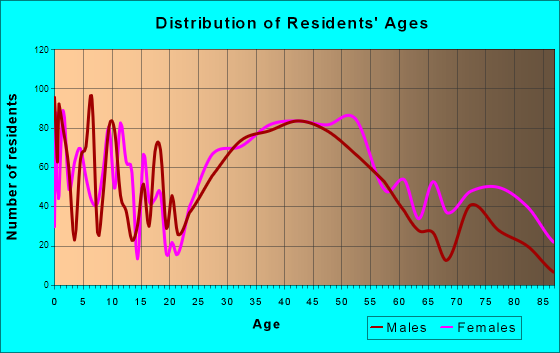
Total population: 9,746 (Urban population: 9,523, Rural population: 0)
Houses: 3,872 (3,725 occupied: 2,623 owner occupied, 1,121 renter occupied)
| % of renters here: | 30% |
| State: | 35% |
Housing density: 2,979 houses/condos per square mile
Median price asked for vacant for-sale houses and condos in 2022: $4,094,061.
Median contract rent in 2022: $1,821 (lower quartile is $1,476, upper quartile is over $2,000)
Median rent asked for vacant for-rent units in 2022: $2,161
Median gross rent in Maywood, NJ in 2022: $1,849
Housing units in Maywood with a mortgage: 1,599 (137 second mortgage, 0 home equity loan, 115 both second mortgage and home equity loan)
Houses without a mortgage: 89
Median household income for houses/condos with a mortgage: $152,544
Median household income for apartments without a mortgage: $102,137
Median monthly housing costs: $1,968
Compare current foreclosures near Maywood, NJ:
| Photo | Address | Area | Beds / Baths | Price | Details |
|---|---|---|---|---|---|

|
#1
Maywood Ave
Maywood, NJ 07607
|
- sq. feet
|
- baths - beds |
show details | |

|
#2
Prospect Ave
Maywood, NJ 07607
|
2,310 sq. feet
|
- baths - beds |
show details | |

|
#3
Hampton Ct
Maywood, NJ 07607
|
- sq. feet
|
- baths - beds |
show details | |

|
#4
E Passaic St
Maywood, NJ 07607
|
2,528 sq. feet
|
- baths - beds |
show details | |

|
#5
Stewart St
Maywood, NJ 07607
|
1,594 sq. feet
|
- baths - beds |
show details | |

|
#6
Berry Ct
Maywood, NJ 07607
|
1,568 sq. feet
|
- baths - beds |
show details | |

|
#7
E Passaic St
Maywood, NJ 07607
|
2,038 sq. feet
|
- baths - beds |
show details | |

|
#8
W Pleasant Ave
Maywood, NJ 07607
|
- sq. feet
|
- baths - beds |
show details | |

|
#9
Ackerman St
Maywood, NJ 07607
|
1,914 sq. feet
|
- baths - beds |
show details | |

|
#10
Zuber Pl
Maywood, NJ 07607
|
1,332 sq. feet
|
- baths - beds |
show details |
| Photo | Address | Area | Beds / Baths | Price | Details |
|---|---|---|---|---|---|

|
#11
E Spring Valley Ave
Maywood, NJ 07607
|
- sq. feet
|
- baths - beds |
show details | |

|
#12
Maywood Ave
Maywood, NJ 07607
|
- sq. feet
|
- baths - beds |
show details | |

|
#13
E Hunter Ave
Maywood, NJ 07607
|
1,752 sq. feet
|
- baths - beds |
show details | |

|
#14
Lenox Ave
Maywood, NJ 07607
|
- sq. feet
|
- baths - beds |
show details | |

|
#15
E Fairmount Ave
Maywood, NJ 07607
|
- sq. feet
|
- baths - beds |
show details | |

|
#16
Hampton Ct
Maywood, NJ 07607
|
- sq. feet
|
- baths - beds |
show details | |

|
#17
Washington Ave
Maywood, NJ 07607
|
1,020 sq. feet
|
- baths - beds |
show details | |

|
#18
Stone St
Maywood, NJ 07607
|
1,554 sq. feet
|
- baths - beds |
show details | |

|
#19
Stelling Ave
Maywood, NJ 07607
|
1,620 sq. feet
|
- baths - beds |
show details | |

|
#20
W Central Ave
Maywood, NJ 07607
|
- sq. feet
|
- baths - beds |
show details |
| Photo | Address | Area | Beds / Baths | Price | Details |
|---|---|---|---|---|---|

|
#21
S Elm St
Maywood, NJ 07607
|
1,040 sq. feet
|
- baths - beds |
show details | |

|
#22
Park Ave Apt 12
North Bergen, NJ 07047
|
835 sq. feet
|
1 baths 2 beds |
$379,900
|
show details |

|
#23
S Orange Ave
Newark, NJ 07103
|
989 sq. feet
|
1 baths 2 beds |
$289,900
|
show details |

|
#24
N Broadway
Irvington, NY 10533
|
850 sq. feet
|
1 baths 2 beds |
$315,000
|
show details |

|
#25
W Sidney Ave
Mount Vernon, NY 10550
|
2,800 sq. feet
|
3 baths 8 beds |
$454,900
|
show details |

|
#26
Swinton Ave
Bronx, NY 10465
|
1,938 sq. feet
|
2 baths 3 beds |
$789,900
|
show details |

|
#27
Grand Concourse Apt 3c
Bronx, NY 10452
|
700 sq. feet
|
1 baths 1 beds |
$184,500
|
show details |

|
#28
2nd Ave # 5c
New York, NY 10029
|
550 sq. feet
|
1 baths 1 beds |
$439,900
|
show details |

|
#29
N Main St Apt C-15
Spring Valley, NY 10977
|
800 sq. feet
|
1 baths 1 beds |
$85,000
|
show details |

|
#30
90th St Apt 5d
Jackson Heights, NY 11372
|
1,000 sq. feet
|
1 baths 2 beds |
$269,900
|
show details |
| Photo | Address | Area | Beds / Baths | Price | Details |
|---|---|---|---|---|---|

|
#31
Davenport Ave Apt 1b
New Rochelle, NY 10805
|
750 sq. feet
|
1 baths 1 beds |
$159,900
|
show details |

|
#32
Central Park Ave Apt 9m
Yonkers, NY 10710
|
1,300 sq. feet
|
2 baths 3 beds |
$319,900
|
show details |

|
#33
Oakdale Mnr Apt A6d
Suffern, NY 10901
|
750 sq. feet
|
1 baths 1 beds |
$99,900
|
show details |

|
#34
Horizon Rd Apt 803
Fort Lee, NJ 07024
|
843 sq. feet
|
1 baths 1 beds |
$178,900
|
show details |

|
#35
Ashland Ave
East Orange, NJ 07017
|
2,254 sq. feet
|
1 baths 5 beds |
$272,000
|
show details |

|
#36
Willow St
Bloomfield, NJ 07003
|
1,092 sq. feet
|
1 baths 3 beds |
$499,900
|
show details |

|
#37
Martin Dr
Harrington Park, NJ 07640
|
1,746 sq. feet
|
3 baths 3 beds |
$950,000
|
show details |

|
#38
Jersey Ave
Fairview, NJ 07022
|
1,073 sq. feet
|
1 baths 3 beds |
$414,900
|
show details |

|
#39
E 73rd St
New York, NY 10021
|
1,253 sq. feet
|
2 baths 2 beds |
$699,900
|
show details |

|
#40
Forest Ave
Paramus, NJ 07652
|
2,428 sq. feet
|
3 baths 5 beds |
$749,900
|
show details |
| Photo | Address | Area | Beds / Baths | Price | Details |
|---|---|---|---|---|---|

|
#41
N Broadway Apt A6
Yonkers, NY 10701
|
950 sq. feet
|
2 baths 2 beds |
$219,900
|
show details |

|
#42
7th St
Ridgefield Park, NJ 07660
|
1,382 sq. feet
|
1 baths 3 beds |
$539,900
|
show details |

|
#43
Olinville Ave Apt 11c
Bronx, NY 10467
|
1,000 sq. feet
|
2 baths 3 beds |
$385,000
|
show details |

|
#44
E 81st St Apt 4c
New York, NY 10028
|
696 sq. feet
|
1 baths 1 beds |
$745,000
|
show details |

|
#45
E 52nd St Apt 4f
New York, NY 10022
|
700 sq. feet
|
1 baths 1 beds |
$689,900
|
show details |

|
#46
Bloomfield Ave
Caldwell, NJ 07006
|
1,216 sq. feet
|
2 baths 2 beds |
$400,000
|
show details |

|
#47
E 221st St
Bronx, NY 10467
|
1,890 sq. feet
|
2 baths 3 beds |
$554,900
|
show details |

|
#48
17th Ave 1st Floor
Whitestone, NY 11357
|
610 sq. feet
|
1 baths 1 beds |
$229,900
|
show details |

|
#49
Fordham Hill Oval
Bronx, NY 10468
|
700 sq. feet
|
1 baths 1 beds |
$154,900
|
show details |

|
Check over 1 million property listings on Foreclosure.com!
|
browse all offers | |||

Latest news about housing in Maywood, NJ collected exclusively by city-data.com from local newspapers, TV, and radio stations

 | Why so many houses for sale in Maywood ??? (2 replies) |
| Looking to get into buying and then renting out real estate (13 replies) |
| Looking for pet friendly apartments in Bergen county (2 replies) |
| Bergen County Apartments (4 replies) |
| Police in Maywood (68 replies) |
| opinions on Colt's Neck (69 replies) |
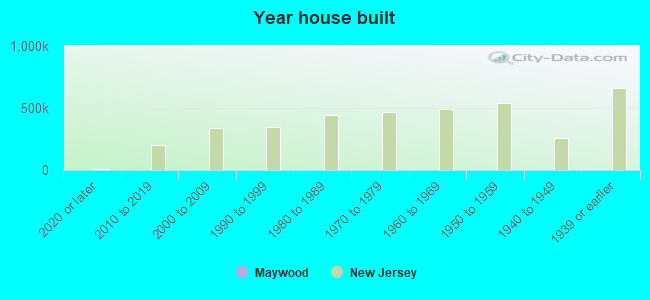
Median year apartment built: 1964
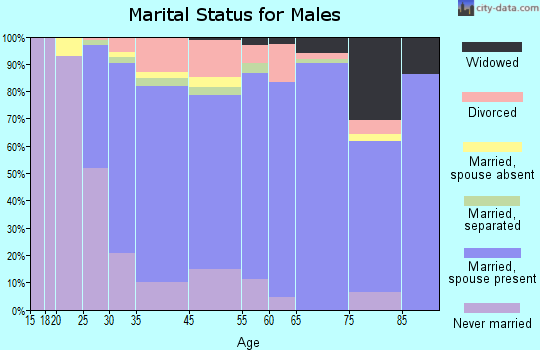
Household type by relationship:
Households: 10,037- Male householders: 1,900 (437 living alone), Female householders: 1,800 (403 living alone)
2,142 spouses (2,118 opposite-sex spouses), 256 unmarried partners, (235 opposite-sex unmarried partners), 2,990 children (2,945 natural, 10 adopted, 33 stepchildren), 171 grandchildren, 142 brothers or sisters, 274 parents, 0 foster children, 244 other relatives, 72 non-relatives
- In group quarters: 38
Size of family households: 1,005 2-persons, 700 3-persons, 551 4-persons, 229 5-persons, 154 6-persons, 17 7-or-more-persons.
Size of nonfamily households: 870 1-person, 216 2-persons, 8 3-persons.
1,379 married couples with children.
178 single-parent households (23 men, 155 women).
62.1% of residents of Maywood speak English at home.
18.2% of residents speak Spanish at home (70% speak English very well, 21% speak English well, 7% speak English not well, 2% don't speak English at all).
7.9% of residents speak other Indo-European language at home (68% speak English very well, 18% speak English well, 15% speak English not well).
10.2% of residents speak Asian or Pacific Island language at home (53% speak English very well, 16% speak English well, 23% speak English not well, 8% don't speak English at all).
1.9% of residents speak other language at home (53% speak English very well, 28% speak English well, 14% speak English not well, 5% don't speak English at all).
Foreign born population: 2,514 (25.0%)
(74.9% of them are naturalized citizens)
| Here: | 6.6 |
| State: | 6.8 |
| Here: | 4.2 |
| State: | 3.9 |
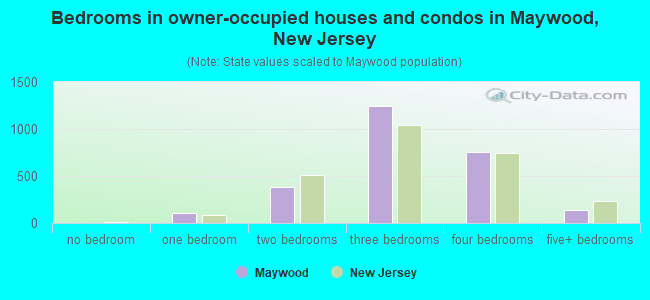
- Bedrooms in owner-occupied houses and condos in Maywood, New Jersey
- 0no bedroom
- 1041 bedroom
- 3792 bedrooms
- 1,2493 bedrooms
- 7584 bedrooms
- 1335+ bedrooms
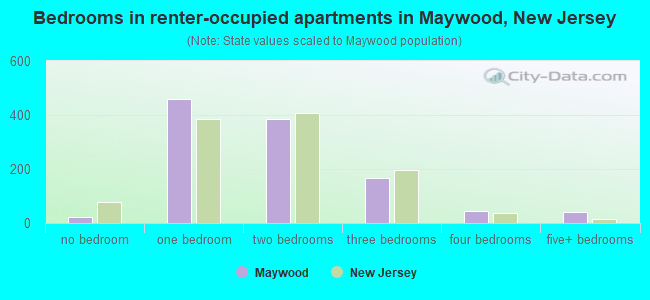
- Bedrooms in renter-occupied apartments in Maywood, New Jersey
- 22no bedroom
- 4591 bedroom
- 3872 bedrooms
- 1673 bedrooms
- 464 bedrooms
- 405+ bedrooms
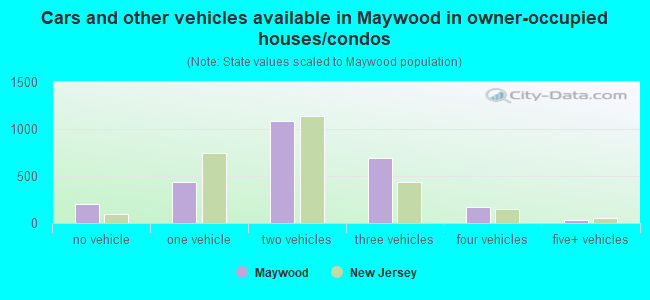
- Cars and other vehicles available in Maywood in owner-occupied houses/condos
- 206no vehicle
- 4401 vehicle
- 1,0812 vehicles
- 6923 vehicles
- 1674 vehicles
- 365+ vehicles
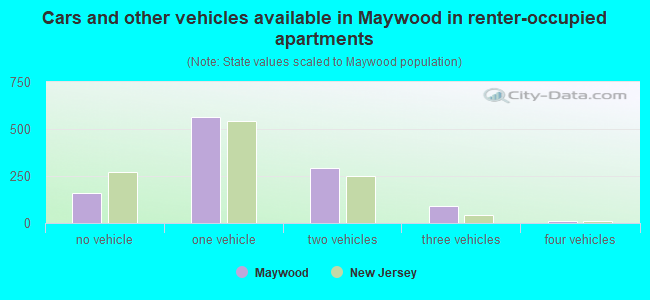
- Cars and other vehicles available in Maywood in renter-occupied apartments
- 161no vehicle
- 5661 vehicle
- 2942 vehicles
- 893 vehicles
- 124 vehicles
- 05+ vehicles
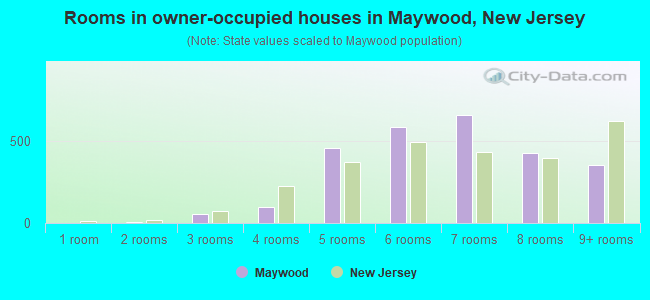
- Rooms in owner-occupied houses in Maywood, New Jersey
- 01 room
- 92 rooms
- 533 rooms
- 954 rooms
- 4525 rooms
- 5816 rooms
- 6567 rooms
- 4278 rooms
- 3519+ rooms
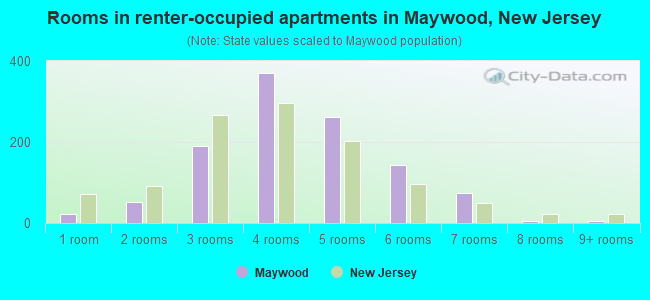
- Rooms in renter-occupied apartments in Maywood, New Jersey
- 221 room
- 512 rooms
- 1913 rooms
- 3704 rooms
- 2615 rooms
- 1436 rooms
- 737 rooms
- 58 rooms
- 69+ rooms
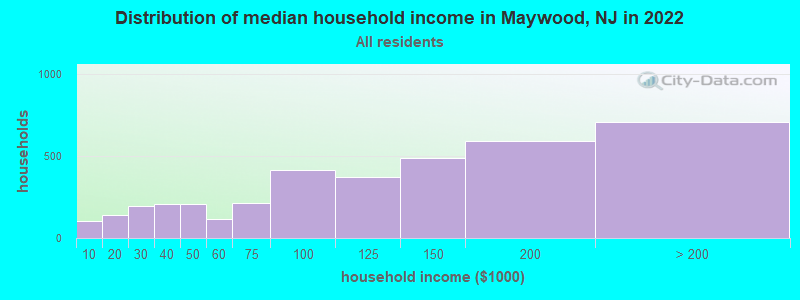
Maywood, NJ household income distribution

- 103Less than $10,000
- 140$10,000 to $19,999
- 194$20,000 to $29,999
- 209$30,000 to $39,999
- 206$40,000 to $49,999
- 115$50,000 to $59,999
- 213$60,000 to $74,999
- 414$75,000 to $99,999
- 373$100,000 to $124,999
- 490$125,000 to $149,999
- 591$150,000 to $199,999
- 708$200,000 or more
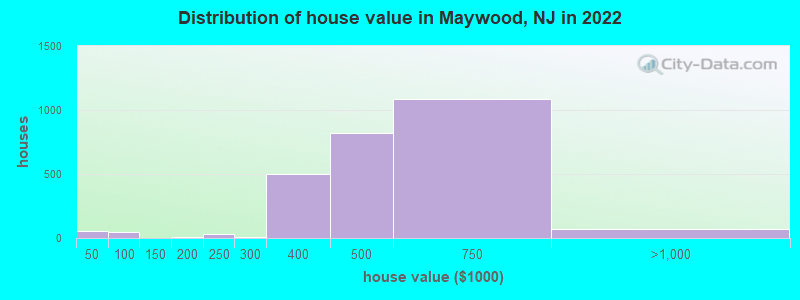
Home value of owner - occupied houses in 2022 in Maywood, NJ
-
- 13Less than $10,000
- 6$15,000 to $19,999
- 11$35,000 to $39,999
- 25$40,000 to $49,999
- 8$50,000 to $59,999
- 14$90,000 to $99,999
- 8$175,000 to $199,999
- 30$200,000 to $249,999
- 3$250,000 to $299,999
- 502$300,000 to $399,999
- 824$400,000 to $499,999
- 1,085$500,000 to $749,999
- 73$750,000 to $999,999
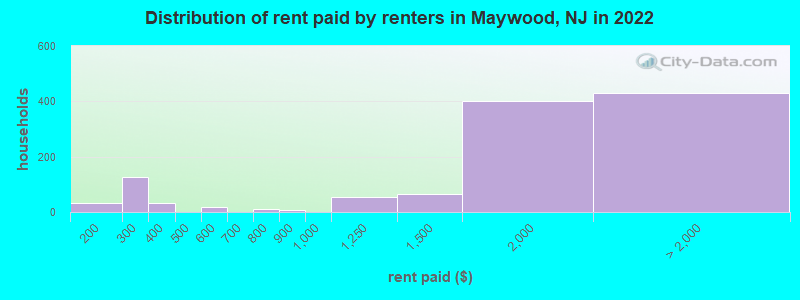
Rent paid by renters in 2022 in Maywood, NJ
-
- 33$150 to $199
- 115$200 to $249
- 10$250 to $299
- 19$300 to $349
- 12$350 to $399
- 19$500 to $549
- 9$700 to $749
- 6$800 to $899
- 54$1,000 to $1,249
- 64$1,250 to $1,499
- 401$1,500 to $1,999
- 349$2,000 to $2,499
- 59$2,500 to $2,999
- 7$3,500 or more
- 13No cash rent
Percentage of workers working in this county: 64.5%
Number of people working at home: 732 (14.4% of all workers)
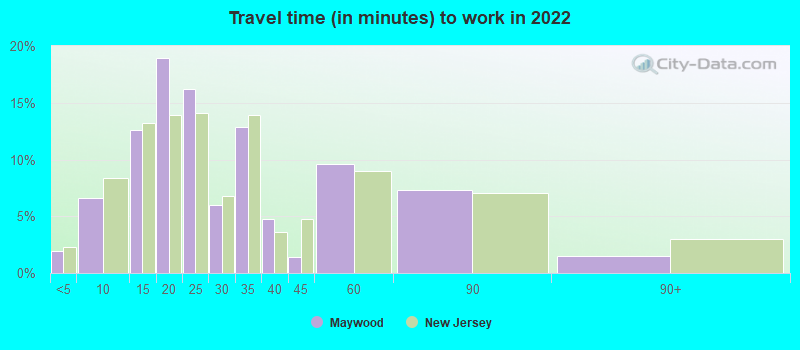
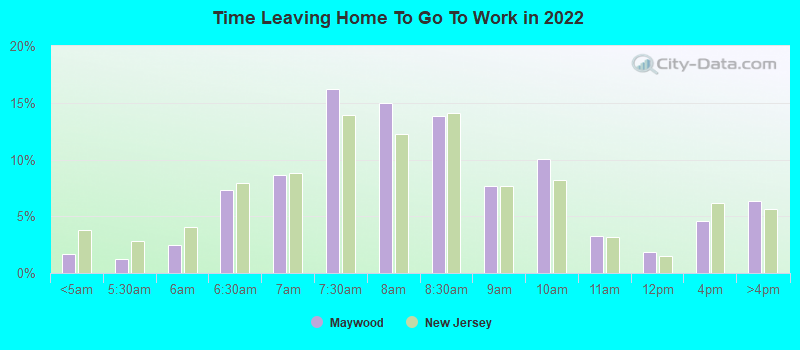
Travel time to work (commute)
- Less than 5 minutes: 78
- 5 to 9 minutes: 246
- 10 to 14 minutes: 947
- 15 to 19 minutes: 793
- 20 to 24 minutes: 451
- 25 to 29 minutes: 288
- 30 to 34 minutes: 343
- 35 to 39 minutes: 135
- 40 to 44 minutes: 170
- 45 to 59 minutes: 455
- 60 to 89 minutes: 317
- 90 or more minutes: 133
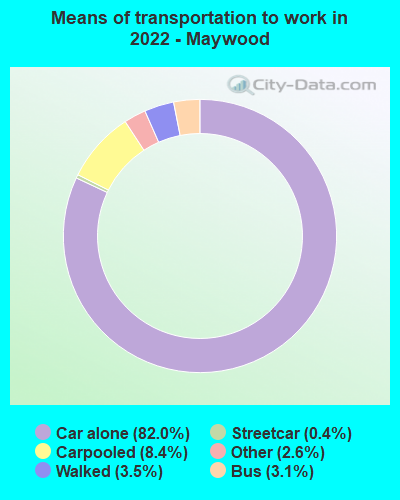
Means of transportation to work:
- Drove a car alone: 1,947 (62.4%)
- Carpooled: 241 (7.7%)
- Bus: 67 (2.1%)
- Subway or elevated rail: 9 (0.3%)
- Light rail, streetcar or trolley: 1 (0.0%)
- Taxi: 70 (2.2%)
- Walked: 88 (2.8%)
- Worked at home: 732 (23.5%)
- Unemployment by race in 2022
- Unemployment rate for White non-Hispanic residents
- 11.7%Males
- 2.6%Females
- Unemployment rate for Black residents
- 4.0%Males
- Unemployment rate for Asian residents
- 0.7%Males
- Unemployment rate for other race residents
- 2.6%Males
- Unemployment rate for two or more race residents
- 4.2%Males
- Unemployment rate for Hispanic or Latino residents
- 7.4%Males
- 5.9%Females
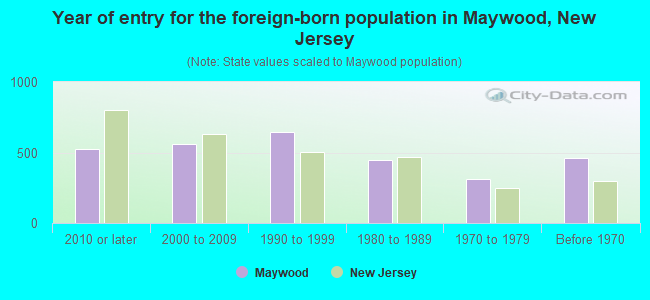
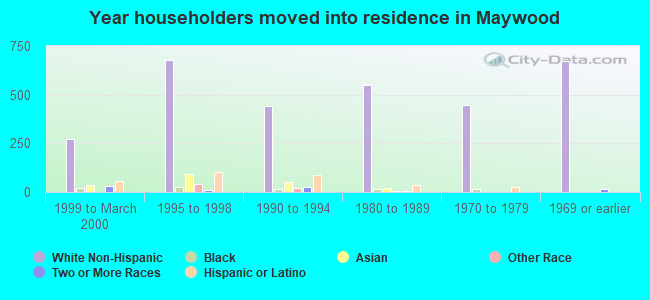
- Year of entry for the foreign-born population in Maywood, New Jersey
- 5262010 or later
- 5622000 to 2009
- 6431990 to 1999
- 4461980 to 1989
- 3141970 to 1979
- 459Before 1970
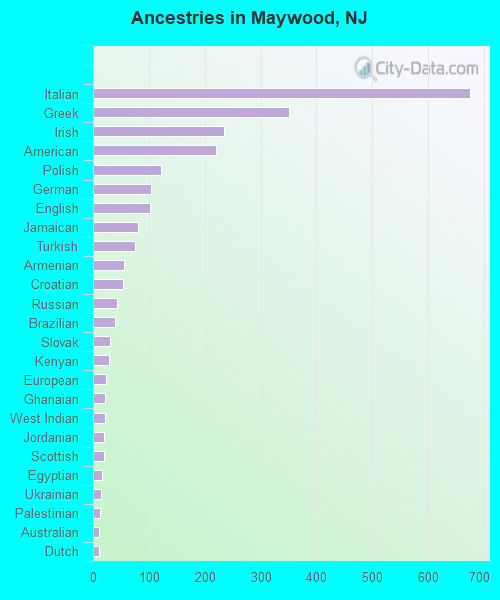
First ancestries reported:
- Italian: 675 (12.6%)
- Greek: 351 (6.5%)
- Irish: 234 (4.4%)
- American: 221 (4.1%)
- Polish: 122 (2.3%)
- German: 103 (1.9%)
- English: 102 (1.9%)
- Jamaican: 81 (1.5%)
- Turkish: 75 (1.4%)
- Armenian: 55 (1.0%)
- Croatian: 54 (1.0%)
- Russian: 43 (0.8%)
- Brazilian: 39 (0.7%)
- Slovak: 30 (0.6%)
- Kenyan: 28 (0.5%)
- European: 23 (0.4%)
- Ghanaian: 21 (0.4%)
- West Indian: 21 (0.4%)
- Jordanian: 20 (0.4%)
- Scottish: 20 (0.4%)
- Egyptian: 16 (0.3%)
- Ukrainian: 15 (0.3%)
- Palestinian: 12 (0.2%)
- Australian: 10 (0.2%)
- Dutch: 10 (0.2%)
- Romanian: 10 (0.2%)
- Syrian: 7 (0.1%)
- Lebanese: 5 (0.09%)
- Guyanese: 5 (0.09%)
- Scotch-Irish: 5 (0.09%)
Most common places of birth for foreign-born residents (%):
| Maywood: | 14.7% (369) |
| New Jersey: | 12.8% (274,609) |
| Maywood: | 12.2% (307) |
| New Jersey: | 4.0% (85,934) |
| Maywood: | 11.1% (280) |
| New Jersey: | 3.3% (70,512) |
| Maywood: | 6.6% (167) |
| New Jersey: | 9.7% (209,055) |
| Maywood: | 6.1% (154) |
| New Jersey: | 4.2% (90,817) |
| Maywood: | 5.6% (141) |
| New Jersey: | 4.4% (95,275) |
| Maywood: | 5.5% (139) |
| New Jersey: | 0.5% (10,042) |
| Maywood: | 4.1% (103) |
| New Jersey: | 3.7% (78,969) |
| Maywood: | 2.8% (70) |
| New Jersey: | 2.2% (47,365) |
| Maywood: | 2.7% (67) |
| New Jersey: | 0.8% (16,778) |
| Maywood: | 2.6% (66) |
| New Jersey: | 2.7% (58,563) |
| Maywood: | 1.8% (44) |
| New Jersey: | 2.3% (48,811) |
| Maywood: | 1.7% (43) |
| New Jersey: | 2.1% (45,435) |
Place of birth for U.S.-born residents:
- This state: 4,648
- Other state: 2,624
- Northeast: 1,869
- Midwest: 73
- South: 225
- West: 554
86.0% of Maywood residents lived in the same house 1 years ago.
Out of people who lived in different houses, 36.0% lived in this county.
Out of people who lived in different counties, 20.9% lived in New Jersey.
| Maywood: | 86.0% |
| State average: | 90.4% |
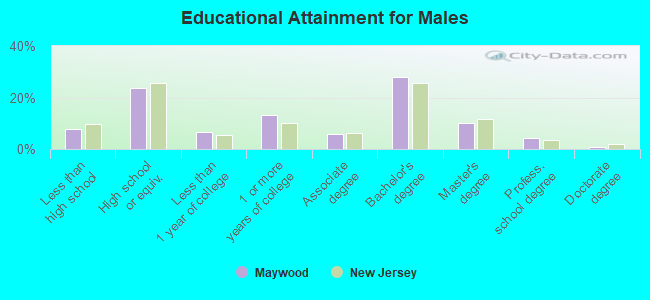
Education attainment for males 25 years and older:
- No schooling: 85
- Nursery to 4th grade: 9
- 5th and 6th grade: 13
- 7th and 8th grade: 36
- 9th grade: 7
- 10th grade: 0
- 11th grade: 43
- 12th grade, no diploma: 97
- High school graduate (or equivalency): 908
- Less than 1 year of college: 248
- Some college more than 1 year, no degree: 510
- Associate degree: 217
- Bachelor's degree: 1,066
- Master's degree: 389
- Professional school degree: 158
- Doctorate degree: 33
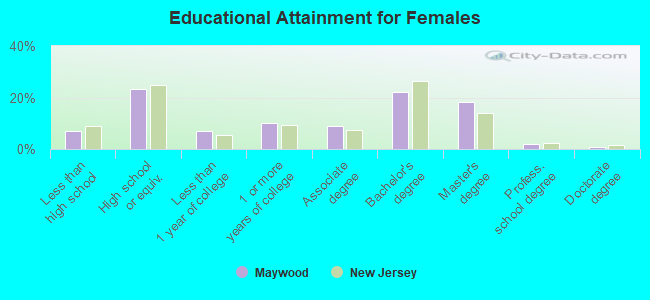
Education attainment for females 25 years and older:
- No schooling: 61
- Nursery to 4th grade: 9
- 5th and 6th grade: 8
- 7th and 8th grade: 38
- 9th grade: 9
- 10th grade: 8
- 11th grade: 20
- 12th grade, no diploma: 106
- High school graduate (or equivalency): 846
- Less than 1 year of college: 257
- Some college more than 1 year, no degree: 361
- Associate degree: 327
- Bachelor's degree: 798
- Master's degree: 657
- Professional school degree: 72
- Doctorate degree: 28
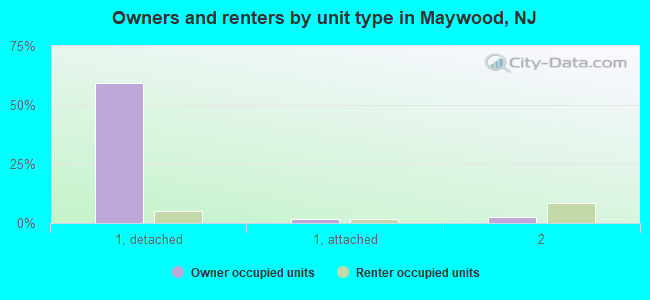
Housing units in structures:
- One, detached: 2,735
- One, attached: 93
- Two: 412
- 3 or 4: 410
- 10 to 19: 40
- 20 to 49: 24
- 50 or more: 155
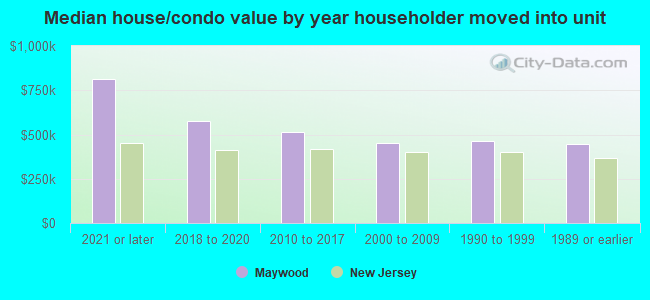
House/condo owner moved in on average 21 years ago
Renter moved in on average -1 years ago
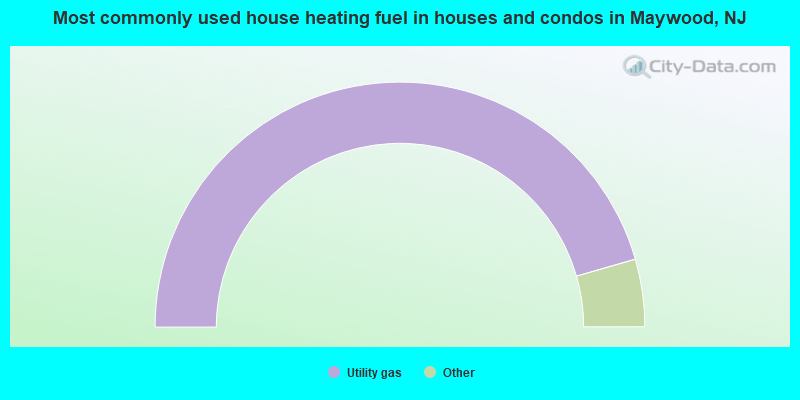
- 91.1%Utility gas
- 3.9%Fuel oil, kerosene, etc.
- 3.5%Electricity
- 1.5%Bottled, tank, or LP gas
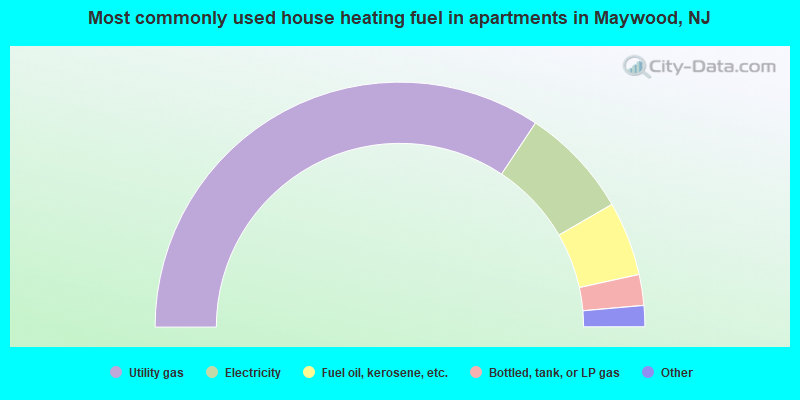
- 68.8%Utility gas
- 14.7%Electricity
- 9.8%Fuel oil, kerosene, etc.
- 4.1%Bottled, tank, or LP gas
- 2.2%Other fuel
- 0.5%No fuel used
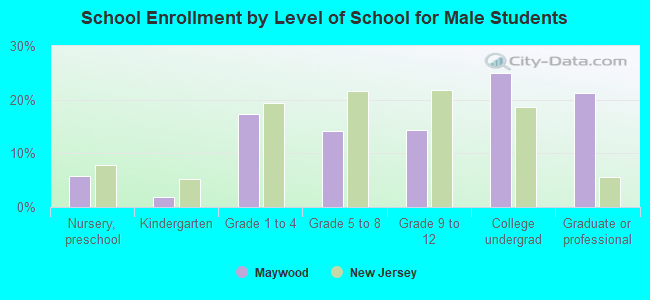
Private vs. public school enrollment:
| Here: | 4.7% |
| New Jersey: | 12.3% |
| Here: | 20.7% |
| New Jersey: | 13.1% |
| Here: | 44.7% |
| New Jersey: | 33.2% |