Mechanicsville, PA (Pennsylvania) Houses and Residents
Estimated median house or condo value in 2022: $277,770 (it was $102,800 in 2000 )
Mechanicsville:
$277,770Pennsylvania:
$245,500
Lower value quartile - upper value quartile: $188,918 - $446,696Total population: 3,009 (All urban)
Houses: 1,222 (1,159 occupied: 814 owner occupied, 345 renter occupied )
% of renters here:
30%State:
31%
Housing density: 598 houses/condos per square mile
Median price asked for vacant for-sale houses and condos in 2022 in this county: $510,355.
Median contract rent in 2022: $978 (lower quartile is $787, upper quartile is $1,209)
Median rent asked for vacant for-rent units in 2022: $975
Median gross rent in Mechanicsville, PA in 2022: $1,125
Housing units in Mechanicsville with a mortgage: 403 (40 second mortgage, 40 home equity loan, 14 both second mortgage and home equity loan )Houses without a mortgage: 370
Data:
Median house or condo value ($)
Median house or condo value ($ change since 2000)
Median house or condo value ($) - White
Median house or condo value ($) - Black or African American
Median house or condo value ($) - Asian
Median house or condo value ($) - Hispanic or Latino
Median house or condo value ($) - American Indian and Alaska Native
Median house or condo value ($) - Multirace
Median house or condo value ($) - Other Race
Median price asked for mobile homes ($)
Household density (households per square mile)
Mean house or condo value by units in structure - 1, detached ($)
Mean house or condo value by units in structure - 1, attached ($)
Mean house or condo value by units in structure - 2 ($)
Mean house or condo value by units in structure by units in structure - 3 or 4 ($)
Mean house or condo value by units in structure - 5 or more ($)
Mean house or condo value by units in structure - Boat, RV, van, etc. ($)
Mean house or condo value by units in structure - Mobile home ($)
Median contract rent ($)
Median contract rent - Lower quartile ($)
Median contract rent - Upper quartile ($)
Median gross rent ($)
Urban houses (%)
Rural houses (%)
Houses occupied (%)
Houses occupied (% change since 2000)
Houses owner occupied (%)
Houses owner occupied (% change since 2000)
Houses renter occupied (%)
Houses renter occupied (% change since 2000)
Vacant housing units - For rent (%)
Vacant housing units - For rent (% change since 2000)
Vacant housing units - For sale only (%)
Vacant housing units - For sale only (% change since 2000)
Vacant housing units - Rented or sold, not occupied (%)
Vacant housing units - Rented or sold, not occupied (% change since 2000)
Vacant housing units - For seasonal, recreational, or occasional use (%)
Vacant housing units - For seasonal, recreational, or occasional use (% change since 2000)
Vacant housing units - For migrant workers (%)
Vacant housing units - For migrant workers (% change since 2000)
Vacant housing units - Other vacant (%)
Vacant housing units - Other vacant (% change since 2000)
Median monthly housing costs ($)
Median household income for houses/condos with a mortgage ($)
Median household income for houses/condos without a mortgage ($)
Median household income ($)
Median household income ($) - White
Median household income ($) - Black or African American
Median household income ($) - Asian
Median household income ($) - Hispanic or Latino
Median household income ($) - American Indian and Alaska Native
Median household income ($) - Multirace
Median household income ($) - Other Race
Mortgage status - with mortgage (%)
Mortgage status - with second mortgage (%)
Mortgage status - with home equity loan (%)
Mortgage status - with both second mortgage and home equity loan (%)
Mortgage status - without a mortgage (%)
Median year house/condo built
Median year apartment built
Household type by relationship - Male householder living alone (%)
Household type by relationship - Male householder not living alone (%)
Household type by relationship - Female householder living alone (%)
Household type by relationship - Female householder not living alone (%)
Household type by relationship - Opposite-Sex spouse (%)
Household type by relationship - Same-Sex spouse (%)
Household type by relationship - Opposite-Sex unmarried partner (%)
Household type by relationship - Same-Sex unmarried partner (%)
Household type by relationship - In group quarters (%)
Size of family households - 2-person household (%)
Size of family households - 3-person household (%)
Size of family households - 4-person household (%)
Size of family households - 5-person household (%)
Size of family households - 6-person household (%)
Size of family households - 7-or-more-person household (%)
Size of nonfamily households - 1-person household (%)
Size of nonfamily households - 2-person household (%)
Size of nonfamily households - 3-person household (%)
Size of nonfamily households - 4-person household (%)
Size of nonfamily households - 5-person household (%)
Size of nonfamily households - 6-person household (%)
Size of nonfamily households - 7-or-moreperson household (%)
Year house built - Built 2010 or later (%)
Year house built - Built 2000 to 2009 (%)
Year house built - Built 1990 to 1999 (%)
Year house built - Built 1980 to 1989 (%)
Year house built - Built 1970 to 1979 (%)
Year house built - Built 1960 to 1969 (%)
Year house built - Built 1950 to 1959 (%)
Year house built - Built 1940 to 1949 (%)
Year house built - Built 1939 or earlier (%)
Median number of rooms in houses and condos
Median number of rooms in apartments
Median number of bedrooms in owner occupied houses
Mean number of bedrooms in owner occupied houses
Median number of bedrooms in renter occupied houses
Mean number of bedrooms in renter occupied houses
Median number of vehichles in owner occupied houses
Mean number of vehichles in owner occupied houses
Median number of vehichles in renter occupied houses
Mean number of vehichles in renter occupied houses
Rooms in owner-occupied houses - 1 room (%)
Rooms in owner-occupied houses - 2 rooms (%)
Rooms in owner-occupied houses - 3 rooms (%)
Rooms in owner-occupied houses - 4 rooms (%)
Rooms in owner-occupied houses - 5 rooms (%)
Rooms in owner-occupied houses - 6 rooms (%)
Rooms in owner-occupied houses - 7 rooms (%)
Rooms in owner-occupied houses - 8 rooms (%)
Rooms in owner-occupied houses - 9+ rooms (%)
Rooms in renter-occupied houses - 1 room (%)
Rooms in renter-occupied houses - 2 rooms (%)
Rooms in renter-occupied houses - 3 rooms (%)
Rooms in renter-occupied houses - 4 rooms (%)
Rooms in renter-occupied houses - 5 rooms (%)
Rooms in renter-occupied houses - 6 rooms (%)
Rooms in renter-occupied houses - 7 rooms (%)
Rooms in renter-occupied houses - 8 rooms (%)
Rooms in renter-occupied houses - 9+ rooms (%)
Bedrooms in owner-occupied houses - no bedrooms (%)
Bedrooms in owner-occupied houses - 1 bedroom (%)
Bedrooms in owner-occupied houses - 2 bedrooms (%)
Bedrooms in owner-occupied houses - 3 bedrooms (%)
Bedrooms in owner-occupied houses - 4 bedrooms (%)
Bedrooms in owner-occupied houses - 5+ bedrooms (%)
Bedrooms in renter-occupied houses - no bedrooms (%)
Bedrooms in renter-occupied houses - 1 bedroom (%)
Bedrooms in renter-occupied houses - 2 bedrooms (%)
Bedrooms in renter-occupied houses - 3 bedrooms (%)
Bedrooms in renter-occupied houses - 4 bedrooms (%)
Bedrooms in renter-occupied houses - 5+ bedrooms (%)
Vehicles available in owner-occupied houses - no vehicle available (%)
Vehicles available in owner-occupied houses - 1 vehicle available(%)
Vehicles available in owner-occupied houses - 2 Vehicles available (%)
Vehicles available in owner-occupied houses - 3 Vehicles available (%)
Vehicles available in owner-occupied houses - 4 Vehicles available (%)
Vehicles available in owner-occupied houses - 5+ Vehicles available (%)
Vehicles available in renter-occupied houses - no vehicle available (%)
Vehicles available in renter-occupied houses - 1 vehicle available (%)
Vehicles available in renter-occupied houses - 2 Vehicles available (%)
Vehicles available in renter-occupied houses - 3 Vehicles available (%)
Vehicles available in renter-occupied houses - 4 Vehicles available (%)
Vehicles available in renter-occupied houses - 5+ Vehicles available (%)
Housing units in structures - 1, detached (%)
Housing units in structures - 1, attached (%)
Housing units in structures - 2 (%)
Housing units in structures - 3 or 4 (%)
Housing units in structures - 5 to 9 (%)
Housing units in structures - 10 to 19 (%)
Housing units in structures - 20 to 49 (%)
Housing units in structures - 50 or more (%)
Housing units in structures - Mobile home (%)
Housing units in structures - Boat, RV, van, etc. (%)
Housing units in structures - Owners - 1, detached (%)
Housing units in structures - Owners - 1, attached (%)
Housing units in structures - Owners - 2 (%)
Housing units in structures - Owners - 3 or 4 (%)
Housing units in structures - Owners - 5 to 9 (%)
Housing units in structures - Owners - 10 to 19 (%)
Housing units in structures - Owners - 20 to 49 (%)
Housing units in structures - Owners - 50 or more (%)
Housing units in structures - Owners - Mobile home (%)
Housing units in structures - Owners - Boat, RV, van, etc. (%)
Housing units in structures - Renters - 1, detached (%)
Housing units in structures - Renters - 1, attached (%)
Housing units in structures - Renters - 2 (%)
Housing units in structures - Renters - 3 or 4 (%)
Housing units in structures - Renters - 5 to 9 (%)
Housing units in structures - Renters - 10 to 19 (%)
Housing units in structures - Renters - 20 to 49 (%)
Housing units in structures - Renters - 50 or more (%)
Housing units in structures - Renters - Mobile home (%)
Housing units in structures - Renters - Boat, RV, van, etc. (%)
House/condo owner moved in on average (years ago)
Renter moved in on average (years ago)
Year householder moved into unit - Moved in 1999 to March 2000 (%)
Year householder moved into unit - Moved in 1999 to March 2000 (%) - White
Year householder moved into unit - Moved in 1999 to March 2000 (%) - Black or African American
Year householder moved into unit - Moved in 1999 to March 2000 (%) - Asian
Year householder moved into unit - Moved in 1999 to March 2000 (%) - Hispanic or Latino
Year householder moved into unit - Moved in 1999 to March 2000 (%) - American Indian and Alaska Native
Year householder moved into unit - Moved in 1999 to March 2000 (%) - Multirace
Year householder moved into unit - Moved in 1999 to March 2000 (%) - Other Race
Year householder moved into unit - Moved in 1995 to 1998 (%)
Year householder moved into unit - Moved in 1995 to 1998 (%) - White
Year householder moved into unit - Moved in 1995 to 1998 (%) - Black or African American
Year householder moved into unit - Moved in 1995 to 1998 (%) - Asian
Year householder moved into unit - Moved in 1995 to 1998 (%) - Hispanic or Latino
Year householder moved into unit - Moved in 1995 to 1998 (%) - American Indian and Alaska Native
Year householder moved into unit - Moved in 1995 to 1998 (%) - Multirace
Year householder moved into unit - Moved in 1995 to 1998 (%) - Other Race
Year householder moved into unit - Moved in 1990 to 1994 (%)
Year householder moved into unit - Moved in 1990 to 1994 (%) - White
Year householder moved into unit - Moved in 1990 to 1994 (%) - Black or African American
Year householder moved into unit - Moved in 1990 to 1994 (%) - Asian
Year householder moved into unit - Moved in 1990 to 1994 (%) - Hispanic or Latino
Year householder moved into unit - Moved in 1990 to 1994 (%) - American Indian and Alaska Native
Year householder moved into unit - Moved in 1990 to 1994 (%) - Multirace
Year householder moved into unit - Moved in 1990 to 1994 (%) - Other Race
Year householder moved into unit - Moved in 1980 to 1989 (%)
Year householder moved into unit - Moved in 1980 to 1989 (%) - White
Year householder moved into unit - Moved in 1980 to 1989 (%) - Black or African American
Year householder moved into unit - Moved in 1980 to 1989 (%) - Asian
Year householder moved into unit - Moved in 1980 to 1989 (%) - Hispanic or Latino
Year householder moved into unit - Moved in 1980 to 1989 (%) - American Indian and Alaska Native
Year householder moved into unit - Moved in 1980 to 1989 (%) - Multirace
Year householder moved into unit - Moved in 1980 to 1989 (%) - Other Race
Year householder moved into unit - Moved in 1970 to 1979 (%)
Year householder moved into unit - Moved in 1970 to 1979 (%) - White
Year householder moved into unit - Moved in 1970 to 1979 (%) - Black or African American
Year householder moved into unit - Moved in 1970 to 1979 (%) - Asian
Year householder moved into unit - Moved in 1970 to 1979 (%) - Hispanic or Latino
Year householder moved into unit - Moved in 1970 to 1979 (%) - American Indian and Alaska Native
Year householder moved into unit - Moved in 1970 to 1979 (%) - Multirace
Year householder moved into unit - Moved in 1970 to 1979 (%) - Other Race
Year householder moved into unit - Moved in 1969 or earlier (%)
Year householder moved into unit - Moved in 1969 or earlier (%) - White
Year householder moved into unit - Moved in 1969 or earlier (%) - Black or African American
Year householder moved into unit - Moved in 1969 or earlier (%) - Asian
Year householder moved into unit - Moved in 1969 or earlier (%) - Hispanic or Latino
Year householder moved into unit - Moved in 1969 or earlier (%) - American Indian and Alaska Native
Year householder moved into unit - Moved in 1969 or earlier (%) - Multirace
Year householder moved into unit - Moved in 1969 or earlier (%) - Other Race
Housing units lacking complete plumbing facilities (%)
Housing units lacking complete kitchen facilities (%)
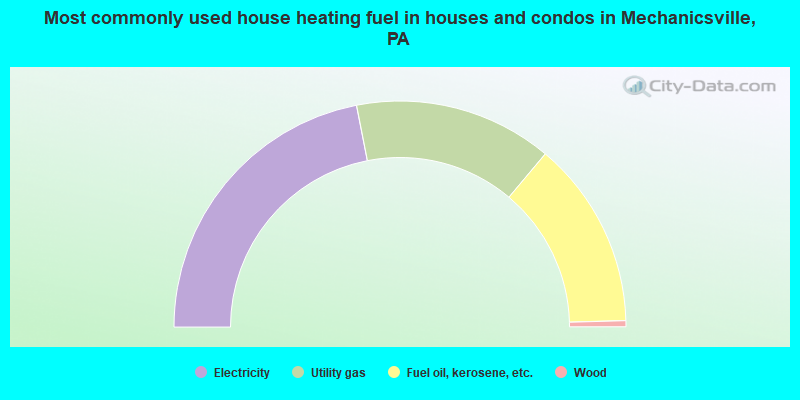
House heating fuel used in houses and condos - Utility gas (%)
House heating fuel used in houses and condos - Bottled, tank, or LP gas (%)
House heating fuel used in houses and condos - Electricity (%)
House heating fuel used in houses and condos - Fuel oil, kerosene, etc. (%)
House heating fuel used in houses and condos - Coal or coke (%)
House heating fuel used in houses and condos - Wood (%)
House heating fuel used in houses and condos - Solar energy (%)
House heating fuel used in houses and condos - Other fuel (%)
House heating fuel used in houses and condos - No fuel used (%)
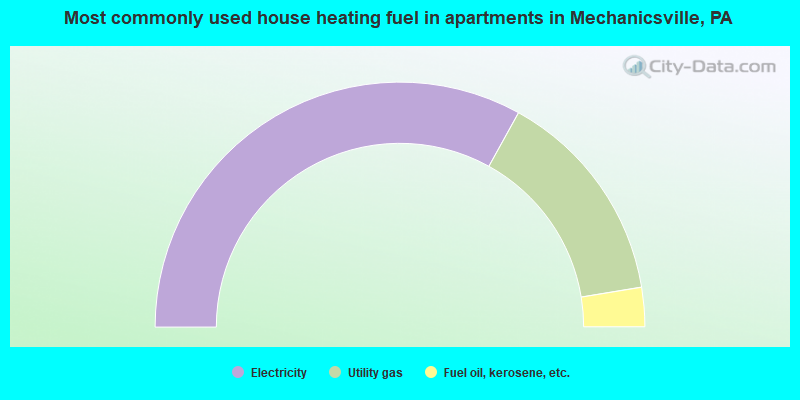
House heating fuel used in apartments - Utility gas (%)
House heating fuel used in apartments - Bottled, tank, or LP gas (%)
House heating fuel used in apartments - Electricity (%)
House heating fuel used in apartments - Fuel oil, kerosene, etc. (%)
House heating fuel used in apartments - Coal or coke (%)
House heating fuel used in apartments - Wood (%)
House heating fuel used in apartments - Solar energy (%)
House heating fuel used in apartments - Other fuel (%)
House heating fuel used in apartments - No fuel used (%)
Latest news about housing in Mechanicsville, PA collected exclusively by city-data.com from local newspapers, TV, and radio stations
Household type by relationship:
Households: 17,424
In family households: 14,335 (3,650 male householders , 1,151 female householders )
3,864 spouses , 4,690 children (4,313 natural , 150 adopted , 227 stepchildren ), 267 grandchildren , 66 brothers or sisters , 121 parents , foster children , 105 other relatives , 338 non-relatives In nonfamily households: 3,089 (1,128 male householders (884 living alone )), 1,464 female householders (1,293 living alone )), 497 nonrelatives In group quarters: 843 (675 institutionalized population)
3,282 married couples with children. single-parent households (168 men , 617 women ).
88.0% of residents of Mechanicsville speak English at home. of residents speak Spanish at home (80% speak English very well , 20% speak English not well ).of residents speak other Indo-European language at home (83% speak English very well , 14% speak English well , 3% speak English not well ).of residents speak Asian or Pacific Island language at home (52% speak English very well , 48% speak English well ).of residents speak other language at home (42% speak English very well , 58% speak English well ).
Foreign born population: 329 (9.8%)of them are naturalized citizens )
Median number of rooms in houses and condos:
Median number of rooms in apartments
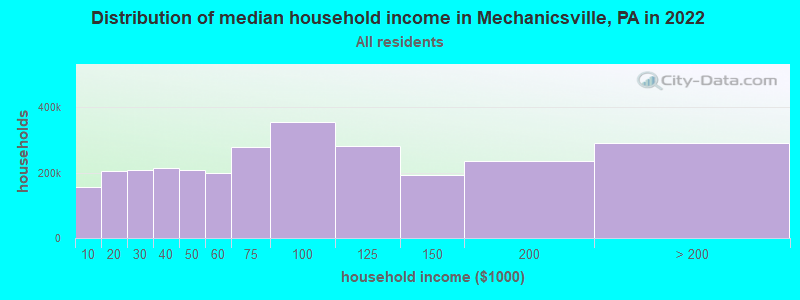
Mechanicsville, PA household income distribution 254,931 Less than $10,000318,452 $10,000 to $19,999314,938 $20,000 to $29,999322,857 $30,000 to $39,999302,836 $40,000 to $49,999298,022 $50,000 to $59,999413,271 $60,000 to $74,999516,525 $75,000 to $99,999408,971 $100,000 to $124,999287,891 $125,000 to $149,999353,485 $150,000 to $199,999455,995 $200,000 or more
Percentage of workers working in this county: 72.9%Number of people working at home: 211 (16.2% of all workers )
Travel time to work (commute)
Less than 5 minutes: 1435 to 9 minutes: 38510 to 14 minutes: 22715 to 19 minutes: 8520 to 24 minutes: 8625 to 29 minutes: 5430 to 34 minutes: 3435 to 39 minutes: 940 to 44 minutes: 2145 to 59 minutes: 3360 to 89 minutes: 090 or more minutes: 41
Means of transportation to work:
Drove a car alone: 943 (82.9%)Carpooled: 128 (11.2%)Bus or trolley bus : 7 (0.6%)Walked: 34 (3.0%)Other means: 6 (0.5%)Worked at home: 20 (1.8%)
Year of entry for the foreign-born population in Mechanicsville, Pennsylvania
38 1995 to March 2000 15 1990 to 1994 19 1985 to 1989 26 1980 to 1984 12 1975 to 1979 6 1970 to 1974 12 1965 to 1969 43 Before 1965
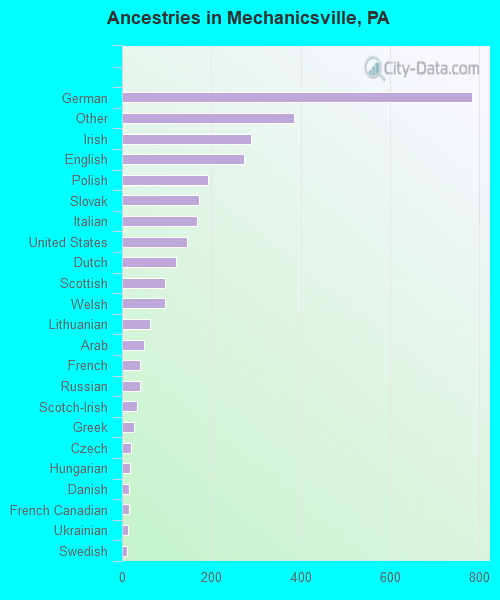
First ancestries reported:
German: 783 (25.5%)
Other: 385 (12.5%)
Irish: 288 (9.4%)
English: 274 (8.9%)
Polish: 192 (6.2%)
Slovak: 172 (5.6%)
Italian: 169 (5.5%)
United States: 146 (4.7%)
Dutch: 121 (3.9%)
Scottish: 97 (3.2%)
Welsh: 96 (3.1%)
Lithuanian: 62 (2.0%)
Arab: 49 (1.6%)
French: 41 (1.3%)
Russian: 40 (1.3%)
Scotch-Irish: 34 (1.1%)
Greek: 28 (0.9%)
Czech: 20 (0.7%)
Hungarian: 18 (0.6%)
Danish: 15 (0.5%)
French Canadian: 15 (0.5%)
Ukrainian: 14 (0.5%)
Swedish: 11 (0.4%)
Swiss: 4 (0.1%) Most common places of birth for foreign-born residents (%): India Mechanicsville:
14.0% (24)Pennsylvania:
7.4% (37,541)
Mexico Mechanicsville:
9.9% (17)Pennsylvania:
4.8% (24,232)
Czechoslovakia (includes Czech Republic and Slovakia) Mechanicsville:
8.8% (15)Pennsylvania:
0.7% (3,451)
Egypt Mechanicsville:
8.8% (15)Pennsylvania:
0.7% (3,475)
Panama Mechanicsville:
8.8% (15)Pennsylvania:
0.3% (1,617)
Iran Mechanicsville:
7.6% (13)Pennsylvania:
0.6% (3,034)
Vietnam Mechanicsville:
7.6% (13)Pennsylvania:
5.2% (26,656)
China, excluding Hong Kong and Taiwan Mechanicsville:
7.0% (12)Pennsylvania:
4.6% (23,478)
Germany Mechanicsville:
4.7% (8)Pennsylvania:
5.1% (25,685)
Turkey Mechanicsville:
4.1% (7)Pennsylvania:
0.4% (2,237)
Canada Mechanicsville:
4.1% (7)Pennsylvania:
3.0% (15,200)
Romania Mechanicsville:
3.5% (6)Pennsylvania:
0.8% (4,274)
Brazil Mechanicsville:
3.5% (6)Pennsylvania:
0.6% (3,264)
Ireland Mechanicsville:
2.9% (5)Pennsylvania:
1.3% (6,687)
Asia, n.e.c. Mechanicsville:
2.9% (5)Pennsylvania:
0.1% (695)
Austria Mechanicsville:
1.8% (3)Pennsylvania:
0.5% (2,714)
Place of birth for U.S.-born residents:
This state: 2,431Other state: 565Northeast: 265Midwest: 77South: 181West: 42 63% of Mechanicsville residents lived in the same house 5 years ago.
Out of people who lived in different houses, 45% lived in this county.
Out of people who lived in different counties, 55% lived in Pennsylvania.
Education attainment for males 25 years and older:
No schooling: 0Nursery to 4th grade: 05th and 6th grade: 117th and 8th grade: 259th grade: 2610th grade: 2611th grade: 1312th grade, no diploma: 15High school graduate (or equivalency): 278Less than 1 year of college: 29Some college more than 1 year, no degree: 75Associate degree: 68Bachelor's degree: 122Master's degree: 57Professional school degree: 112Doctorate degree: 20
Education attainment for females 25 years and older:
No schooling: 14Nursery to 4th grade: 05th and 6th grade: 47th and 8th grade: 789th grade: 2310th grade: 8811th grade: 1612th grade, no diploma: 21High school graduate (or equivalency): 471Less than 1 year of college: 51Some college more than 1 year, no degree: 71Associate degree: 67Bachelor's degree: 310Master's degree: 199Professional school degree: 55Doctorate degree: 4
Housing units in structures:
One, detached: 849One, attached: 90Two: 373 or 4: 755 to 9: 13210 to 19: 650 or more: 33Housing units lacking complete kitchen facilities: 2.7%Private vs. public school enrollment:
Students in private schools in grades 1 to 8 (elementary and middle school): 30 Here:
10.4%Pennsylvania:
16.0%
Students in private schools in grades 9 to 12 (high school): 14 Here:
6.1%Pennsylvania:
13.1%
Students in private undergraduate colleges: 0 Here:
0.0%Pennsylvania:
37.3%