Medfield, MA (Massachusetts) Houses and Residents
| Medfield: | $789,262 |
| Massachusetts: | $534,700 |
Total population: 6,483 (All urban)
Houses: 2,567 (2,490 occupied: 2,064 owner occupied, 413 renter occupied)
| % of renters here: | 17% |
| State: | 38% |
Housing density: 510 houses/condos per square mile
Median price asked for vacant for-sale houses and condos in 2022 in this county: $751,928.
Median contract rent in 2022: $1,282 (lower quartile is $441, upper quartile is $1,816)
Median rent asked for vacant for-rent units in 2022: $2,416
Median gross rent in Medfield, MA in 2022: $1,340
Housing units in Medfield with a mortgage: 1,396 (217 second mortgage, 0 home equity loan, 205 both second mortgage and home equity loan)
Houses without a mortgage: 65
Median household income for houses/condos with a mortgage: $246,532
Median household income for apartments without a mortgage: $100,463
Median monthly housing costs: $2,512
Compare current foreclosures near Medfield, MA:
| Photo | Address | Area | Beds / Baths | Price | Details |
|---|---|---|---|---|---|

|
#1
South St
Medfield, MA 02052
|
968 sq. feet
|
1 baths 3 beds |
show details | |

|
#2
Cedar Ln
Medfield, MA 02052
|
1,586 sq. feet
|
2 baths 3 beds |
show details | |

|
#3
Granite St
Medfield, MA 02052
|
2,000 sq. feet
|
2 baths 4 beds |
show details | |

|
#4
North St
Medfield, MA 02052
|
- sq. feet
|
- baths - beds |
show details | |

|
#5
Adams St
Hyde Park, MA 02136
|
1,988 sq. feet
|
2 baths 4 beds |
$499,200
|
show details |

|
#6
Boyd St
Boston, MA 02124
|
3,970 sq. feet
|
3 baths 9 beds |
$650,000
|
show details |

|
#7
Cook Rd
Cumberland, RI 02864
|
2,050 sq. feet
|
2 baths 4 beds |
$724,900
|
show details |

|
#8
Stillman St
Framingham, MA 01702
|
1,122 sq. feet
|
1 baths 2 beds |
$418,000
|
show details |

|
#9
Bittersweet Ln
Randolph, MA 02368
|
882 sq. feet
|
1 baths 2 beds |
show details | |

|
#10
Church St
Boston, MA 02122
|
3,663 sq. feet
|
3 baths 6 beds |
show details |
| Photo | Address | Area | Beds / Baths | Price | Details |
|---|---|---|---|---|---|

|
#11
Kendrick Ave Apt 307
Quincy, MA 02169
|
1,234 sq. feet
|
2 baths 2 beds |
show details | |

|
#12
Broadway
North Attleboro, MA 02760
|
2,602 sq. feet
|
3 baths 5 beds |
show details | |

|
#13
Goodnow Ln
Framingham, MA 01702
|
2,342 sq. feet
|
2 baths 4 beds |
show details | |

|
#14
Cedar St
Ashland, MA 01721
|
2,756 sq. feet
|
3 baths 4 beds |
show details | |

|
#15
Melville Ct
Brockton, MA 02301
|
1,140 sq. feet
|
2 baths 3 beds |
show details | |

|
#16
Marcy Rd
Mattapan, MA 02126
|
1,168 sq. feet
|
1 baths 3 beds |
show details | |

|
#17
Ridgehill Rd
Canton, MA 02021
|
1,196 sq. feet
|
1 baths 3 beds |
show details | |

|
#18
Richmond St
Boston, MA 02124
|
2,516 sq. feet
|
2 baths 4 beds |
show details | |

|
#19
Berkshire Ave
Sharon, MA 02067
|
1,289 sq. feet
|
2 baths 3 beds |
show details | |

|
#20
Everett Cir
Hopkinton, MA 01748
|
5,180 sq. feet
|
3 baths 4 beds |
show details |
| Photo | Address | Area | Beds / Baths | Price | Details |
|---|---|---|---|---|---|

|
#21
Pond St
Franklin, MA 02038
|
1,100 sq. feet
|
1 baths 3 beds |
show details | |

|
#22
Grv St
Needham, MA 02492
|
6,542 sq. feet
|
4 baths 6 beds |
show details | |

|
#23
Pridemark Ln
Attleboro, MA 02703
|
1,340 sq. feet
|
1 baths 2 beds |
show details | |

|
#24
Magoun Ave
Brockton, MA 02301
|
868 sq. feet
|
1 baths 3 beds |
show details | |

|
#25
Tamarack Ln
Abington, MA 02351
|
1,495 sq. feet
|
2 baths 2 beds |
show details | |

|
#26
Webster St
Randolph, MA 02368
|
1,080 sq. feet
|
1 baths 3 beds |
show details | |

|
#27
Neponset St
Canton, MA 02021
|
1,053 sq. feet
|
1 baths 2 beds |
show details | |

|
#28
Riverside Rd
Franklin, MA 02038
|
3,093 sq. feet
|
2 baths 4 beds |
show details | |

|
#29
Tremont St
Brockton, MA 02301
|
1,470 sq. feet
|
2 baths 4 beds |
show details | |

|
#30
Brahms St
Roslindale, MA 02131
|
1,604 sq. feet
|
1 baths 4 beds |
show details |
| Photo | Address | Area | Beds / Baths | Price | Details |
|---|---|---|---|---|---|

|
#31
Gilbert Rd
Needham, MA 02492
|
1,778 sq. feet
|
2 baths 3 beds |
show details | |

|
#32
Emily Jeffers Rd # L
Randolph, MA 02368
|
1,350 sq. feet
|
1 baths 3 beds |
show details | |

|
#33
S Franklin St
Holbrook, MA 02343
|
940 sq. feet
|
2 baths 2 beds |
show details | |

|
#34
Congress Pl
Dedham, MA 02026
|
1,966 sq. feet
|
2 baths 4 beds |
show details | |

|
#35
Ballou St
Quincy, MA 02169
|
1,758 sq. feet
|
1 baths 3 beds |
show details | |

|
#36
Thomas St
Jamaica Plain, MA 02130
|
1,990 sq. feet
|
2 baths 2 beds |
show details | |

|
#37
Ellington St
Boston, MA 02121
|
3,732 sq. feet
|
5 baths 6 beds |
show details | |

|
#38
Lakeshore Dr
Bellingham, MA 02019
|
2,044 sq. feet
|
2 baths 3 beds |
show details | |

|
#39
Brook St
Brockton, MA 02301
|
994 sq. feet
|
1 baths 3 beds |
show details | |

|
#40
Atherton St
Boston, MA 02119
|
3,238 sq. feet
|
2 baths 6 beds |
show details |
| Photo | Address | Area | Beds / Baths | Price | Details |
|---|---|---|---|---|---|

|
#41
Dorchester Ave Apt 13
Boston, MA 02124
|
720 sq. feet
|
1 baths 2 beds |
show details | |

|
#42
Glover Ct
Boston, MA 02127
|
1,067 sq. feet
|
1 baths 2 beds |
show details | |

|
#43
Ellington St
Boston, MA 02121
|
3,732 sq. feet
|
5 baths 6 beds |
show details | |

|
#44
Rangley Ave
Brockton, MA 02301
|
1,632 sq. feet
|
1 baths 3 beds |
show details | |

|
#45
White Pl
Brookline, MA 02445
|
1,081 sq. feet
|
1 baths 3 beds |
show details | |

|
#46
Providence St
Mendon, MA 01756
|
987 sq. feet
|
1 baths 2 beds |
show details | |

|
#47
S Main St
Randolph, MA 02368
|
1,804 sq. feet
|
1 baths 4 beds |
show details | |

|
#48
Centre St
Waltham, MA 02453
|
2,168 sq. feet
|
1 baths 4 beds |
show details | |

|
#49
Selwyn Rd
Randolph, MA 02368
|
1,728 sq. feet
|
2 baths 3 beds |
show details | |

|
Check over 1 million property listings on Foreclosure.com!
|
browse all offers | |||

Latest news about housing in Medfield, MA collected exclusively by city-data.com from local newspapers, TV, and radio stations

 | How Much Massachusetts Households Make Per Year: Census Data (37 replies) |
| 2023 Real Estate Observations (5278 replies) |
| 2021 Real Estate Observations (1729 replies) |
| Rents rapidly climbing (62 replies) |
| towns that offer the most jobs per dollar of house (58 replies) |
| Moving to Medfield (2 replies) |

Median year apartment built: 1967
Household type by relationship:
Households: 6,347- Male householders: 1,213 (168 living alone), Female householders: 1,250 (429 living alone)
1,482 spouses (1,482 opposite-sex spouses), 157 unmarried partners, (157 opposite-sex unmarried partners), 2,025 children (1,992 natural, 33 adopted, 0 stepchildren), 13 grandchildren, 9 brothers or sisters, 31 parents, 0 foster children, 63 other relatives, 63 non-relatives
- In group quarters: 37
Size of family households: 700 2-persons, 424 3-persons, 386 4-persons, 149 5-persons, 31 6-persons, 17 7-or-more-persons.
Size of nonfamily households: 624 1-person, 135 2-persons.
1,239 married couples with children.
140 single-parent households (22 men, 118 women).
88.1% of residents of Medfield speak English at home.
5.2% of residents speak Spanish at home (94% speak English very well, 6% speak English well).
2.4% of residents speak other Indo-European language at home (80% speak English very well, 20% speak English well).
3.7% of residents speak Asian or Pacific Island language at home (92% speak English very well, 8% speak English well).
Foreign born population: 556 (8.8%)
(72.8% of them are naturalized citizens)
| Here: | 8.0 |
| State: | 6.5 |
| Here: | 4.0 |
| State: | 4.0 |

- Bedrooms in owner-occupied houses and condos in Medfield, Massachusetts
- 0no bedroom
- 351 bedroom
- 2052 bedrooms
- 6713 bedrooms
- 9194 bedrooms
- 2345+ bedrooms

- Bedrooms in renter-occupied apartments in Medfield, Massachusetts
- 0no bedroom
- 1951 bedroom
- 1262 bedrooms
- 853 bedrooms
- 74 bedrooms
- 05+ bedrooms

- Cars and other vehicles available in Medfield in owner-occupied houses/condos
- 26no vehicle
- 4111 vehicle
- 1,1292 vehicles
- 3603 vehicles
- 1174 vehicles
- 205+ vehicles

- Cars and other vehicles available in Medfield in renter-occupied apartments
- 80no vehicle
- 2571 vehicle
- 762 vehicles
- 03 vehicles
- 04 vehicles
- 05+ vehicles

- Rooms in owner-occupied houses in Medfield, Massachusetts
- 01 room
- 272 rooms
- 223 rooms
- 874 rooms
- 2045 rooms
- 1276 rooms
- 3507 rooms
- 4058 rooms
- 8419+ rooms

- Rooms in renter-occupied apartments in Medfield, Massachusetts
- 01 room
- 642 rooms
- 853 rooms
- 1264 rooms
- 495 rooms
- 356 rooms
- 147 rooms
- 328 rooms
- 79+ rooms


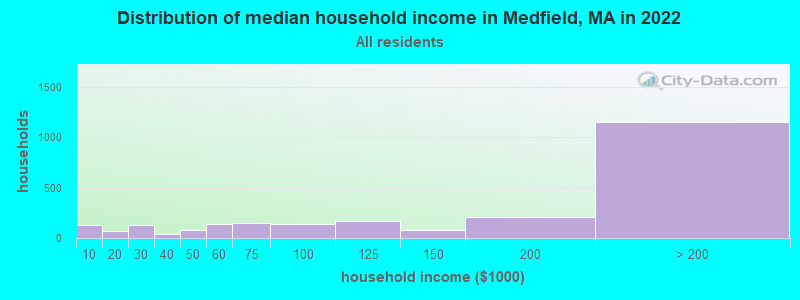
Medfield, MA household income distribution

- 126Less than $10,000
- 74$10,000 to $19,999
- 128$20,000 to $29,999
- 36$30,000 to $39,999
- 82$40,000 to $49,999
- 134$50,000 to $59,999
- 145$60,000 to $74,999
- 140$75,000 to $99,999
- 167$100,000 to $124,999
- 75$125,000 to $149,999
- 204$150,000 to $199,999
- 1,149$200,000 or more
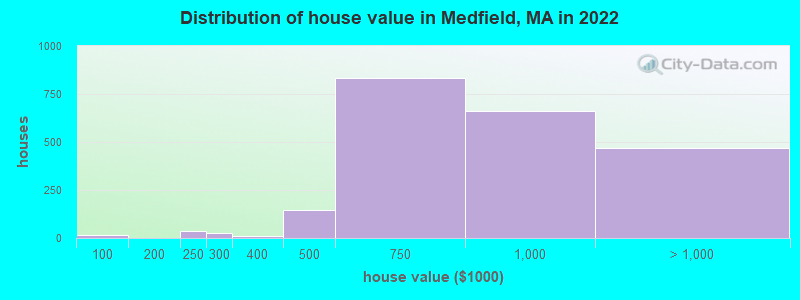
Home value of owner - occupied houses in 2022 in Medfield, MA
-
- 14$90,000 to $99,999
- 38$200,000 to $249,999
- 25$250,000 to $299,999
- 9$300,000 to $399,999
- 147$400,000 to $499,999
- 832$500,000 to $749,999
- 659$750,000 to $999,999
- 369$1,000,000 to $1,499,999
- 91$1,500,000 to $1,999,999
- 6$2,000,000 or more
Rent paid by renters in 2022 in Medfield, MA
-
- 10$150 to $199
- 115$200 to $249
- 14$350 to $399
- 12$400 to $449
- 12$450 to $499
- 28$500 to $549
- 7$700 to $749
- 11$900 to $999
- 33$1,000 to $1,249
- 39$1,250 to $1,499
- 98$1,500 to $1,999
- 26$2,000 to $2,499
- 16$3,000 to $3,499
- 10$3,500 or more
- 5No cash rent


Percentage of workers working in this county: 73.3%
Number of people working at home: 1,379 (41.4% of all workers)
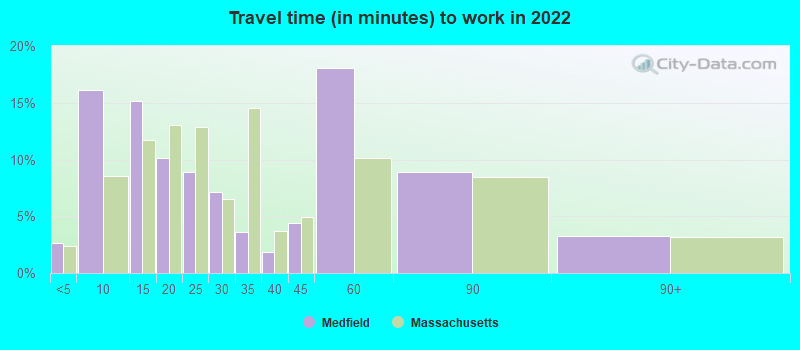
Travel time to work (commute)
- Less than 5 minutes: 91
- 5 to 9 minutes: 204
- 10 to 14 minutes: 199
- 15 to 19 minutes: 47
- 20 to 24 minutes: 260
- 25 to 29 minutes: 95
- 30 to 34 minutes: 285
- 35 to 39 minutes: 7
- 40 to 44 minutes: 80
- 45 to 59 minutes: 436
- 60 to 89 minutes: 343
- 90 or more minutes: 40
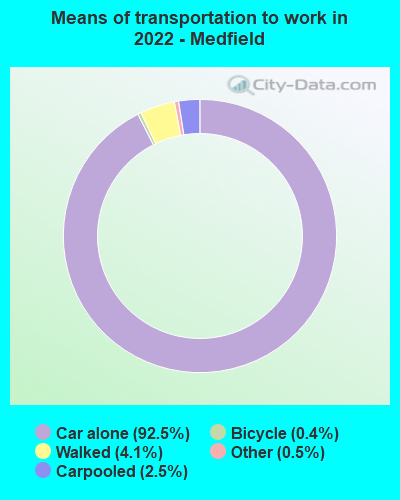
Means of transportation to work:
- Drove a car alone: 2,442 (62.9%)
- Carpooled: 65 (1.7%)
- Taxi: 13 (0.3%)
- Bicycle: 7 (0.2%)
- Walked: 101 (2.6%)
- Worked at home: 1,379 (35.5%)

- Unemployment by race in 2022
- Unemployment rate for White non-Hispanic residents
- 1.7%Males
- 5.4%Females
- Unemployment rate for Asian residents
- 6.9%Males
- Unemployment rate for two or more race residents
- 11.9%Males
- Unemployment rate for Hispanic or Latino residents
- 16.7%Males

- Year of entry for the foreign-born population in Medfield, Massachusetts
- 732010 or later
- 622000 to 2009
- 1011990 to 1999
- 201980 to 1989
- 991970 to 1979
- 174Before 1970
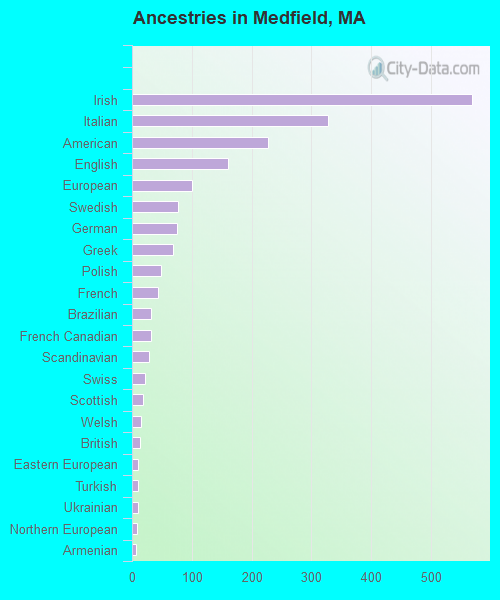
First ancestries reported:
- Irish: 569 (22.7%)
- Italian: 328 (13.1%)
- American: 227 (9.1%)
- English: 160 (6.4%)
- European: 101 (4.0%)
- Swedish: 77 (3.1%)
- German: 76 (3.0%)
- Greek: 69 (2.8%)
- Polish: 49 (2.0%)
- French: 43 (1.7%)
- Brazilian: 31 (1.2%)
- French Canadian: 31 (1.2%)
- Scandinavian: 29 (1.2%)
- Swiss: 22 (0.9%)
- Scottish: 18 (0.7%)
- Welsh: 15 (0.6%)
- British: 14 (0.6%)
- Eastern European: 10 (0.4%)
- Turkish: 10 (0.4%)
- Ukrainian: 10 (0.4%)
- Northern European: 9 (0.4%)
- Armenian: 7 (0.3%)
- Latvian: 4 (0.2%)
- Russian: 4 (0.2%)
- Scotch-Irish: 4 (0.2%)
Most common places of birth for foreign-born residents (%):
| Medfield: | 19.0% (105) |
| Massachusetts: | 8.4% (103,233) |
| Medfield: | 15.2% (84) |
| Massachusetts: | 0.2% (2,160) |
| Medfield: | 11.9% (66) |
| Massachusetts: | 0.9% (10,698) |
| Medfield: | 8.5% (47) |
| Massachusetts: | 0.3% (3,711) |
| Medfield: | 6.3% (35) |
| Massachusetts: | 0.1% (900) |
| Medfield: | 6.0% (33) |
| Massachusetts: | 6.8% (82,934) |
| Medfield: | 5.8% (32) |
| Massachusetts: | 0.4% (5,265) |
| Medfield: | 5.6% (31) |
| Massachusetts: | 7.6% (92,959) |
| Medfield: | 4.7% (26) |
| Massachusetts: | 0.2% (2,034) |
| Medfield: | 3.3% (18) |
| Massachusetts: | 1.1% (13,446) |
| Medfield: | 3.1% (17) |
| Massachusetts: | 0.8% (10,043) |
| Medfield: | 2.2% (12) |
| Massachusetts: | 0.7% (8,270) |
| Medfield: | 2.2% (12) |
| Massachusetts: | 8.3% (101,767) |
| Medfield: | 2.0% (11) |
| Massachusetts: | 0.9% (10,808) |
| Medfield: | 2.0% (11) |
| Massachusetts: | 0.4% (5,208) |
Place of birth for U.S.-born residents:
- This state: 4,071
- Other state: 1,621
- Northeast: 912
- Midwest: 209
- South: 359
- West: 129
92.3% of Medfield residents lived in the same house 1 years ago.
Out of people who lived in different houses, 31.6% lived in this county.
Out of people who lived in different counties, 32.6% lived in Massachusetts.
| Medfield: | 92.3% |
| State average: | 87.7% |
Education attainment for males 25 years and older:
- No schooling: 32
- Nursery to 4th grade: 0
- 5th and 6th grade: 0
- 7th and 8th grade: 26
- 9th grade: 0
- 10th grade: 0
- 11th grade: 0
- 12th grade, no diploma: 51
- High school graduate (or equivalency): 133
- Less than 1 year of college: 29
- Some college more than 1 year, no degree: 174
- Associate degree: 103
- Bachelor's degree: 877
- Master's degree: 455
- Professional school degree: 150
- Doctorate degree: 91

Education attainment for females 25 years and older:
- No schooling: 0
- Nursery to 4th grade: 0
- 5th and 6th grade: 0
- 7th and 8th grade: 24
- 9th grade: 0
- 10th grade: 0
- 11th grade: 0
- 12th grade, no diploma: 0
- High school graduate (or equivalency): 267
- Less than 1 year of college: 30
- Some college more than 1 year, no degree: 135
- Associate degree: 191
- Bachelor's degree: 972
- Master's degree: 564
- Professional school degree: 103
- Doctorate degree: 93


Housing units in structures:
- One, detached: 1,974
- One, attached: 157
- Two: 116
- 3 or 4: 62
- 5 to 9: 86
- 10 to 19: 96
- 20 to 49: 18
- 50 or more: 54
Housing units lacking complete kitchen facilities in 2022: 1.1%
House/condo owner moved in on average 14 years ago
Renter moved in on average 3 years ago

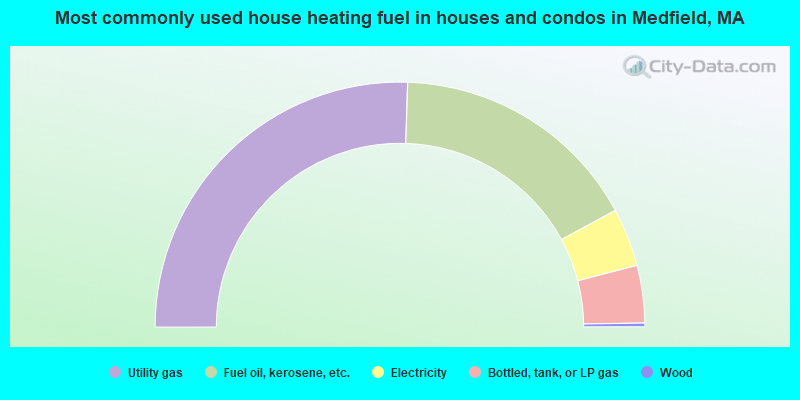
- 51.0%Utility gas
- 33.2%Fuel oil, kerosene, etc.
- 7.7%Electricity
- 7.6%Bottled, tank, or LP gas
- 0.5%Wood
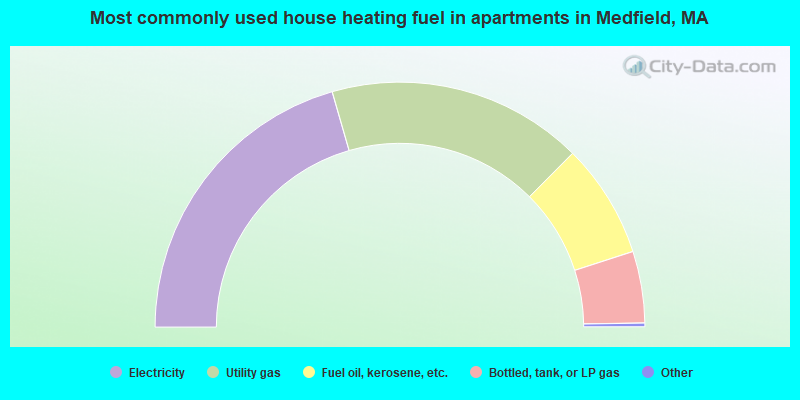
- 41.3%Electricity
- 34.0%Utility gas
- 15.2%Fuel oil, kerosene, etc.
- 9.5%Bottled, tank, or LP gas
Private vs. public school enrollment:
| Here: | 1.6% |
| Massachusetts: | 10.3% |
| Here: | 25.7% |
| Massachusetts: | 12.3% |
| Here: | 16.4% |
| Massachusetts: | 51.2% |


