Mehlville, MO (Missouri) Houses and Residents
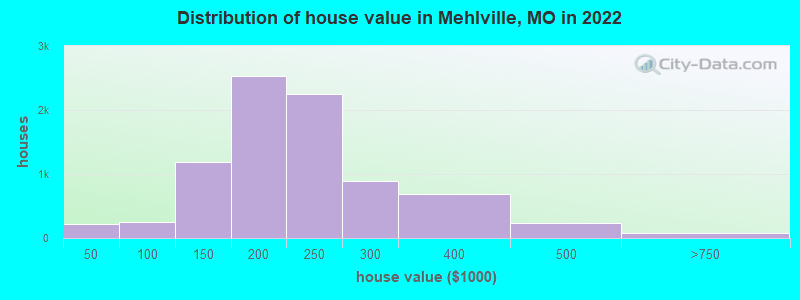
Estimated median house or condo value in 2022: $207,074 (it was $106,900 in 2000 )
Mehlville:
$207,074Missouri:
$221,200
Lower value quartile - upper value quartile: $168,509 - $256,288Mean price in 2022: Detached houses: $262,716 Here:
$262,716State:
$278,068
Townhouses or other attached units: $218,539 Here:
$218,539State:
$260,773
In 3-to-4-unit structures: $160,075 Here:
$160,075State:
$181,162
In 5-or-more-unit structures: $135,664 Here:
$135,664State:
$263,082
Mobile homes: $98,138 Here:
$98,138State:
$95,912
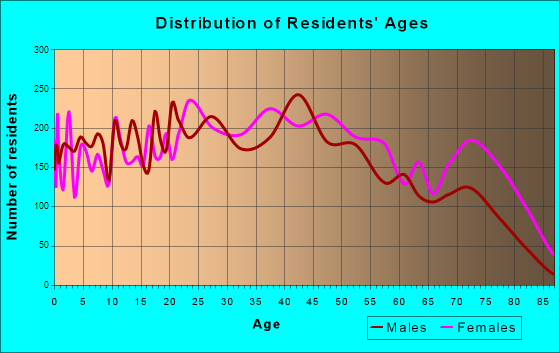
Total population: 28,380 (All urban)
Houses: 13,849 (13,142 occupied: 8,415 owner occupied, 4,697 renter occupied )
% of renters here:
36%State:
32%
Housing density: 1,880 houses/condos per square mile
Median price asked for vacant for-sale houses and condos in 2022: $2,036,188.
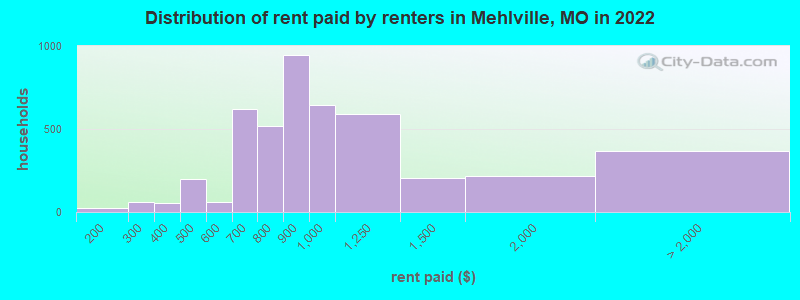
Median contract rent in 2022: $893 (lower quartile is $718, upper quartile is $1,017)
Median rent asked for vacant for-rent units in 2022: $1,601
Median gross rent in Mehlville, MO in 2022: $1,024
Housing units in Mehlville with a mortgage: 4,606 (345 second mortgage, 0 home equity loan, 324 both second mortgage and home equity loan )Houses without a mortgage: 348
Median household income for houses/condos with a mortgage: $94,153
Median household income for apartments without a mortgage: $64,639
Median monthly housing costs: $947
Data:
Median house or condo value ($)
Median house or condo value ($ change since 2000)
Median house or condo value ($) - White
Median house or condo value ($) - Black or African American
Median house or condo value ($) - Asian
Median house or condo value ($) - Hispanic or Latino
Median house or condo value ($) - American Indian and Alaska Native
Median house or condo value ($) - Multirace
Median house or condo value ($) - Other Race
Median price asked for mobile homes ($)
Household density (households per square mile)
Mean house or condo value by units in structure - 1, detached ($)
Mean house or condo value by units in structure - 1, attached ($)
Mean house or condo value by units in structure - 2 ($)
Mean house or condo value by units in structure by units in structure - 3 or 4 ($)
Mean house or condo value by units in structure - 5 or more ($)
Mean house or condo value by units in structure - Boat, RV, van, etc. ($)
Mean house or condo value by units in structure - Mobile home ($)
Median contract rent ($)
Median contract rent - Lower quartile ($)
Median contract rent - Upper quartile ($)
Median gross rent ($)
Urban houses (%)
Rural houses (%)
Houses occupied (%)
Houses occupied (% change since 2000)
Houses owner occupied (%)
Houses owner occupied (% change since 2000)
Houses renter occupied (%)
Houses renter occupied (% change since 2000)
Vacant housing units - For rent (%)
Vacant housing units - For rent (% change since 2000)
Vacant housing units - For sale only (%)
Vacant housing units - For sale only (% change since 2000)
Vacant housing units - Rented or sold, not occupied (%)
Vacant housing units - Rented or sold, not occupied (% change since 2000)
Vacant housing units - For seasonal, recreational, or occasional use (%)
Vacant housing units - For seasonal, recreational, or occasional use (% change since 2000)
Vacant housing units - For migrant workers (%)
Vacant housing units - For migrant workers (% change since 2000)
Vacant housing units - Other vacant (%)
Vacant housing units - Other vacant (% change since 2000)
Median monthly housing costs ($)
Median household income for houses/condos with a mortgage ($)
Median household income for houses/condos without a mortgage ($)
Median household income ($)
Median household income ($) - White
Median household income ($) - Black or African American
Median household income ($) - Asian
Median household income ($) - Hispanic or Latino
Median household income ($) - American Indian and Alaska Native
Median household income ($) - Multirace
Median household income ($) - Other Race
Mortgage status - with mortgage (%)
Mortgage status - with second mortgage (%)
Mortgage status - with home equity loan (%)
Mortgage status - with both second mortgage and home equity loan (%)
Mortgage status - without a mortgage (%)
Median year house/condo built
Median year apartment built
Household type by relationship - Male householder living alone (%)
Household type by relationship - Male householder not living alone (%)
Household type by relationship - Female householder living alone (%)
Household type by relationship - Female householder not living alone (%)
Household type by relationship - Opposite-Sex spouse (%)
Household type by relationship - Same-Sex spouse (%)
Household type by relationship - Opposite-Sex unmarried partner (%)
Household type by relationship - Same-Sex unmarried partner (%)
Household type by relationship - In group quarters (%)
Size of family households - 2-person household (%)
Size of family households - 3-person household (%)
Size of family households - 4-person household (%)
Size of family households - 5-person household (%)
Size of family households - 6-person household (%)
Size of family households - 7-or-more-person household (%)
Size of nonfamily households - 1-person household (%)
Size of nonfamily households - 2-person household (%)
Size of nonfamily households - 3-person household (%)
Size of nonfamily households - 4-person household (%)
Size of nonfamily households - 5-person household (%)
Size of nonfamily households - 6-person household (%)
Size of nonfamily households - 7-or-moreperson household (%)
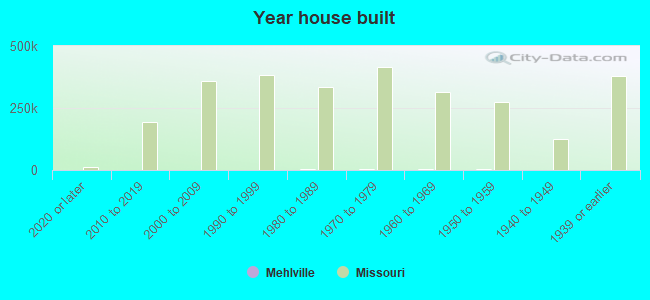
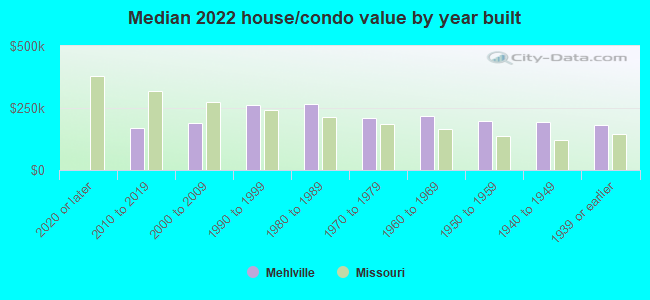
Year house built - Built 2010 or later (%)
Year house built - Built 2000 to 2009 (%)
Year house built - Built 1990 to 1999 (%)
Year house built - Built 1980 to 1989 (%)
Year house built - Built 1970 to 1979 (%)
Year house built - Built 1960 to 1969 (%)
Year house built - Built 1950 to 1959 (%)
Year house built - Built 1940 to 1949 (%)
Year house built - Built 1939 or earlier (%)
Median number of rooms in houses and condos
Median number of rooms in apartments
Median number of bedrooms in owner occupied houses
Mean number of bedrooms in owner occupied houses
Median number of bedrooms in renter occupied houses
Mean number of bedrooms in renter occupied houses
Median number of vehichles in owner occupied houses
Mean number of vehichles in owner occupied houses
Median number of vehichles in renter occupied houses
Mean number of vehichles in renter occupied houses
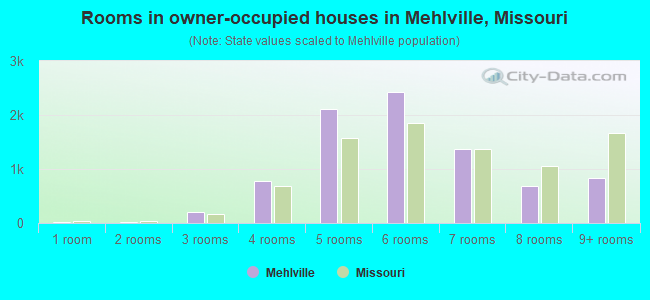
Rooms in owner-occupied houses - 1 room (%)
Rooms in owner-occupied houses - 2 rooms (%)
Rooms in owner-occupied houses - 3 rooms (%)
Rooms in owner-occupied houses - 4 rooms (%)
Rooms in owner-occupied houses - 5 rooms (%)
Rooms in owner-occupied houses - 6 rooms (%)
Rooms in owner-occupied houses - 7 rooms (%)
Rooms in owner-occupied houses - 8 rooms (%)
Rooms in owner-occupied houses - 9+ rooms (%)
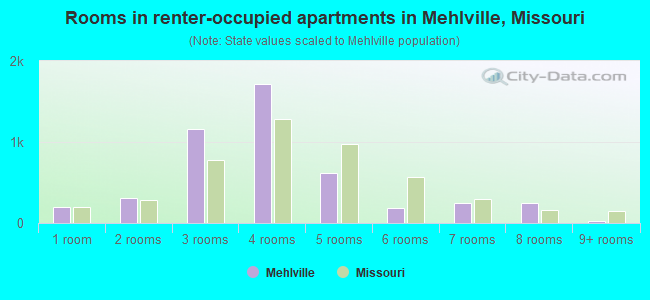
Rooms in renter-occupied houses - 1 room (%)
Rooms in renter-occupied houses - 2 rooms (%)
Rooms in renter-occupied houses - 3 rooms (%)
Rooms in renter-occupied houses - 4 rooms (%)
Rooms in renter-occupied houses - 5 rooms (%)
Rooms in renter-occupied houses - 6 rooms (%)
Rooms in renter-occupied houses - 7 rooms (%)
Rooms in renter-occupied houses - 8 rooms (%)
Rooms in renter-occupied houses - 9+ rooms (%)
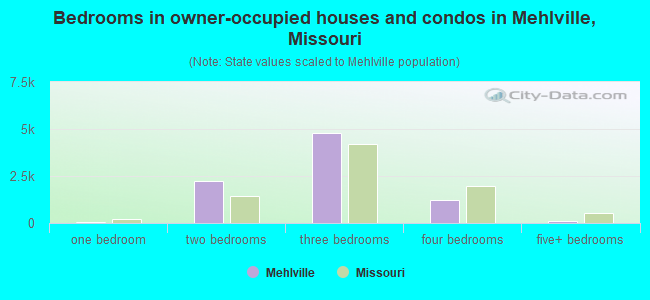
Bedrooms in owner-occupied houses - no bedrooms (%)
Bedrooms in owner-occupied houses - 1 bedroom (%)
Bedrooms in owner-occupied houses - 2 bedrooms (%)
Bedrooms in owner-occupied houses - 3 bedrooms (%)
Bedrooms in owner-occupied houses - 4 bedrooms (%)
Bedrooms in owner-occupied houses - 5+ bedrooms (%)
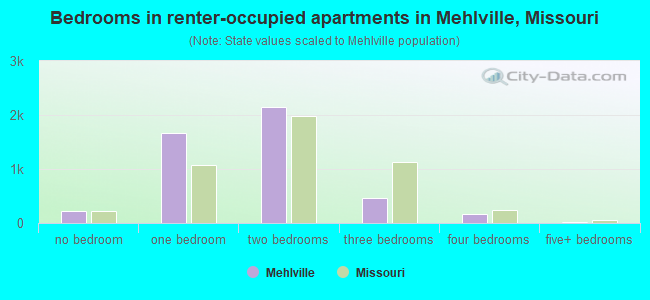
Bedrooms in renter-occupied houses - no bedrooms (%)
Bedrooms in renter-occupied houses - 1 bedroom (%)
Bedrooms in renter-occupied houses - 2 bedrooms (%)
Bedrooms in renter-occupied houses - 3 bedrooms (%)
Bedrooms in renter-occupied houses - 4 bedrooms (%)
Bedrooms in renter-occupied houses - 5+ bedrooms (%)
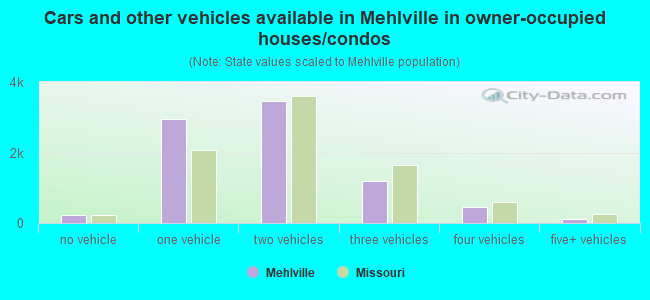
Vehicles available in owner-occupied houses - no vehicle available (%)
Vehicles available in owner-occupied houses - 1 vehicle available(%)
Vehicles available in owner-occupied houses - 2 Vehicles available (%)
Vehicles available in owner-occupied houses - 3 Vehicles available (%)
Vehicles available in owner-occupied houses - 4 Vehicles available (%)
Vehicles available in owner-occupied houses - 5+ Vehicles available (%)
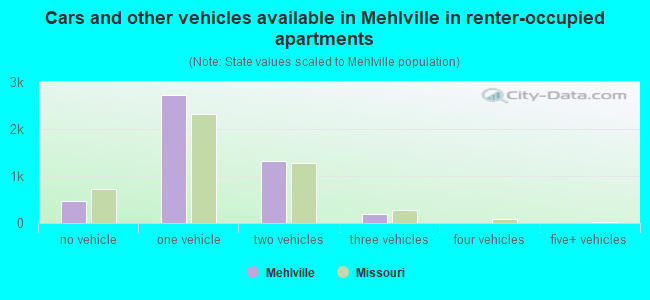
Vehicles available in renter-occupied houses - no vehicle available (%)
Vehicles available in renter-occupied houses - 1 vehicle available (%)
Vehicles available in renter-occupied houses - 2 Vehicles available (%)
Vehicles available in renter-occupied houses - 3 Vehicles available (%)
Vehicles available in renter-occupied houses - 4 Vehicles available (%)
Vehicles available in renter-occupied houses - 5+ Vehicles available (%)
Housing units in structures - 1, detached (%)
Housing units in structures - 1, attached (%)
Housing units in structures - 2 (%)
Housing units in structures - 3 or 4 (%)
Housing units in structures - 5 to 9 (%)
Housing units in structures - 10 to 19 (%)
Housing units in structures - 20 to 49 (%)
Housing units in structures - 50 or more (%)
Housing units in structures - Mobile home (%)
Housing units in structures - Boat, RV, van, etc. (%)
Housing units in structures - Owners - 1, detached (%)
Housing units in structures - Owners - 1, attached (%)
Housing units in structures - Owners - 2 (%)
Housing units in structures - Owners - 3 or 4 (%)
Housing units in structures - Owners - 5 to 9 (%)
Housing units in structures - Owners - 10 to 19 (%)
Housing units in structures - Owners - 20 to 49 (%)
Housing units in structures - Owners - 50 or more (%)
Housing units in structures - Owners - Mobile home (%)
Housing units in structures - Owners - Boat, RV, van, etc. (%)
Housing units in structures - Renters - 1, detached (%)
Housing units in structures - Renters - 1, attached (%)
Housing units in structures - Renters - 2 (%)
Housing units in structures - Renters - 3 or 4 (%)
Housing units in structures - Renters - 5 to 9 (%)
Housing units in structures - Renters - 10 to 19 (%)
Housing units in structures - Renters - 20 to 49 (%)
Housing units in structures - Renters - 50 or more (%)
Housing units in structures - Renters - Mobile home (%)
Housing units in structures - Renters - Boat, RV, van, etc. (%)
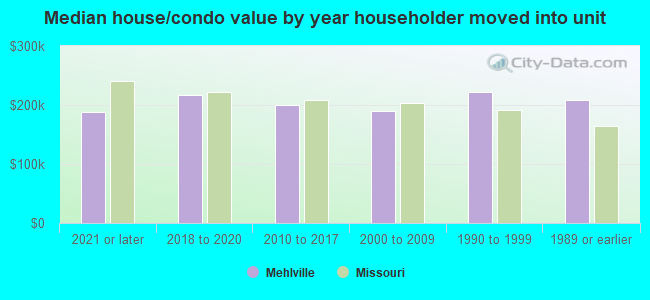
House/condo owner moved in on average (years ago)
Renter moved in on average (years ago)
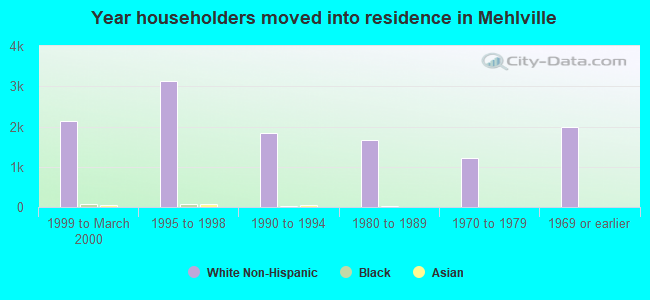
Year householder moved into unit - Moved in 1999 to March 2000 (%)
Year householder moved into unit - Moved in 1999 to March 2000 (%) - White
Year householder moved into unit - Moved in 1999 to March 2000 (%) - Black or African American
Year householder moved into unit - Moved in 1999 to March 2000 (%) - Asian
Year householder moved into unit - Moved in 1999 to March 2000 (%) - Hispanic or Latino
Year householder moved into unit - Moved in 1999 to March 2000 (%) - American Indian and Alaska Native
Year householder moved into unit - Moved in 1999 to March 2000 (%) - Multirace
Year householder moved into unit - Moved in 1999 to March 2000 (%) - Other Race
Year householder moved into unit - Moved in 1995 to 1998 (%)
Year householder moved into unit - Moved in 1995 to 1998 (%) - White
Year householder moved into unit - Moved in 1995 to 1998 (%) - Black or African American
Year householder moved into unit - Moved in 1995 to 1998 (%) - Asian
Year householder moved into unit - Moved in 1995 to 1998 (%) - Hispanic or Latino
Year householder moved into unit - Moved in 1995 to 1998 (%) - American Indian and Alaska Native
Year householder moved into unit - Moved in 1995 to 1998 (%) - Multirace
Year householder moved into unit - Moved in 1995 to 1998 (%) - Other Race
Year householder moved into unit - Moved in 1990 to 1994 (%)
Year householder moved into unit - Moved in 1990 to 1994 (%) - White
Year householder moved into unit - Moved in 1990 to 1994 (%) - Black or African American
Year householder moved into unit - Moved in 1990 to 1994 (%) - Asian
Year householder moved into unit - Moved in 1990 to 1994 (%) - Hispanic or Latino
Year householder moved into unit - Moved in 1990 to 1994 (%) - American Indian and Alaska Native
Year householder moved into unit - Moved in 1990 to 1994 (%) - Multirace
Year householder moved into unit - Moved in 1990 to 1994 (%) - Other Race
Year householder moved into unit - Moved in 1980 to 1989 (%)
Year householder moved into unit - Moved in 1980 to 1989 (%) - White
Year householder moved into unit - Moved in 1980 to 1989 (%) - Black or African American
Year householder moved into unit - Moved in 1980 to 1989 (%) - Asian
Year householder moved into unit - Moved in 1980 to 1989 (%) - Hispanic or Latino
Year householder moved into unit - Moved in 1980 to 1989 (%) - American Indian and Alaska Native
Year householder moved into unit - Moved in 1980 to 1989 (%) - Multirace
Year householder moved into unit - Moved in 1980 to 1989 (%) - Other Race
Year householder moved into unit - Moved in 1970 to 1979 (%)
Year householder moved into unit - Moved in 1970 to 1979 (%) - White
Year householder moved into unit - Moved in 1970 to 1979 (%) - Black or African American
Year householder moved into unit - Moved in 1970 to 1979 (%) - Asian
Year householder moved into unit - Moved in 1970 to 1979 (%) - Hispanic or Latino
Year householder moved into unit - Moved in 1970 to 1979 (%) - American Indian and Alaska Native
Year householder moved into unit - Moved in 1970 to 1979 (%) - Multirace
Year householder moved into unit - Moved in 1970 to 1979 (%) - Other Race
Year householder moved into unit - Moved in 1969 or earlier (%)
Year householder moved into unit - Moved in 1969 or earlier (%) - White
Year householder moved into unit - Moved in 1969 or earlier (%) - Black or African American
Year householder moved into unit - Moved in 1969 or earlier (%) - Asian
Year householder moved into unit - Moved in 1969 or earlier (%) - Hispanic or Latino
Year householder moved into unit - Moved in 1969 or earlier (%) - American Indian and Alaska Native
Year householder moved into unit - Moved in 1969 or earlier (%) - Multirace
Year householder moved into unit - Moved in 1969 or earlier (%) - Other Race
Housing units lacking complete plumbing facilities (%)
Housing units lacking complete kitchen facilities (%)
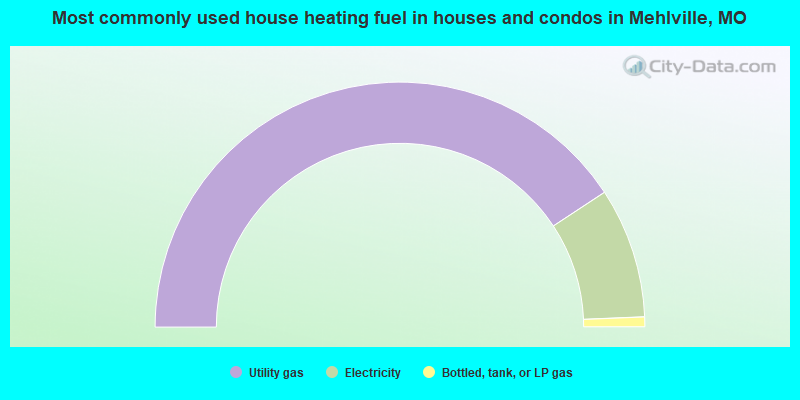
House heating fuel used in houses and condos - Utility gas (%)
House heating fuel used in houses and condos - Bottled, tank, or LP gas (%)
House heating fuel used in houses and condos - Electricity (%)
House heating fuel used in houses and condos - Fuel oil, kerosene, etc. (%)
House heating fuel used in houses and condos - Coal or coke (%)
House heating fuel used in houses and condos - Wood (%)
House heating fuel used in houses and condos - Solar energy (%)
House heating fuel used in houses and condos - Other fuel (%)
House heating fuel used in houses and condos - No fuel used (%)
House heating fuel used in apartments - Utility gas (%)
House heating fuel used in apartments - Bottled, tank, or LP gas (%)
House heating fuel used in apartments - Electricity (%)
House heating fuel used in apartments - Fuel oil, kerosene, etc. (%)
House heating fuel used in apartments - Coal or coke (%)
House heating fuel used in apartments - Wood (%)
House heating fuel used in apartments - Solar energy (%)
House heating fuel used in apartments - Other fuel (%)
House heating fuel used in apartments - No fuel used (%)
Latest news about housing in Mehlville, MO collected exclusively by city-data.com from local newspapers, TV, and radio stations
Median year house/condo built: 1966Median year apartment built: 1978Household type by relationship:
Households: 28,818
Male householders: 6,722 (2,300 living alone ), Female householders: 6,267 (2,393 living alone )5,462 spouses (5,391 opposite-sex spouses ), 1,024 unmarried partners , (973 opposite-sex unmarried partners ), 6,966 children (6,447 natural , 179 adopted , 339 stepchildren ), 466 grandchildren , 127 brothers or sisters , 188 parents , 524 foster children , 163 other relatives , 721 non-relatives In group quarters: 183
Size of family households: 3,742 2-persons , 2,283 3-persons , 846 4-persons , 544 5-persons , 99 6-persons , 93 7-or-more-persons .
Size of nonfamily households: 4,643 1-person , 776 2-persons , 65 3-persons , 9 5-persons .
2,983 married couples with children. single-parent households (322 men , 934 women ).
84.9% of residents of Mehlville speak English at home. of residents speak Spanish at home (49% speak English very well , 14% speak English well , 15% speak English not well , 22% don't speak English at all ).of residents speak other Indo-European language at home (61% speak English very well , 25% speak English well , 13% speak English not well , 1% don't speak English at all ).of residents speak Asian or Pacific Island language at home (18% speak English very well , 39% speak English well , 39% speak English not well , 4% don't speak English at all ).of residents speak other language at home (100% speak English very well ).
Foreign born population: 3,316 (11.5%)of them are naturalized citizens )
Median number of rooms in houses and condos:
Median number of rooms in apartments
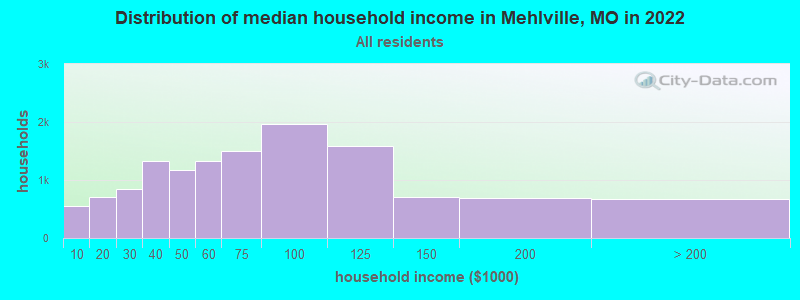
Mehlville, MO household income distribution 547 Less than $10,000704 $10,000 to $19,999846 $20,000 to $29,9991,319 $30,000 to $39,9991,171 $40,000 to $49,9991,320 $50,000 to $59,9991,493 $60,000 to $74,9991,974 $75,000 to $99,9991,580 $100,000 to $124,999713 $125,000 to $149,999687 $150,000 to $199,999680 $200,000 or more
Home value of owner - occupied houses in 2022 in Mehlville, MO 37 Less than $10,00027 $10,000 to $14,99949 $15,000 to $19,99947 $20,000 to $24,99915 $25,000 to $29,99936 $40,000 to $49,9995 $60,000 to $69,99915 $70,000 to $79,99994 $80,000 to $89,99992 $90,000 to $99,999339 $100,000 to $124,999841 $125,000 to $149,9991,235 $150,000 to $174,9991,299 $175,000 to $199,9992,245 $200,000 to $249,999886 $250,000 to $299,999683 $300,000 to $399,999240 $400,000 to $499,99954 $500,000 to $749,99923 $750,000 to $999,999Rent paid by renters in 2022 in Mehlville, MO 26 $100 to $14930 $200 to $24931 $250 to $29929 $300 to $34923 $350 to $399168 $400 to $44932 $450 to $49961 $550 to $599391 $600 to $649229 $650 to $699366 $700 to $749153 $750 to $799945 $800 to $899645 $900 to $999592 $1,000 to $1,249202 $1,250 to $1,499214 $1,500 to $1,99954 $2,000 to $2,49915 $2,500 to $2,99936 $3,500 or more261 No cash rent
Percentage of workers working in this county: 64.6%Number of people working at home: 1,129 (8.0% of all workers )
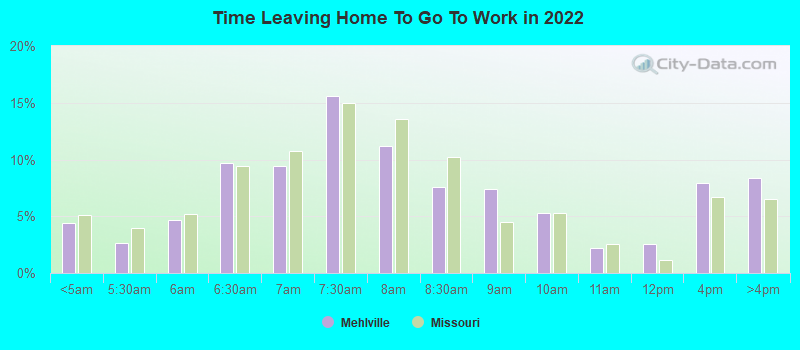
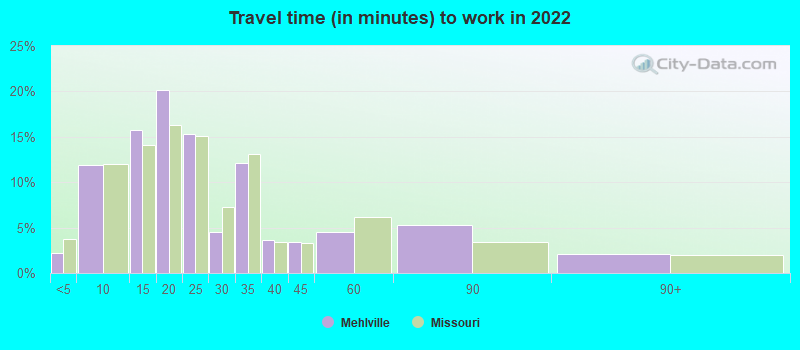
Travel time to work (commute)
Less than 5 minutes: 2055 to 9 minutes: 1,42310 to 14 minutes: 1,65215 to 19 minutes: 2,12320 to 24 minutes: 1,50925 to 29 minutes: 1,46130 to 34 minutes: 2,35735 to 39 minutes: 40440 to 44 minutes: 40345 to 59 minutes: 67960 to 89 minutes: 20690 or more minutes: 129
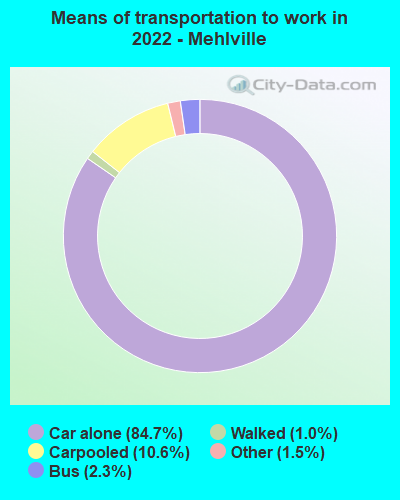
Means of transportation to work:
Drove a car alone: 6,514 (73.3%)Carpooled: 771 (8.7%)Bus : 172 (1.9%)Taxi: 106 (1.2%)Walked: 88 (1.0%)Worked at home: 1,129 (12.7%)
Unemployment by race in 2022
Unemployment rate for White non-Hispanic residents 5.3% Males2.2% FemalesUnemployment rate for Black residents 5.2% MalesUnemployment rate for Asian residents 9.2% FemalesUnemployment rate for two or more race residents 4.6% FemalesUnemployment rate for Hispanic or Latino residents 5.6% Females
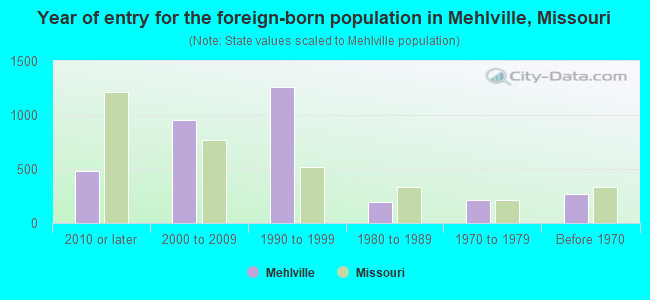
Year of entry for the foreign-born population in Mehlville, Missouri
482 2010 or later 954 2000 to 2009 1,261 1990 to 1999 195 1980 to 1989 212 1970 to 1979 270 Before 1970
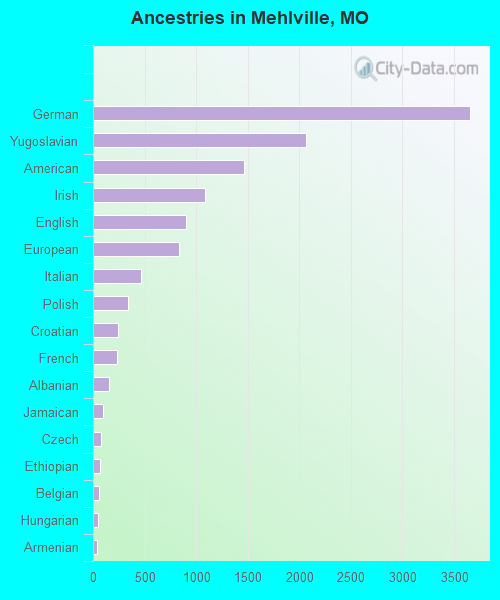
First ancestries reported:
German: 3,656 (25.6%)
Yugoslavian: 2,066 (14.4%)
American: 1,465 (10.2%)
Irish: 1,089 (7.6%)
English: 899 (6.3%)
European: 837 (5.9%)
Italian: 466 (3.3%)
Polish: 337 (2.4%)
Croatian: 244 (1.7%)
French: 230 (1.6%)
Albanian: 159 (1.1%)
Jamaican: 93 (0.7%)
Czech: 73 (0.5%)
Ethiopian: 68 (0.5%)
Belgian: 62 (0.4%)
Hungarian: 53 (0.4%)
Armenian: 35 (0.2%)
Russian: 32 (0.2%)
Austrian: 28 (0.2%)
Scottish: 27 (0.2%)
Canadian: 27 (0.2%)
Norwegian: 22 (0.2%)
Swiss: 22 (0.2%)
Welsh: 21 (0.1%)
Lebanese: 20 (0.1%)
African: 18 (0.1%)
British: 17 (0.1%)
Ukrainian: 17 (0.1%)
Cajun: 17 (0.1%)
Swedish: 16 (0.1%)
Scotch-Irish: 15 (0.1%)
Greek: 15 (0.1%)
Macedonian: 13 (0.09%)
Eastern European: 13 (0.09%)
Lithuanian: 9 (0.06%)
Turkish: 8 (0.06%)
Serbian: 5 (0.03%) Most common places of birth for foreign-born residents (%): Bosnia and Herzegovina Mehlville:
46.7% (1,530)Missouri:
3.2% (8,168)
Vietnam Mehlville:
6.2% (202)Missouri:
4.1% (10,700)
Albania Mehlville:
5.4% (176)Missouri:
0.4% (1,155)
Germany Mehlville:
5.3% (173)Missouri:
3.0% (7,803)
Philippines Mehlville:
3.8% (123)Missouri:
4.2% (10,873)
Jamaica Mehlville:
3.0% (99)Missouri:
0.9% (2,341)
Europe, n.e.c. Mehlville:
2.9% (95)Missouri:
0.1% (289)
Korea Mehlville:
2.6% (84)Missouri:
2.9% (7,525)
Mexico Mehlville:
2.5% (81)Missouri:
14.9% (38,568)
Croatia Mehlville:
2.0% (64)Missouri:
0.3% (719)
Place of birth for U.S.-born residents:
This state: 20,433Other state: 4,912Northeast: 253Midwest: 2,865South: 1,159West: 558 86.6% of Mehlville residents lived in the same house 1 years ago.
Out of people who lived in different houses, 35.2% lived in this county.
Out of people who lived in different counties, 62.3% lived in Missouri.
Mehlville:
86.6%State average:
87.1%
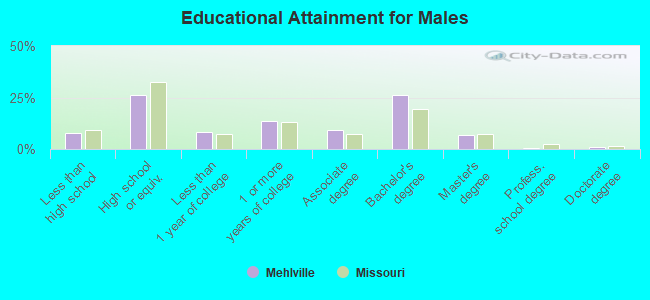
Education attainment for males 25 years and older:
No schooling: 96Nursery to 4th grade: 05th and 6th grade: 07th and 8th grade: 179th grade: 910th grade: 17511th grade: 6112th grade, no diploma: 447High school graduate (or equivalency): 2,617Less than 1 year of college: 852Some college more than 1 year, no degree: 1,378Associate degree: 909Bachelor's degree: 2,661Master's degree: 692Professional school degree: 71Doctorate degree: 90
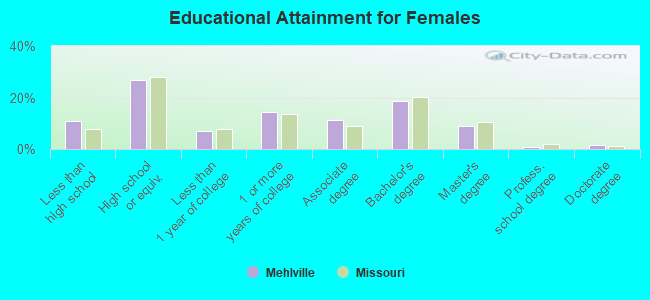
Education attainment for females 25 years and older:
No schooling: 168Nursery to 4th grade: 1345th and 6th grade: 247th and 8th grade: 2159th grade: 12910th grade: 7911th grade: 6812th grade, no diploma: 326High school graduate (or equivalency): 2,869Less than 1 year of college: 749Some college more than 1 year, no degree: 1,521Associate degree: 1,182Bachelor's degree: 1,978Master's degree: 956Professional school degree: 89Doctorate degree: 185
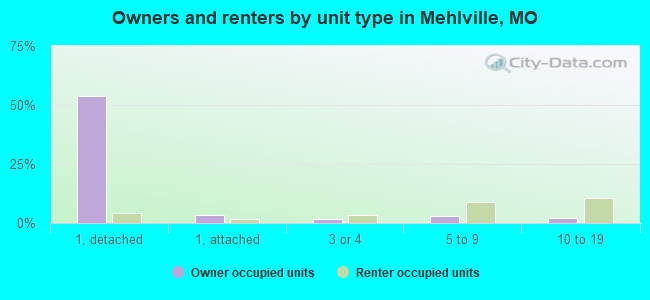
Housing units in structures:
One, detached: 8,192One, attached: 6223 or 4: 6935 to 9: 1,30110 to 19: 1,56620 to 49: 83650 or more: 613Mobile homes: 22Housing units lacking complete plumbing facilities in 2022: 0.1%Housing units lacking complete kitchen facilities in 2022: 1.0%House/condo owner moved in on average 14 years ago
Renter moved in on average 1 years ago
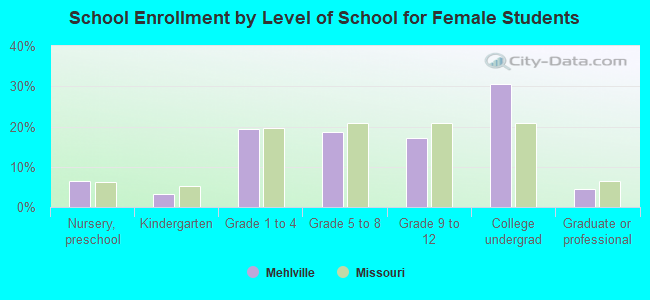
Private vs. public school enrollment:
Students in private schools in grades 1 to 8 (elementary and middle school): 353 Students in private schools in grades 9 to 12 (high school): 170 Students in private undergraduate colleges: 331