Menlo Park, CA (California) Houses and Residents
| Menlo Park: | $2,201,486 |
| California: | $715,900 |
Total population: 33,309 (Urban population: 30,786, Rural population: 0)
Houses: 13,261 (11,791 occupied: 6,505 owner occupied, 5,058 renter occupied)
| % of renters here: | 44% |
| State: | 44% |
Housing density: 1,310 houses/condos per square mile
Median price asked for vacant for-sale houses and condos in 2022: $2,790,893.
Median contract rent in 2022: over $2,000 (lower quartile is $1,932, upper quartile is over $2,000)
Median rent asked for vacant for-rent units in 2022: $4,514
Median gross rent in Menlo Park, CA in 2022: over $2,000
Housing units in Menlo Park with a mortgage: 4,030 (650 second mortgage, 6 home equity loan, 600 both second mortgage and home equity loan)
Houses without a mortgage: 38
Median household income for houses/condos with a mortgage: $258,196
Median household income for apartments without a mortgage: $194,420
Median monthly housing costs: $3,221
Compare current foreclosures near Menlo Park, CA:
| Photo | Address | Area | Beds / Baths | Price | Details |
|---|---|---|---|---|---|

|
#1
Sevier Ave
Menlo Park, CA 94025
|
1,030 sq. feet
|
1 baths 3 beds |
show details | |

|
#2
7th Ave
Menlo Park, CA 94025
|
1,689 sq. feet
|
2 baths 3 beds |
show details | |

|
#3
17th Ave
Menlo Park, CA 94025
|
1,610 sq. feet
|
2 baths 3 beds |
show details | |

|
#4
7th Ave
Menlo Park, CA 94025
|
680 sq. feet
|
1 baths 2 beds |
show details | |

|
#5
Sevier Ave
Menlo Park, CA 94025
|
1,030 sq. feet
|
1 baths 3 beds |
show details | |

|
#6
Windermere Ave
Menlo Park, CA 94025
|
1,460 sq. feet
|
2 baths 3 beds |
show details | |

|
#7
Madera Ave
Menlo Park, CA 94025
|
1,420 sq. feet
|
2 baths 4 beds |
show details | |

|
#8
7th Ave
Menlo Park, CA 94025
|
1,880 sq. feet
|
2 baths 3 beds |
show details | |

|
#9
Sevier Ave
Menlo Park, CA 94025
|
- sq. feet
|
- baths - beds |
show details | |

|
#10
University Dr Ste 109
Menlo Park, CA 94025
|
- sq. feet
|
- baths - beds |
show details |
| Photo | Address | Area | Beds / Baths | Price | Details |
|---|---|---|---|---|---|

|
#11
El Camino Real # 120
Menlo Park, CA 94025
|
- sq. feet
|
- baths - beds |
show details | |

|
#12
Bohannon Dr Unit 2628
Menlo Park, CA 94026
|
- sq. feet
|
- baths - beds |
show details | |

|
#13
Pierce Rd Apt 2
Menlo Park, CA 94025
|
- sq. feet
|
- baths - beds |
show details | |

|
#14
El Camino Real Ste 120
Menlo Park, CA 94025
|
- sq. feet
|
- baths - beds |
show details | |

|
#15
Hamilton Ave
Menlo Park, CA 94025
|
- sq. feet
|
- baths - beds |
show details | |

|
#16
Wickman Pl
San Lorenzo, CA 94580
|
900 sq. feet
|
1 baths 2 beds |
show details | |

|
#17
Russell Ln
Milpitas, CA 95035
|
2,144 sq. feet
|
2 baths 4 beds |
show details | |

|
#18
Pinemont Dr
Campbell, CA 95008
|
1,675 sq. feet
|
2 baths 4 beds |
show details | |

|
#19
Bowers Ave
Santa Clara, CA 95051
|
1,315 sq. feet
|
2 baths 4 beds |
show details | |

|
#20
Hemlock Ave
Redwood City, CA 94061
|
1,440 sq. feet
|
2 baths 4 beds |
show details |
| Photo | Address | Area | Beds / Baths | Price | Details |
|---|---|---|---|---|---|

|
#21
S Humboldt St
San Mateo, CA 94401
|
1,290 sq. feet
|
2 baths 3 beds |
show details | |

|
#22
Mirada Rd
Half Moon Bay, CA 94019
|
2,450 sq. feet
|
4 baths 4 beds |
show details | |

|
#23
Hempstead Pl
Redwood City, CA 94061
|
1,020 sq. feet
|
1 baths 3 beds |
show details | |

|
#24
3rd St
Hayward, CA 94541
|
1,324 sq. feet
|
1 baths 2 beds |
show details | |

|
#25
Alameda De Las Pulgas
Redwood City, CA 94061
|
1,250 sq. feet
|
2 baths 3 beds |
show details | |

|
#26
Middlefield Ave
Fremont, CA 94539
|
3,624 sq. feet
|
2 baths 3 beds |
show details | |

|
#27
Lorenzo Ave
San Lorenzo, CA 94580
|
1,937 sq. feet
|
1 baths 3 beds |
show details | |

|
#28
Endicott St
San Leandro, CA 94579
|
1,164 sq. feet
|
1 baths 2 beds |
show details | |

|
#29
Tribune Ave
Hayward, CA 94542
|
2,234 sq. feet
|
2 baths 4 beds |
show details | |

|
#30
Bellwood Dr
Santa Clara, CA 95054
|
2,010 sq. feet
|
2 baths 5 beds |
show details |
| Photo | Address | Area | Beds / Baths | Price | Details |
|---|---|---|---|---|---|

|
#31
Burke Dr
Hayward, CA 94544
|
1,193 sq. feet
|
1 baths 3 beds |
show details | |

|
#32
Chestnut St
San Carlos, CA 94070
|
1,390 sq. feet
|
2 baths 3 beds |
show details | |

|
#33
Sherman Dr
Union City, CA 94587
|
1,463 sq. feet
|
2 baths 4 beds |
show details | |

|
#34
Lorenzo Ave
San Lorenzo, CA 94580
|
2,037 sq. feet
|
2 baths 2 beds |
show details | |

|
#35
Monterey Ave
Santa Clara, CA 95051
|
1,078 sq. feet
|
2 baths 3 beds |
show details | |

|
#36
Early Rivers Pl
Union City, CA 94587
|
1,550 sq. feet
|
2 baths 4 beds |
show details | |

|
#37
Dewey Pl
Fremont, CA 94538
|
1,232 sq. feet
|
2 baths 3 beds |
show details | |

|
#38
Saratoga Ave
Palo Alto, CA 94303
|
750 sq. feet
|
1 baths 3 beds |
show details | |

|
#39
Mulberry St
Newark, CA 94560
|
984 sq. feet
|
1 baths 3 beds |
show details | |

|
#40
Pescadero Ct
Milpitas, CA 95035
|
1,773 sq. feet
|
2 baths 4 beds |
show details |
| Photo | Address | Area | Beds / Baths | Price | Details |
|---|---|---|---|---|---|

|
#41
Walnut Ter
Fremont, CA 94536
|
1,270 sq. feet
|
2 baths 2 beds |
show details | |

|
#42
Appian Way
Union City, CA 94587
|
1,092 sq. feet
|
2 baths 3 beds |
show details | |

|
#43
Flannery St
Santa Clara, CA 95051
|
1,396 sq. feet
|
2 baths 4 beds |
show details | |

|
#44
Fan Palm Ct
Santa Clara, CA 95050
|
1,256 sq. feet
|
1 baths 2 beds |
show details | |

|
#45
3rd St
Fremont, CA 94536
|
448 sq. feet
|
5 baths 1 beds |
show details | |

|
#46
Cholla St
Fremont, CA 94539
|
1,544 sq. feet
|
2 baths 4 beds |
show details | |

|
#47
Roanoke St
Hayward, CA 94544
|
1,056 sq. feet
|
1 baths 3 beds |
show details | |

|
#48
Meadowbrook Ave
Hayward, CA 94544
|
1,161 sq. feet
|
2 baths 3 beds |
show details | |

|
#49
Seneca St
Hayward, CA 94544
|
1,191 sq. feet
|
1 baths 3 beds |
show details | |

|
Check over 1 million property listings on Foreclosure.com!
|
browse all offers | |||


 | $1M budget for home, commute to Menlo Park, best options? (15 replies) |
| Apartments in Menlo Park: help! (9 replies) |
| can this alleviate bay area housing crisis? (116 replies) |
| Apartments in Menlo Park (4 replies) |
| SJ Mercury News: Bay Area median home price tops $1M across region (2 replies) |
| Michigan to Bay Area- Finding Home (14 replies) |

Median year apartment built: 1967
Household type by relationship:
Households: 32,216- Male householders: 5,948 (1,028 living alone), Female householders: 5,324 (1,722 living alone)
6,368 spouses (6,272 opposite-sex spouses), 606 unmarried partners, (561 opposite-sex unmarried partners), 9,323 children (9,020 natural, 166 adopted, 136 stepchildren), 440 grandchildren, 257 brothers or sisters, 360 parents, 0 foster children, 572 other relatives, 1,746 non-relatives
- In group quarters: 1,267
Size of family households: 2,899 2-persons, 2,028 3-persons, 1,459 4-persons, 726 5-persons, 88 6-persons, 128 7-or-more-persons.
Size of nonfamily households: 3,111 1-person, 891 2-persons, 84 3-persons, 124 4-persons, 5 5-persons.
5,644 married couples with children.
908 single-parent households (119 men, 789 women).
63.6% of residents of Menlo Park speak English at home.
13.3% of residents speak Spanish at home (69% speak English very well, 15% speak English well, 11% speak English not well, 5% don't speak English at all).
9.4% of residents speak other Indo-European language at home (89% speak English very well, 9% speak English well, 2% speak English not well).
11.4% of residents speak Asian or Pacific Island language at home (78% speak English very well, 13% speak English well, 6% speak English not well, 2% don't speak English at all).
1.8% of residents speak other language at home (92% speak English very well, 8% speak English not well).
Foreign born population: 9,738 (30.2%)
(44.9% of them are naturalized citizens)
| Here: | 6.7 |
| State: | 6.0 |
| Here: | 3.6 |
| State: | 3.9 |

- Bedrooms in owner-occupied houses and condos in Menlo Park, California
- 8no bedroom
- 491 bedroom
- 1,0872 bedrooms
- 2,6963 bedrooms
- 2,0164 bedrooms
- 6505+ bedrooms

- Bedrooms in renter-occupied apartments in Menlo Park, California
- 633no bedroom
- 1,4811 bedroom
- 1,7452 bedrooms
- 9823 bedrooms
- 1754 bedrooms
- 445+ bedrooms

- Cars and other vehicles available in Menlo Park in owner-occupied houses/condos
- 118no vehicle
- 1,4771 vehicle
- 3,1472 vehicles
- 1,2183 vehicles
- 3464 vehicles
- 2005+ vehicles

- Cars and other vehicles available in Menlo Park in renter-occupied apartments
- 785no vehicle
- 2,6281 vehicle
- 1,2502 vehicles
- 2783 vehicles
- 1084 vehicles
- 95+ vehicles

- Rooms in owner-occupied houses in Menlo Park, California
- 81 room
- 62 rooms
- 1233 rooms
- 5524 rooms
- 1,1105 rooms
- 1,3816 rooms
- 1,1527 rooms
- 1,0368 rooms
- 1,1369+ rooms

- Rooms in renter-occupied apartments in Menlo Park, California
- 4921 room
- 7772 rooms
- 1,0363 rooms
- 1,3274 rooms
- 7155 rooms
- 3406 rooms
- 1677 rooms
- 588 rooms
- 1479+ rooms


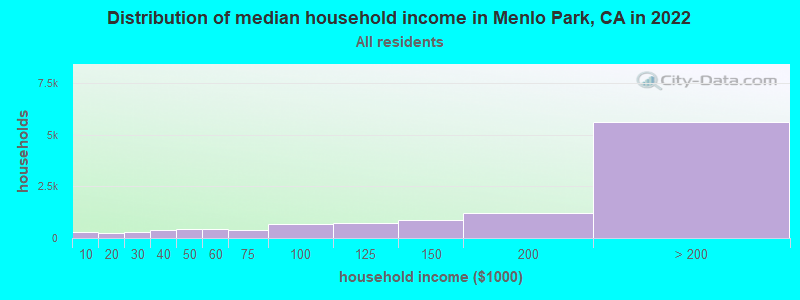
Menlo Park, CA household income distribution

- 299Less than $10,000
- 232$10,000 to $19,999
- 285$20,000 to $29,999
- 395$30,000 to $39,999
- 426$40,000 to $49,999
- 448$50,000 to $59,999
- 367$60,000 to $74,999
- 667$75,000 to $99,999
- 722$100,000 to $124,999
- 866$125,000 to $149,999
- 1,201$150,000 to $199,999
- 5,626$200,000 or more
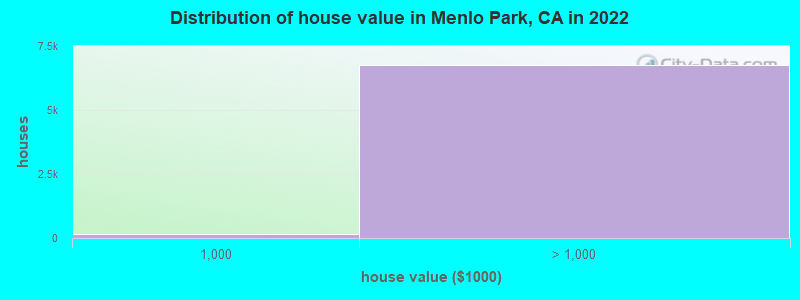
Home value of owner - occupied houses in 2022 in Menlo Park, CA
-
- 23Less than $10,000
- 18$40,000 to $49,999
- 27$100,000 to $124,999
- 18$200,000 to $249,999
- 14$250,000 to $299,999
- 37$300,000 to $399,999
- 5$400,000 to $499,999
- 59$500,000 to $749,999
- 147$750,000 to $999,999
- 648$1,000,000 to $1,499,999
- 740$1,500,000 to $1,999,999
- 5,374$2,000,000 or more
Rent paid by renters in 2022 in Menlo Park, CA
-
- 36Less than $100
- 9$100 to $149
- 24$200 to $249
- 15$250 to $299
- 25$300 to $349
- 34$350 to $399
- 12$400 to $449
- 14$450 to $499
- 11$550 to $599
- 13$600 to $649
- 91$650 to $699
- 10$700 to $749
- 97$900 to $999
- 119$1,000 to $1,249
- 231$1,250 to $1,499
- 595$1,500 to $1,999
- 808$2,000 to $2,499
- 957$2,500 to $2,999
- 550$3,000 to $3,499
- 1,317$3,500 or more
- 119No cash rent


Percentage of workers working in this county: 62.3%
Number of people working at home: 5,647 (36.5% of all workers)
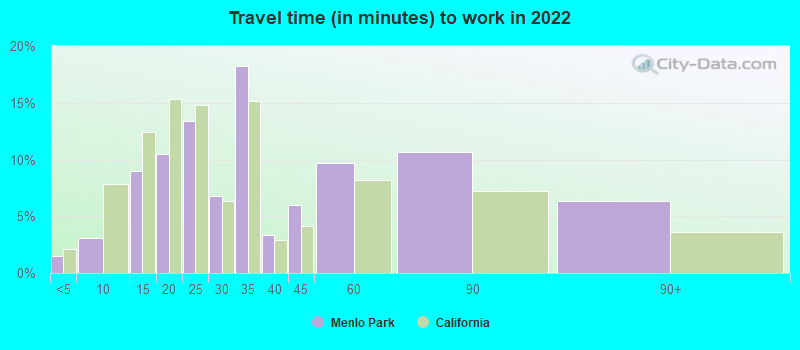
Travel time to work (commute)
- Less than 5 minutes: 260
- 5 to 9 minutes: 851
- 10 to 14 minutes: 1,613
- 15 to 19 minutes: 2,080
- 20 to 24 minutes: 1,872
- 25 to 29 minutes: 848
- 30 to 34 minutes: 1,411
- 35 to 39 minutes: 470
- 40 to 44 minutes: 304
- 45 to 59 minutes: 417
- 60 to 89 minutes: 328
- 90 or more minutes: 202
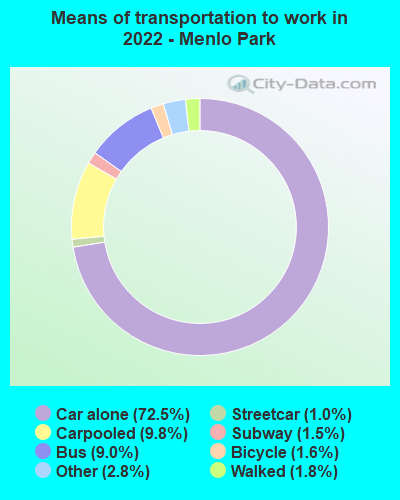
Means of transportation to work:
- Drove a car alone: 23,595 (60.1%)
- Carpooled: 3,472 (8.8%)
- Bus: 2,619 (6.7%)
- Subway or elevated rail: 261 (0.7%)
- Long-distance train or commuter rail: 501 (1.3%)
- Light rail, streetcar or trolley: 9 (0.0%)
- Ferryboat: 8 (0.0%)
- Taxi: 734 (1.9%)
- Bicycle: 606 (1.5%)
- Walked: 661 (1.7%)
- Worked at home: 5,647 (14.4%)

- Unemployment by race in 2022
- Unemployment rate for White non-Hispanic residents
- 2.7%Males
- 2.6%Females
- Unemployment rate for Black residents
- 7.3%Males
- 1.2%Females
- Unemployment rate for American Indian and Alaska Native residents
- 21.8%Females
- Unemployment rate for Asian residents
- 1.5%Males
- 2.1%Females
- Unemployment rate for other race residents
- 9.7%Males
- Unemployment rate for two or more race residents
- 5.0%Males
- Unemployment rate for Hispanic or Latino residents
- 6.5%Males
- 7.6%Females

- Year of entry for the foreign-born population in Menlo Park, California
- 4,3452010 or later
- 1,3552000 to 2009
- 1,6851990 to 1999
- 1,8161980 to 1989
- 1,0771970 to 1979
- 1,060Before 1970

First ancestries reported:
- American: 1,067 (6.2%)
- English: 882 (5.1%)
- Irish: 843 (4.9%)
- German: 748 (4.3%)
- Italian: 677 (3.9%)
- European: 400 (2.3%)
- Polish: 338 (2.0%)
- Israeli: 261 (1.5%)
- British: 214 (1.2%)
- Russian: 206 (1.2%)
- Iranian: 197 (1.1%)
- French: 188 (1.1%)
- Jamaican: 153 (0.9%)
- Scottish: 120 (0.7%)
- Northern European: 115 (0.7%)
- Turkish: 112 (0.7%)
- Ukrainian: 111 (0.6%)
- Eastern European: 108 (0.6%)
- Norwegian: 97 (0.6%)
- Dutch: 92 (0.5%)
- Hungarian: 91 (0.5%)
- Swedish: 85 (0.5%)
- Croatian: 78 (0.5%)
- Serbian: 78 (0.5%)
- Belgian: 77 (0.4%)
- Greek: 72 (0.4%)
- Bulgarian: 67 (0.4%)
- Brazilian: 66 (0.4%)
- Romanian: 61 (0.4%)
- Scotch-Irish: 59 (0.3%)
- Lebanese: 58 (0.3%)
- Finnish: 53 (0.3%)
- Danish: 49 (0.3%)
- Portuguese: 43 (0.3%)
- French Canadian: 38 (0.2%)
- Estonian: 37 (0.2%)
- Basque: 36 (0.2%)
- Swiss: 34 (0.2%)
- Lithuanian: 27 (0.2%)
- Scandinavian: 26 (0.2%)
- African: 26 (0.2%)
- Czech: 16 (0.09%)
- Arab: 16 (0.09%)
- Slavic: 15 (0.09%)
- Icelander: 14 (0.08%)
- Afghan: 13 (0.08%)
- Latvian: 10 (0.06%)
- New Zealander: 8 (0.05%)
- Armenian: 7 (0.04%)
- Haitian: 5 (0.03%)
- Egyptian: 4 (0.02%)
Most common places of birth for foreign-born residents (%):
| Menlo Park: | 13.0% (1,281) |
| California: | 37.2% (3,881,193) |
| Menlo Park: | 10.6% (1,045) |
| California: | 6.6% (684,672) |
| Menlo Park: | 7.2% (711) |
| California: | 5.2% (539,184) |
| Menlo Park: | 4.9% (479) |
| California: | 1.2% (127,477) |
| Menlo Park: | 3.5% (344) |
| California: | 4.2% (440,287) |
| Menlo Park: | 3.4% (340) |
| California: | 0.3% (33,029) |
| Menlo Park: | 3.4% (335) |
| California: | 7.8% (818,297) |
| Menlo Park: | 3.3% (328) |
| California: | 3.0% (315,248) |
| Menlo Park: | 3.2% (314) |
| California: | 0.5% (53,222) |
| Menlo Park: | 3.0% (296) |
| California: | 0.6% (60,582) |
| Menlo Park: | 2.5% (251) |
| California: | 0.7% (73,304) |
| Menlo Park: | 2.4% (240) |
| California: | 1.0% (103,575) |
| Menlo Park: | 2.4% (232) |
| California: | 0.2% (20,997) |
| Menlo Park: | 2.1% (211) |
| California: | 2.0% (206,004) |
| Menlo Park: | 2.0% (195) |
| California: | 1.7% (176,274) |
| Menlo Park: | 1.9% (189) |
| California: | 1.0% (105,215) |
| Menlo Park: | 1.9% (187) |
| California: | 0.2% (23,338) |
| Menlo Park: | 1.8% (182) |
| California: | 0.2% (18,925) |
| Menlo Park: | 1.8% (181) |
| California: | 0.3% (31,439) |
Place of birth for U.S.-born residents:
- This state: 13,878
- Other state: 7,988
- Northeast: 2,411
- Midwest: 2,218
- South: 2,027
- West: 1,257
79.3% of Menlo Park residents lived in the same house 1 years ago.
Out of people who lived in different houses, 22.4% lived in this county.
Out of people who lived in different counties, 64.8% lived in California.
| Menlo Park: | 79.3% |
| State average: | 88.9% |
Education attainment for males 25 years and older:
- No schooling: 134
- Nursery to 4th grade: 57
- 5th and 6th grade: 81
- 7th and 8th grade: 56
- 9th grade: 33
- 10th grade: 66
- 11th grade: 54
- 12th grade, no diploma: 100
- High school graduate (or equivalency): 1,110
- Less than 1 year of college: 417
- Some college more than 1 year, no degree: 661
- Associate degree: 307
- Bachelor's degree: 2,665
- Master's degree: 3,008
- Professional school degree: 790
- Doctorate degree: 1,788

Education attainment for females 25 years and older:
- No schooling: 147
- Nursery to 4th grade: 46
- 5th and 6th grade: 140
- 7th and 8th grade: 46
- 9th grade: 29
- 10th grade: 91
- 11th grade: 14
- 12th grade, no diploma: 29
- High school graduate (or equivalency): 777
- Less than 1 year of college: 299
- Some college more than 1 year, no degree: 761
- Associate degree: 516
- Bachelor's degree: 3,440
- Master's degree: 3,362
- Professional school degree: 802
- Doctorate degree: 953


Housing units in structures:
- One, detached: 7,218
- One, attached: 1,052
- Two: 251
- 3 or 4: 890
- 5 to 9: 878
- 10 to 19: 884
- 20 to 49: 953
- 50 or more: 1,094
- Mobile homes: 26
- Boats, RVs, vans, etc.: 10
Housing units lacking complete kitchen facilities in 2022: 1.4%
House/condo owner moved in on average 16 years ago
Renter moved in on average 1 years ago

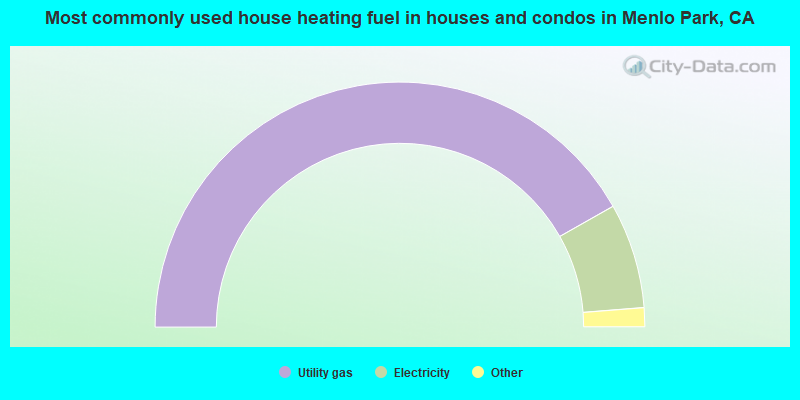
- 83.6%Utility gas
- 13.9%Electricity
- 1.4%Bottled, tank, or LP gas
- 1.0%Solar energy
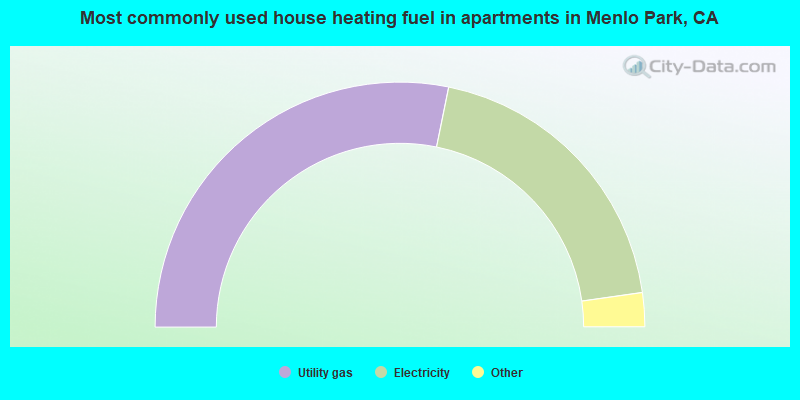
- 56.4%Utility gas
- 39.1%Electricity
- 2.9%Bottled, tank, or LP gas
- 0.9%Fuel oil, kerosene, etc.
- 0.7%No fuel used
Private vs. public school enrollment:
| Here: | 17.8% |
| California: | 10.5% |
| Here: | 17.2% |
| California: | 8.5% |
| Here: | 23.3% |
| California: | 15.9% |


