Mentor, OH (Ohio) Houses and Residents
| Mentor: | $237,209 |
| Ohio: | $204,100 |
Mean price in 2022:
Detached houses: $284,594
Here: $284,594 State: $254,366 Townhouses or other attached units: $210,145
Here: $210,145 State: $225,733 In 2-unit structures: $153,409
Here: $153,409 State: $144,384 In 3-to-4-unit structures: $126,280
Here: $126,280 State: $203,002 In 5-or-more-unit structures: $215,107
Here: $215,107 State: $211,593 Mobile homes: $35,831
Here: $35,831 State: $62,719
Total population: 46,870 (All urban)
Houses: 20,778 (19,886 occupied: 16,638 owner occupied, 3,359 renter occupied)
| % of renters here: | 17% |
| State: | 33% |
Housing density: 776 houses/condos per square mile
Median price asked for vacant for-sale houses and condos in 2022: $131,990.
Median contract rent in 2022: $1,006 (lower quartile is $845, upper quartile is $1,159)
Median rent asked for vacant for-rent units in 2022: $1,948
Median gross rent in Mentor, OH in 2022: $1,081
Housing units in Mentor with a mortgage: 10,069 (1,016 second mortgage, 0 home equity loan, 900 both second mortgage and home equity loan)
Houses without a mortgage: 715
Median household income for houses/condos with a mortgage: $107,262
Median household income for apartments without a mortgage: $60,782
Median monthly housing costs: $1,043
Compare current foreclosures in Mentor, OH:
| Photo | Address | Area | Beds / Baths | Price | Details |
|---|---|---|---|---|---|

|
#1
Southgrove Rd
Mentor, OH 44060
|
1,219 sq. feet
|
1 baths 3 beds |
show details | |

|
#2
Primrose Dr
Mentor, OH 44060
|
1,232 sq. feet
|
1 baths 3 beds |
show details | |

|
#3
Southland Dr
Mentor, OH 44060
|
1,170 sq. feet
|
1 baths 3 beds |
show details | |

|
#4
Ohio St
Mentor, OH 44060
|
1,916 sq. feet
|
2 baths 4 beds |
show details | |

|
#5
Bluejay Ln
Mentor, OH 44060
|
2,562 sq. feet
|
2 baths 4 beds |
show details | |

|
#6
Andrea Dr
Mentor, OH 44060
|
1,428 sq. feet
|
2 baths 2 beds |
show details | |

|
#7
Cambridge Park Dr
Mentor, OH 44060
|
2,276 sq. feet
|
1 baths 3 beds |
show details | |

|
#8
N Chestnut Commons D E
Mentor, OH 44060
|
1,240 sq. feet
|
1 baths 2 beds |
show details | |

|
#9
Marine Pkwy
Mentor, OH 44060
|
1,437 sq. feet
|
1 baths 3 beds |
show details | |

|
#10
Fern Dr
Mentor, OH 44060
|
1,360 sq. feet
|
1 baths 3 beds |
show details |
| Photo | Address | Area | Beds / Baths | Price | Details |
|---|---|---|---|---|---|

|
#11
Rosemary Ln
Mentor, OH 44060
|
952 sq. feet
|
1 baths 3 beds |
show details | |

|
#12
Westmoor Rd
Mentor, OH 44060
|
1,470 sq. feet
|
2 baths 3 beds |
show details | |

|
#13
Shamrock Dr
Mentor, OH 44060
|
1,104 sq. feet
|
1 baths 3 beds |
show details | |

|
#14
Fairfax Dr
Mentor, OH 44060
|
1,812 sq. feet
|
1 baths 3 beds |
show details | |

|
#15
Cedarwood Rd
Mentor, OH 44060
|
1,544 sq. feet
|
2 baths 3 beds |
show details | |

|
#16
N Chestnut Commons Dr # H
Mentor, OH 44060
|
1,240 sq. feet
|
2 baths 2 beds |
show details | |

|
#17
Marine Pkwy
Mentor, OH 44060
|
1,390 sq. feet
|
1 baths 3 beds |
show details | |

|
#18
Burridge Ave
Mentor, OH 44060
|
1,164 sq. feet
|
1 baths 3 beds |
show details | |

|
#19
Springwood Dr
Mentor, OH 44060
|
1,498 sq. feet
|
2 baths 3 beds |
show details | |

|
#20
Marine Pkwy
Mentor, OH 44060
|
1,518 sq. feet
|
1 baths 3 beds |
show details |
| Photo | Address | Area | Beds / Baths | Price | Details |
|---|---|---|---|---|---|

|
#21
Edgewood Rd
Mentor, OH 44060
|
3,822 sq. feet
|
2 baths 4 beds |
show details | |

|
#22
Demshar Dr
Mentor, OH 44060
|
2,491 sq. feet
|
2 baths 3 beds |
show details | |

|
#23
Jordan Dr
Mentor, OH 44060
|
924 sq. feet
|
1 baths 3 beds |
show details | |

|
#24
Brooks Blvd
Mentor, OH 44060
|
1,426 sq. feet
|
1 baths 3 beds |
show details | |

|
#25
First St
Mentor, OH 44060
|
1,200 sq. feet
|
2 baths 3 beds |
show details | |

|
#26
Willowbrook Dr
Mentor, OH 44060
|
1,277 sq. feet
|
1 baths 3 beds |
show details | |

|
#27
Bellflower Ct
Mentor, OH 44060
|
1,064 sq. feet
|
1 baths 2 beds |
show details | |

|
#28
Hopkins Rd
Mentor, OH 44060
|
1,912 sq. feet
|
2 baths 4 beds |
show details | |

|
#29
Mentor Park Blvd
Mentor, OH 44060
|
1,754 sq. feet
|
2 baths 3 beds |
show details | |

|
#30
Fern Dr
Mentor, OH 44060
|
1,068 sq. feet
|
1 baths 3 beds |
show details |
| Photo | Address | Area | Beds / Baths | Price | Details |
|---|---|---|---|---|---|

|
#31
Rockwell Ct
Mentor, OH 44060
|
2,016 sq. feet
|
2 baths 4 beds |
show details | |

|
#32
Wake Robin Rd
Mentor, OH 44060
|
1,026 sq. feet
|
1 baths 3 beds |
show details | |

|
#33
Essex Dr
Mentor, OH 44060
|
1,200 sq. feet
|
1 baths 3 beds |
show details | |

|
#34
Suwanee Dr
Mentor, OH 44060
|
1,400 sq. feet
|
1 baths 3 beds |
show details | |

|
#35
Goldenrod Dr
Mentor, OH 44060
|
1,372 sq. feet
|
1 baths 3 beds |
show details | |

|
#36
Belle Meadow Rd
Mentor, OH 44060
|
696 sq. feet
|
1 baths 2 beds |
show details | |

|
#37
Eastmoor Rd
Mentor, OH 44060
|
1,105 sq. feet
|
1 baths 3 beds |
show details | |

|
#38
Meadowlawn Dr Unit 11
Mentor, OH 44060
|
1,342 sq. feet
|
1 baths 3 beds |
show details | |

|
#39
Brentwood Rd
Mentor, OH 44060
|
2,278 sq. feet
|
1 baths 3 beds |
show details | |

|
#40
Melshore Dr
Mentor, OH 44060
|
1,488 sq. feet
|
1 baths 3 beds |
show details |
| Photo | Address | Area | Beds / Baths | Price | Details |
|---|---|---|---|---|---|

|
#41
Clearair Dr
Mentor, OH 44060
|
1,026 sq. feet
|
1 baths 2 beds |
show details | |

|
#42
Shamrock Dr
Mentor, OH 44060
|
1,218 sq. feet
|
1 baths 2 beds |
show details | |

|
#43
Sanctuary Dr
Mentor, OH 44060
|
4,910 sq. feet
|
3 baths 4 beds |
show details | |

|
#44
Southland Dr
Mentor, OH 44060
|
1,540 sq. feet
|
1 baths 3 beds |
show details | |

|
#45
Old Johnnycake Ridge Rd
Mentor, OH 44060
|
996 sq. feet
|
1 baths 3 beds |
show details | |

|
#46
Rosemary Ln
Mentor, OH 44060
|
952 sq. feet
|
1 baths 3 beds |
show details | |

|
#47
Luoem Trl
Mentor, OH 44060
|
1,660 sq. feet
|
2 baths 4 beds |
show details | |

|
#48
Executive Ct
Mentor, OH 44060
|
2,846 sq. feet
|
3 baths 1 beds |
show details | |

|
#49
Fairfax Dr
Mentor, OH 44060
|
1,516 sq. feet
|
1 baths 3 beds |
show details | |

|
Check over 1 million property listings on Foreclosure.com!
|
browse all offers | |||

Latest news about housing in Mentor, OH collected exclusively by city-data.com from local newspapers, TV, and radio stations

 | Furnished apartments in Cleveland for temporary relocation? (16 replies) |
| safe, lively, convenient areas of Cle that have single family homes. (11 replies) |
| Cleveland's Real Estate Market is driving us crazy. (24 replies) |
| Rental homes in Mentor? (1 reply) |
| Cleveland Homecoming-Fall 2021 (30 replies) |
| Buying a house between Akron and Mentor (58 replies) |

Median year apartment built: 1976
Household type by relationship:
Households: 47,221- Male householders: 9,756 (2,521 living alone), Female householders: 9,891 (3,173 living alone)
10,447 spouses (10,378 opposite-sex spouses), 1,132 unmarried partners, (946 opposite-sex unmarried partners), 13,013 children (12,007 natural, 167 adopted, 838 stepchildren), 658 grandchildren, 297 brothers or sisters, 380 parents, 29 foster children, 448 other relatives, 809 non-relatives
- In group quarters: 356
Size of family households: 6,208 2-persons, 2,452 3-persons, 2,218 4-persons, 1,070 5-persons, 490 6-persons, 132 7-or-more-persons.
Size of nonfamily households: 6,154 1-person, 953 2-persons, 103 3-persons, 34 4-persons.
7,215 married couples with children.
1,337 single-parent households (367 men, 970 women).
91.7% of residents of Mentor speak English at home.
1.6% of residents speak Spanish at home (74% speak English very well, 10% speak English well, 15% speak English not well, 2% don't speak English at all).
5.9% of residents speak other Indo-European language at home (63% speak English very well, 28% speak English well, 9% speak English not well, 1% don't speak English at all).
1.3% of residents speak Asian or Pacific Island language at home (29% speak English very well, 18% speak English well, 49% speak English not well, 4% don't speak English at all).
0.1% of residents speak other language at home (37% speak English very well, 18% speak English well, 33% speak English not well, 12% don't speak English at all).
Foreign born population: 2,370 (5.0%)
(85.8% of them are naturalized citizens)
| Here: | 6.8 |
| State: | 6.7 |
| Here: | 5.0 |
| State: | 4.4 |

- Bedrooms in owner-occupied houses and condos in Mentor, Ohio
- 0no bedroom
- 1071 bedroom
- 2,0232 bedrooms
- 8,5853 bedrooms
- 5,1454 bedrooms
- 7795+ bedrooms

- Bedrooms in renter-occupied apartments in Mentor, Ohio
- 164no bedroom
- 5161 bedroom
- 1,2232 bedrooms
- 1,2073 bedrooms
- 1524 bedrooms
- 975+ bedrooms

- Cars and other vehicles available in Mentor in owner-occupied houses/condos
- 354no vehicle
- 4,5841 vehicle
- 7,9352 vehicles
- 2,5873 vehicles
- 9684 vehicles
- 2115+ vehicles

- Cars and other vehicles available in Mentor in renter-occupied apartments
- 313no vehicle
- 1,9811 vehicle
- 6372 vehicles
- 3373 vehicles
- 824 vehicles
- 85+ vehicles

- Rooms in owner-occupied houses in Mentor, Ohio
- 01 room
- 02 rooms
- 3023 rooms
- 7344 rooms
- 2,5115 rooms
- 3,4616 rooms
- 2,8507 rooms
- 2,8248 rooms
- 3,9589+ rooms

- Rooms in renter-occupied apartments in Mentor, Ohio
- 1641 room
- 1452 rooms
- 2953 rooms
- 5544 rooms
- 8915 rooms
- 5356 rooms
- 4297 rooms
- 1358 rooms
- 2119+ rooms


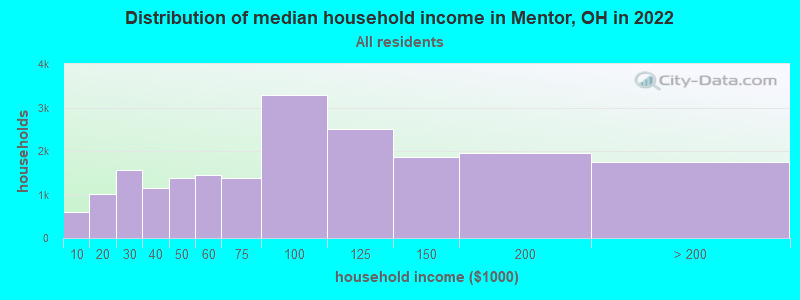
Mentor, OH household income distribution

- 593Less than $10,000
- 1,009$10,000 to $19,999
- 1,567$20,000 to $29,999
- 1,141$30,000 to $39,999
- 1,386$40,000 to $49,999
- 1,449$50,000 to $59,999
- 1,378$60,000 to $74,999
- 3,281$75,000 to $99,999
- 2,514$100,000 to $124,999
- 1,869$125,000 to $149,999
- 1,945$150,000 to $199,999
- 1,748$200,000 or more
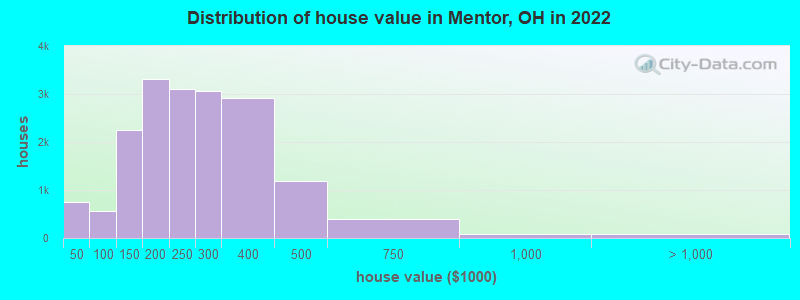
Home value of owner - occupied houses in 2022 in Mentor, OH
-
- 89Less than $10,000
- 235$10,000 to $14,999
- 121$15,000 to $19,999
- 80$20,000 to $24,999
- 120$25,000 to $29,999
- 49$30,000 to $34,999
- 60$40,000 to $49,999
- 4$50,000 to $59,999
- 10$60,000 to $69,999
- 62$70,000 to $79,999
- 244$80,000 to $89,999
- 184$90,000 to $99,999
- 1,034$100,000 to $124,999
- 1,211$125,000 to $149,999
- 1,648$150,000 to $174,999
- 1,666$175,000 to $199,999
- 3,105$200,000 to $249,999
- 3,056$250,000 to $299,999
- 2,925$300,000 to $399,999
- 1,192$400,000 to $499,999
- 400$500,000 to $749,999
- 89$750,000 to $999,999
- 10$1,000,000 to $1,499,999
- 50$1,500,000 to $1,999,999
- 26$2,000,000 or more
Rent paid by renters in 2022 in Mentor, OH
-
- 34Less than $100
- 63$300 to $349
- 22$400 to $449
- 3$450 to $499
- 262$550 to $599
- 27$600 to $649
- 83$650 to $699
- 70$700 to $749
- 84$750 to $799
- 353$800 to $899
- 744$900 to $999
- 621$1,000 to $1,249
- 287$1,250 to $1,499
- 171$1,500 to $1,999
- 12$2,000 to $2,499
- 55$3,000 to $3,499
- 183No cash rent


Percentage of workers working in this county: 69.0%
Number of people working at home: 3,559 (14.6% of all workers)
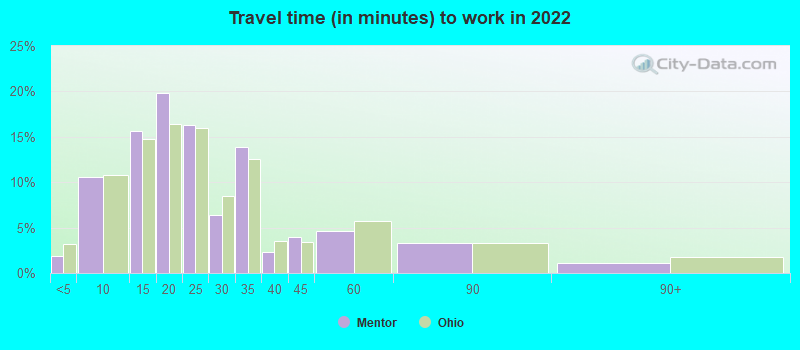
Travel time to work (commute)
- Less than 5 minutes: 325
- 5 to 9 minutes: 2,536
- 10 to 14 minutes: 3,493
- 15 to 19 minutes: 3,682
- 20 to 24 minutes: 3,645
- 25 to 29 minutes: 1,189
- 30 to 34 minutes: 2,156
- 35 to 39 minutes: 890
- 40 to 44 minutes: 782
- 45 to 59 minutes: 1,110
- 60 to 89 minutes: 459
- 90 or more minutes: 413
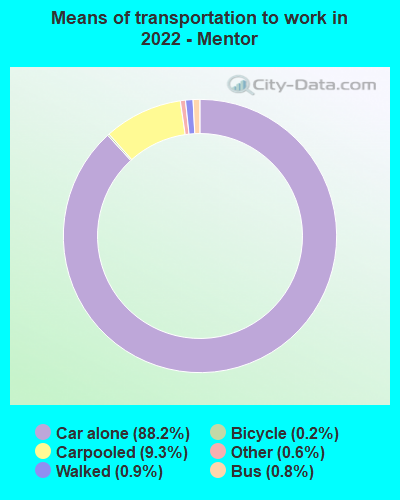
Means of transportation to work:
- Drove a car alone: 29,500 (78.6%)
- Carpooled: 2,833 (7.5%)
- Bus: 229 (0.6%)
- Taxi: 187 (0.5%)
- Bicycle: 118 (0.3%)
- Walked: 290 (0.8%)
- Worked at home: 3,559 (9.5%)

- Unemployment by race in 2022
- Unemployment rate for White non-Hispanic residents
- 2.6%Males
- 1.9%Females
- Unemployment rate for two or more race residents
- 0.5%Males
- Unemployment rate for Hispanic or Latino residents
- 22.1%Males

- Year of entry for the foreign-born population in Mentor, Ohio
- 9632010 or later
- 8232000 to 2009
- 4991990 to 1999
- 2591980 to 1989
- 2451970 to 1979
- 737Before 1970

First ancestries reported:
- German: 2,125 (11.4%)
- Irish: 2,014 (10.8%)
- Italian: 2,005 (10.8%)
- English: 1,314 (7.1%)
- American: 1,300 (7.0%)
- Polish: 977 (5.2%)
- European: 890 (4.8%)
- Croatian: 810 (4.3%)
- Slovene: 733 (3.9%)
- Hungarian: 465 (2.5%)
- Slovak: 425 (2.3%)
- Ukrainian: 392 (2.1%)
- Portuguese: 277 (1.5%)
- Scottish: 271 (1.5%)
- Albanian: 208 (1.1%)
- Scotch-Irish: 180 (1.0%)
- Greek: 120 (0.6%)
- French: 116 (0.6%)
- Finnish: 103 (0.6%)
- Swedish: 82 (0.4%)
- Russian: 63 (0.3%)
- Czech: 62 (0.3%)
- Austrian: 56 (0.3%)
- Lithuanian: 55 (0.3%)
- French Canadian: 53 (0.3%)
- Eastern European: 53 (0.3%)
- Iranian: 51 (0.3%)
- Yugoslavian: 51 (0.3%)
- Dutch: 40 (0.2%)
- British: 37 (0.2%)
- Scandinavian: 28 (0.2%)
- Serbian: 28 (0.2%)
- Czechoslovakian: 25 (0.1%)
- Swiss: 25 (0.1%)
- African: 24 (0.1%)
- Bulgarian: 22 (0.1%)
- Pennsylvania German: 20 (0.1%)
- Lebanese: 18 (0.10%)
- Welsh: 18 (0.10%)
- Armenian: 16 (0.09%)
- Slavic: 12 (0.06%)
- Romanian: 11 (0.06%)
- Norwegian: 10 (0.05%)
- Danish: 8 (0.04%)
- Macedonian: 7 (0.04%)
- Canadian: 6 (0.03%)
- Latvian: 4 (0.02%)
- Jordanian: 3 (0.02%)
- Palestinian: 3 (0.02%)
- South African: 3 (0.02%)
Most common places of birth for foreign-born residents (%):
| Mentor: | 16.9% (513) |
| Ohio: | 11.6% (66,525) |
| Mentor: | 10.5% (317) |
| Ohio: | 0.9% (5,101) |
| Mentor: | 10.0% (302) |
| Ohio: | 0.6% (3,269) |
| Mentor: | 9.1% (277) |
| Ohio: | 1.9% (10,960) |
| Mentor: | 6.8% (207) |
| Ohio: | 1.7% (9,564) |
| Mentor: | 3.2% (98) |
| Ohio: | 2.2% (12,846) |
| Mentor: | 3.1% (93) |
| Ohio: | 0.4% (2,186) |
| Mentor: | 3.0% (92) |
| Ohio: | 0.6% (3,210) |
| Mentor: | 3.0% (91) |
| Ohio: | 0.4% (2,185) |
| Mentor: | 2.5% (77) |
| Ohio: | 0.7% (4,155) |
| Mentor: | 2.5% (75) |
| Ohio: | 0.3% (1,447) |
| Mentor: | 2.2% (66) |
| Ohio: | 1.0% (5,979) |
| Mentor: | 2.0% (62) |
| Ohio: | 3.1% (17,818) |
| Mentor: | 1.7% (52) |
| Ohio: | 0.5% (2,690) |
| Mentor: | 1.6% (48) |
| Ohio: | 0.7% (4,187) |
Place of birth for U.S.-born residents:
- This state: 36,175
- Other state: 8,310
- Northeast: 3,521
- Midwest: 1,751
- South: 1,941
- West: 1,173
92.8% of Mentor residents lived in the same house 1 years ago.
Out of people who lived in different houses, 37.8% lived in this county.
Out of people who lived in different counties, 79.2% lived in Ohio.
| Mentor: | 92.8% |
| State average: | 87.8% |
Education attainment for males 25 years and older:
- No schooling: 31
- Nursery to 4th grade: 46
- 5th and 6th grade: 25
- 7th and 8th grade: 154
- 9th grade: 103
- 10th grade: 178
- 11th grade: 193
- 12th grade, no diploma: 457
- High school graduate (or equivalency): 5,256
- Less than 1 year of college: 1,361
- Some college more than 1 year, no degree: 2,109
- Associate degree: 1,228
- Bachelor's degree: 3,599
- Master's degree: 1,561
- Professional school degree: 249
- Doctorate degree: 163

Education attainment for females 25 years and older:
- No schooling: 82
- Nursery to 4th grade: 8
- 5th and 6th grade: 11
- 7th and 8th grade: 89
- 9th grade: 17
- 10th grade: 63
- 11th grade: 185
- 12th grade, no diploma: 173
- High school graduate (or equivalency): 5,095
- Less than 1 year of college: 1,341
- Some college more than 1 year, no degree: 2,101
- Associate degree: 1,973
- Bachelor's degree: 4,477
- Master's degree: 2,005
- Professional school degree: 275
- Doctorate degree: 132


Housing units in structures:
- One, detached: 15,775
- One, attached: 1,549
- Two: 279
- 3 or 4: 503
- 5 to 9: 837
- 10 to 19: 747
- 20 to 49: 156
- 50 or more: 552
- Mobile homes: 374
Median worth of mobile homes: $17,417
Housing units lacking complete kitchen facilities in 2022: 2.2%
House/condo owner moved in on average 15 years ago
Renter moved in on average 3 years ago

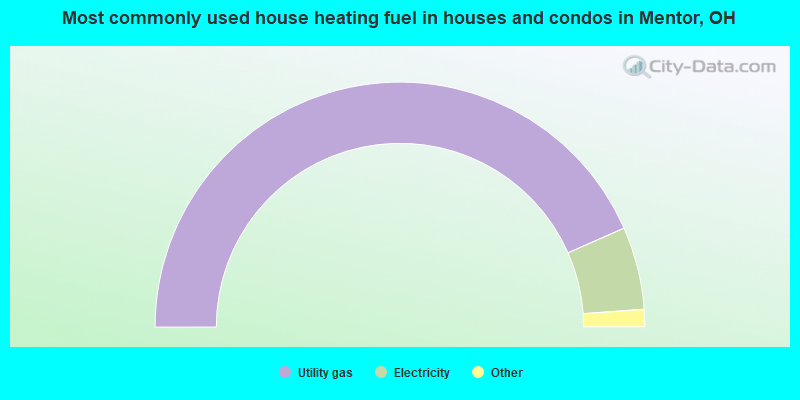
- 86.8%Utility gas
- 10.9%Electricity
- 1.2%Fuel oil, kerosene, etc.
- 0.7%Bottled, tank, or LP gas
- 0.3%Wood
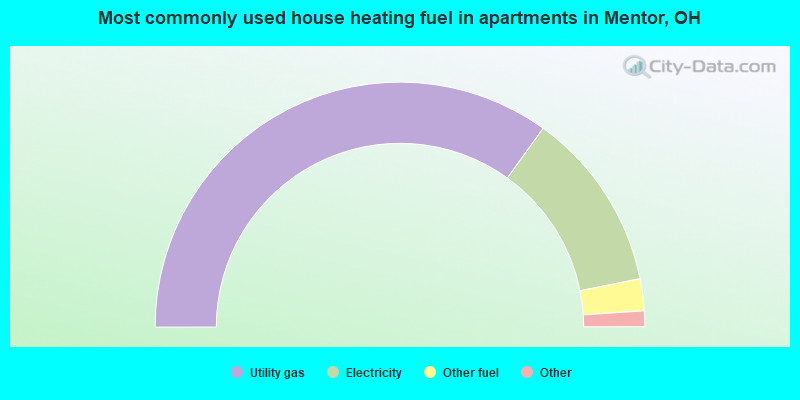
- 69.9%Utility gas
- 23.8%Electricity
- 4.2%Other fuel
- 1.6%Wood
- 0.3%No fuel used
- 0.2%Bottled, tank, or LP gas
Private vs. public school enrollment:
| Here: | 23.0% |
| Ohio: | 16.0% |
| Here: | 9.2% |
| Ohio: | 13.1% |
| Here: | 40.8% |
| Ohio: | 22.3% |


