Mesquite, TX (Texas) Houses and Residents
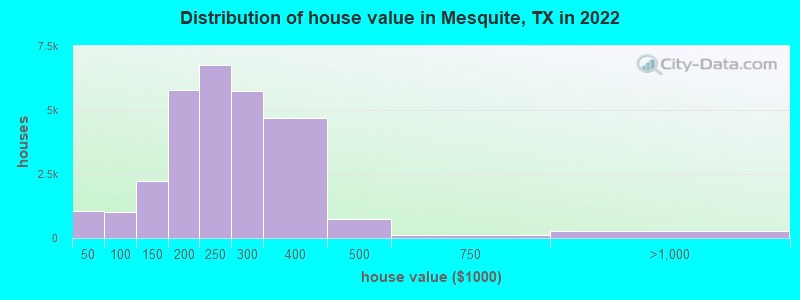
| Mesquite: | $266,100 |
| Texas: | $275,400 |
Mean price in 2022:
Detached houses: $214,087
Here: $214,087 State: $369,058 Townhouses or other attached units: $209,180
Here: $209,180 State: $327,631 In 2-unit structures: $98,278
Here: $98,278 State: $374,947 In 3-to-4-unit structures: $159,933
Here: $159,933 State: $209,652 In 5-or-more-unit structures: $284,268
Here: $284,268 State: $413,944 Mobile homes: $70,556
Here: $70,556 State: $124,413
Total population: 144,416 (Urban population: 123,904, Rural population: 674 (21 farm, 653 nonfarm))
Houses: 53,868 (51,052 occupied: 29,658 owner occupied, 21,394 renter occupied)
| % of renters here: | 42% |
| State: | 38% |
Housing density: 1,241 houses/condos per square mile
Median price asked for vacant for-sale houses and condos in 2022: $197,478.
Median contract rent in 2022: $1,156 (lower quartile is $989, upper quartile is $1,446)
Median rent asked for vacant for-rent units in 2022: $960
Median gross rent in Mesquite, TX in 2022: $1,347
Housing units in Mesquite with a mortgage: 18,698 (1,763 second mortgage, 380 home equity loan, 751 both second mortgage and home equity loan)
Houses without a mortgage: 457
Median household income for houses/condos with a mortgage: $95,960
Median household income for apartments without a mortgage: $64,521
Median monthly housing costs: $1,354
Compare current foreclosures in Mesquite, TX:
| Photo | Address | Area | Beds / Baths | Price | Details |
|---|---|---|---|---|---|

|
#1
Big Bend Dr
Mesquite, TX 75150
|
1,931 sq. feet
|
2 baths 3 beds |
show details | |

|
#2
Big Thicket Trl
Mesquite, TX 75149
|
1,731 sq. feet
|
2 baths 4 beds |
show details | |

|
#3
Rosemont St
Mesquite, TX 75149
|
1,133 sq. feet
|
1 baths 2 beds |
show details | |

|
#4
E Kimbrough St
Mesquite, TX 75149
|
2,226 sq. feet
|
1 baths 3 beds |
show details | |

|
#5
Woodthorpe Dr
Mesquite, TX 75181
|
3,205 sq. feet
|
2 baths 4 beds |
show details | |

|
#6
Emerald Dr
Mesquite, TX 75150
|
1,853 sq. feet
|
2 baths 3 beds |
show details | |

|
#7
Kim Ln
Mesquite, TX 75149
|
1,371 sq. feet
|
2 baths 3 beds |
show details | |

|
#8
Susan Dr
Mesquite, TX 75150
|
1,493 sq. feet
|
1 baths 3 beds |
show details | |

|
#9
Oleander Trl
Mesquite, TX 75150
|
2,315 sq. feet
|
1 baths 3 beds |
show details | |

|
#10
S Galloway Ave
Mesquite, TX 75149
|
1,906 sq. feet
|
2 baths 3 beds |
show details |
| Photo | Address | Area | Beds / Baths | Price | Details |
|---|---|---|---|---|---|

|
#11
Rivercrest Dr
Mesquite, TX 75181
|
2,313 sq. feet
|
2 baths 4 beds |
show details | |

|
#12
La Prada Dr
Mesquite, TX 75150
|
2,621 sq. feet
|
2 baths 3 beds |
show details | |

|
#13
Parkwood Trl
Mesquite, TX 75149
|
1,797 sq. feet
|
2 baths 3 beds |
show details | |

|
#14
Regent St
Mesquite, TX 75149
|
1,862 sq. feet
|
2 baths 3 beds |
show details | |

|
#15
Via Sevilla
Mesquite, TX 75150
|
2,309 sq. feet
|
2 baths 4 beds |
show details | |

|
#16
Ripplewood Dr
Mesquite, TX 75150
|
1,512 sq. feet
|
2 baths 3 beds |
show details | |

|
#17
Jills Dr
Mesquite, TX 75180
|
1,060 sq. feet
|
1 baths 3 beds |
show details | |

|
#18
Robinlynn St
Mesquite, TX 75149
|
2,079 sq. feet
|
3 baths 4 beds |
show details | |

|
#19
Helen Ln
Mesquite, TX 75181
|
1,360 sq. feet
|
2 baths 3 beds |
show details | |

|
#20
Cochise Dr
Mesquite, TX 75180
|
1,269 sq. feet
|
2 baths 3 beds |
show details |
| Photo | Address | Area | Beds / Baths | Price | Details |
|---|---|---|---|---|---|

|
#21
Wheatfield Dr
Mesquite, TX 75149
|
1,145 sq. feet
|
2 baths 3 beds |
show details | |

|
#22
Springmont Dr
Mesquite, TX 75181
|
2,353 sq. feet
|
1 baths 4 beds |
show details | |

|
#23
Monarch Dr
Mesquite, TX 75181
|
2,891 sq. feet
|
2 baths 4 beds |
show details | |

|
#24
Wheatfield Dr
Mesquite, TX 75149
|
1,184 sq. feet
|
2 baths 3 beds |
show details | |

|
#25
Oriole St
Mesquite, TX 75149
|
2,315 sq. feet
|
2 baths 3 beds |
show details | |

|
#26
Seedling Ln
Mesquite, TX 75150
|
2,181 sq. feet
|
2 baths 3 beds |
show details | |

|
#27
Turtle Dove Ln
Mesquite, TX 75181
|
1,974 sq. feet
|
2 baths 4 beds |
show details | |

|
#28
Wellington Dr
Mesquite, TX 75149
|
1,702 sq. feet
|
2 baths 3 beds |
show details | |

|
#29
Saddlehorn Dr
Mesquite, TX 75181
|
2,650 sq. feet
|
2 baths 4 beds |
show details | |

|
#30
Creekside Dr
Mesquite, TX 75181
|
1,565 sq. feet
|
2 baths 3 beds |
show details |
| Photo | Address | Area | Beds / Baths | Price | Details |
|---|---|---|---|---|---|

|
#31
Sarazen Dr
Mesquite, TX 75150
|
1,128 sq. feet
|
1 baths 3 beds |
show details | |

|
#32
Edith Dr
Mesquite, TX 75149
|
1,328 sq. feet
|
2 baths 3 beds |
show details | |

|
#33
Brownfield Dr
Mesquite, TX 75150
|
1,812 sq. feet
|
2 baths 4 beds |
show details | |

|
#34
Clary Dr
Mesquite, TX 75149
|
1,398 sq. feet
|
2 baths 3 beds |
show details | |

|
#35
Belhaven Dr
Mesquite, TX 75150
|
1,632 sq. feet
|
2 baths 5 beds |
show details | |

|
#36
Benwynd Dr
Mesquite, TX 75149
|
1,490 sq. feet
|
2 baths 3 beds |
show details | |

|
#37
Liberty Ln
Mesquite, TX 75149
|
1,672 sq. feet
|
2 baths 3 beds |
show details | |

|
#38
Cedarcrest Cir
Mesquite, TX 75149
|
1,795 sq. feet
|
2 baths 3 beds |
show details | |

|
#39
Oxbow St
Mesquite, TX 75149
|
1,213 sq. feet
|
2 baths 3 beds |
show details | |

|
#40
Lometa Ct
Mesquite, TX 75181
|
4,310 sq. feet
|
4 baths 5 beds |
show details |
| Photo | Address | Area | Beds / Baths | Price | Details |
|---|---|---|---|---|---|

|
#41
Byrd Dr
Mesquite, TX 75150
|
1,650 sq. feet
|
1 baths 3 beds |
show details | |

|
#42
Alta Vista St
Mesquite, TX 75149
|
1,192 sq. feet
|
1 baths 3 beds |
show details | |

|
#43
Emerald Dr
Mesquite, TX 75150
|
1,153 sq. feet
|
2 baths 3 beds |
show details | |

|
#44
Marsha Dr
Mesquite, TX 75180
|
1,190 sq. feet
|
1 baths 3 beds |
show details | |

|
#45
Green Valley Dr
Mesquite, TX 75180
|
1,492 sq. feet
|
2 baths 4 beds |
show details | |

|
#46
Pioneer Rd
Mesquite, TX 75180
|
1,494 sq. feet
|
2 baths 3 beds |
show details | |

|
#47
Shands Dr
Mesquite, TX 75150
|
1,623 sq. feet
|
2 baths 3 beds |
show details | |

|
#48
Red Mill Ln
Mesquite, TX 75149
|
1,235 sq. feet
|
2 baths 3 beds |
show details | |

|
#49
Shands Dr
Mesquite, TX 75150
|
1,874 sq. feet
|
2 baths 3 beds |
show details | |

|
Check over 1 million property listings on Foreclosure.com!
|
browse all offers | |||

Latest news about housing in Mesquite, TX collected exclusively by city-data.com from local newspapers, TV, and radio stations


Median year apartment built: 1984
Household type by relationship:
Households: 147,723- Male householders: 25,022 (5,389 living alone), Female householders: 26,030 (7,224 living alone)
21,941 spouses (21,862 opposite-sex spouses), 5,014 unmarried partners, (4,757 opposite-sex unmarried partners), 49,337 children (47,446 natural, 451 adopted, 1,440 stepchildren), 7,847 grandchildren, 1,901 brothers or sisters, 1,999 parents, 0 foster children, 5,680 other relatives, 2,435 non-relatives
- In group quarters: 517
Size of family households: 11,498 2-persons, 8,542 3-persons, 8,075 4-persons, 4,291 5-persons, 2,111 6-persons, 1,422 7-or-more-persons.
Size of nonfamily households: 12,613 1-person, 2,456 2-persons, 44 3-persons.
20,334 married couples with children.
14,424 single-parent households (2,009 men, 12,415 women).
59.4% of residents of Mesquite speak English at home.
36.6% of residents speak Spanish at home (63% speak English very well, 18% speak English well, 13% speak English not well, 7% don't speak English at all).
0.7% of residents speak other Indo-European language at home (70% speak English very well, 17% speak English well, 13% speak English not well).
2.0% of residents speak Asian or Pacific Island language at home (62% speak English very well, 25% speak English well, 13% speak English not well).
1.5% of residents speak other language at home (88% speak English very well, 10% speak English well, 2% speak English not well).
Foreign born population: 26,933 (18.2%)
(39.6% of them are naturalized citizens)
| Here: | 6.3 |
| State: | 6.3 |
| Here: | 4.5 |
| State: | 4.0 |

- Bedrooms in owner-occupied houses and condos in Mesquite, Texas
- 682no bedroom
- 2621 bedroom
- 1,6072 bedrooms
- 16,1643 bedrooms
- 9,4424 bedrooms
- 1,5015+ bedrooms

- Bedrooms in renter-occupied apartments in Mesquite, Texas
- 1,217no bedroom
- 6,5251 bedroom
- 6,1562 bedrooms
- 6,0283 bedrooms
- 1,4304 bedrooms
- 385+ bedrooms

- Cars and other vehicles available in Mesquite in owner-occupied houses/condos
- 686no vehicle
- 6,0011 vehicle
- 13,4372 vehicles
- 5,6123 vehicles
- 3,3614 vehicles
- 5615+ vehicles

- Cars and other vehicles available in Mesquite in renter-occupied apartments
- 2,916no vehicle
- 8,1341 vehicle
- 7,6882 vehicles
- 1,0613 vehicles
- 1,3724 vehicles
- 2235+ vehicles

- Rooms in owner-occupied houses in Mesquite, Texas
- 01 room
- 02 rooms
- 1,2143 rooms
- 2,1994 rooms
- 5,9365 rooms
- 7,0306 rooms
- 4,8267 rooms
- 4,2368 rooms
- 4,2179+ rooms

- Rooms in renter-occupied apartments in Mesquite, Texas
- 1,2171 room
- 1,3692 rooms
- 3,3953 rooms
- 4,6064 rooms
- 5,3075 rooms
- 2,4116 rooms
- 2,4697 rooms
- 3388 rooms
- 2829+ rooms


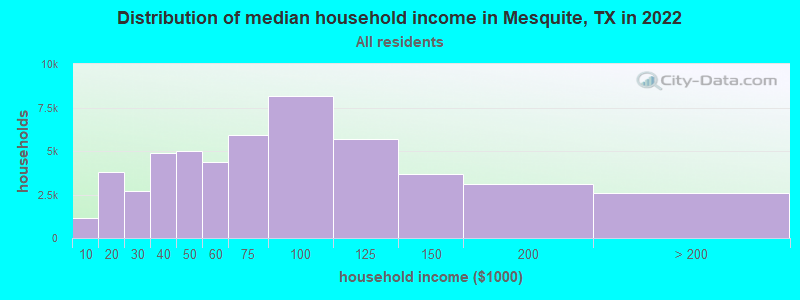
Mesquite, TX household income distribution

- 1,152Less than $10,000
- 3,806$10,000 to $19,999
- 2,688$20,000 to $29,999
- 4,884$30,000 to $39,999
- 4,995$40,000 to $49,999
- 4,355$50,000 to $59,999
- 5,912$60,000 to $74,999
- 8,180$75,000 to $99,999
- 5,689$100,000 to $124,999
- 3,687$125,000 to $149,999
- 3,124$150,000 to $199,999
- 2,580$200,000 or more
Home value of owner - occupied houses in 2022 in Mesquite, TX
-
- 230Less than $10,000
- 80$10,000 to $14,999
- 113$15,000 to $19,999
- 190$20,000 to $24,999
- 226$25,000 to $29,999
- 65$30,000 to $34,999
- 37$35,000 to $39,999
- 94$40,000 to $49,999
- 94$50,000 to $59,999
- 176$60,000 to $69,999
- 101$70,000 to $79,999
- 367$80,000 to $89,999
- 180$90,000 to $99,999
- 1,207$100,000 to $124,999
- 1,031$125,000 to $149,999
- 2,771$150,000 to $174,999
- 3,009$175,000 to $199,999
- 6,740$200,000 to $249,999
- 5,744$250,000 to $299,999
- 4,686$300,000 to $399,999
- 757$400,000 to $499,999
- 121$500,000 to $749,999
- 187$750,000 to $999,999
- 14$1,000,000 to $1,499,999
- 38$1,500,000 to $1,999,999
- 36$2,000,000 or more
Rent paid by renters in 2022 in Mesquite, TX
-
- 47$100 to $149
- 178$150 to $199
- 215$200 to $249
- 67$250 to $299
- 127$300 to $349
- 54$350 to $399
- 7$400 to $449
- 200$450 to $499
- 144$500 to $549
- 52$550 to $599
- 102$600 to $649
- 95$650 to $699
- 108$700 to $749
- 352$750 to $799
- 1,273$800 to $899
- 2,335$900 to $999
- 6,100$1,000 to $1,249
- 3,667$1,250 to $1,499
- 3,077$1,500 to $1,999
- 520$2,000 to $2,499
- 53$2,500 to $2,999
- 37$3,000 to $3,499
- 37$3,500 or more
- 499No cash rent

Percentage of workers working in this county: 85.2%
Number of people working at home: 7,320 (9.9% of all workers)
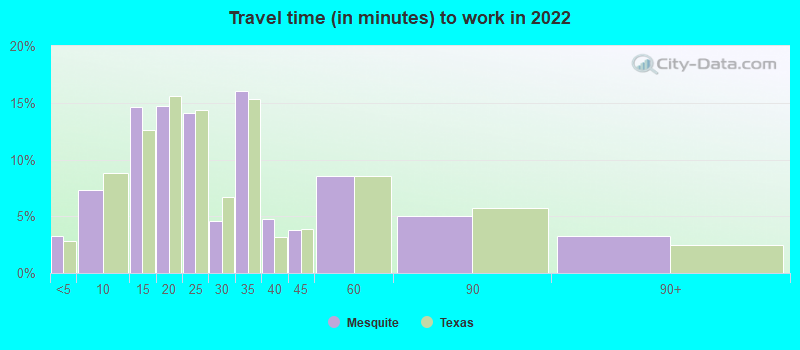
Travel time to work (commute)
- Less than 5 minutes: 1,242
- 5 to 9 minutes: 2,280
- 10 to 14 minutes: 7,058
- 15 to 19 minutes: 7,261
- 20 to 24 minutes: 8,254
- 25 to 29 minutes: 4,432
- 30 to 34 minutes: 9,820
- 35 to 39 minutes: 3,506
- 40 to 44 minutes: 4,673
- 45 to 59 minutes: 10,517
- 60 to 89 minutes: 6,336
- 90 or more minutes: 1,524
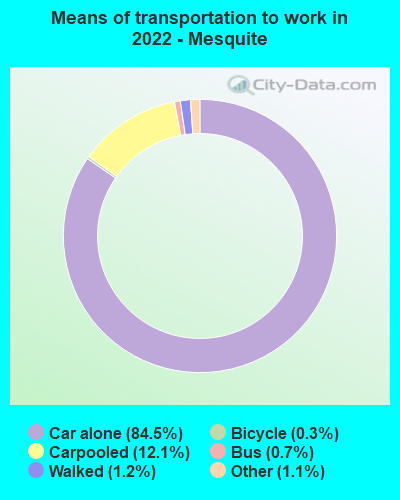
Means of transportation to work:
- Drove a car alone: 34,316 (72.1%)
- Carpooled: 5,033 (10.6%)
- Bus: 171 (0.4%)
- Light rail, streetcar or trolley: 47 (0.1%)
- Taxi: 534 (1.1%)
- Bicycle: 163 (0.3%)
- Walked: 551 (1.2%)
- Worked at home: 7,320 (15.4%)
- Unemployment by race in 2022
- Unemployment rate for White non-Hispanic residents
- 3.1%Males
- 3.8%Females
- Unemployment rate for Black residents
- 12.8%Females
- Unemployment rate for American Indian and Alaska Native residents
- 2.4%Males
- 5.4%Females
- Unemployment rate for Asian residents
- 7.0%Males
- 5.7%Females
- Unemployment rate for other race residents
- 0.9%Males
- 2.0%Females
- Unemployment rate for two or more race residents
- 4.1%Males
- 4.4%Females
- Unemployment rate for Hispanic or Latino residents
- 2.1%Males
- 2.8%Females

- Year of entry for the foreign-born population in Mesquite, Texas
- 6,1422010 or later
- 7,7762000 to 2009
- 8,0371990 to 1999
- 4,1541980 to 1989
- 1,6091970 to 1979
- 775Before 1970

First ancestries reported:
- American: 4,623 (5.1%)
- English: 3,145 (3.5%)
- German: 1,529 (1.7%)
- Irish: 1,429 (1.6%)
- African: 1,227 (1.3%)
- Nigerian: 529 (0.6%)
- British: 413 (0.5%)
- Arab: 335 (0.4%)
- Italian: 334 (0.4%)
- Ugandan: 311 (0.3%)
- European: 293 (0.3%)
- Scotch-Irish: 224 (0.2%)
- Scottish: 207 (0.2%)
- Zimbabwean: 164 (0.2%)
- French: 164 (0.2%)
- Jordanian: 158 (0.2%)
- Norwegian: 158 (0.2%)
- Czech: 141 (0.2%)
- Dutch: 135 (0.1%)
- Sudanese: 118 (0.1%)
- Greek: 94 (0.1%)
- West Indian: 92 (0.1%)
- Welsh: 88 (0.10%)
- Belizean: 69 (0.08%)
- Iranian: 63 (0.07%)
- Jamaican: 63 (0.07%)
- Polish: 58 (0.06%)
- French Canadian: 57 (0.06%)
- Ghanaian: 55 (0.06%)
- Slovene: 53 (0.06%)
- Yugoslavian: 52 (0.06%)
- Russian: 45 (0.05%)
- Turkish: 43 (0.05%)
- Hungarian: 40 (0.04%)
- Egyptian: 38 (0.04%)
- Barbadian: 35 (0.04%)
- Portuguese: 28 (0.03%)
- Swedish: 24 (0.03%)
- Haitian: 22 (0.02%)
- Finnish: 18 (0.02%)
- Belgian: 14 (0.02%)
- Sierra Leonean: 13 (0.01%)
- Slavic: 11 (0.01%)
- Scandinavian: 11 (0.01%)
- Eastern European: 11 (0.01%)
- Czechoslovakian: 9 (0.01%)
- Lebanese: 8 (0.01%)
- Brazilian: 7 (0.01%)
- Swiss: 7 (0.01%)
- Northern European: 5 (0.01%)
Most common places of birth for foreign-born residents (%):
| Mesquite: | 64.6% (19,996) |
| Texas: | 48.4% (2,411,723) |
| Mesquite: | 3.8% (1,172) |
| Texas: | 4.5% (224,455) |
| Mesquite: | 3.4% (1,049) |
| Texas: | 6.1% (306,347) |
| Mesquite: | 2.9% (891) |
| Texas: | 2.1% (103,148) |
| Mesquite: | 2.8% (863) |
| Texas: | 1.3% (62,978) |
| Mesquite: | 2.6% (801) |
| Texas: | 1.8% (87,382) |
| Mesquite: | 2.2% (693) |
| Texas: | 1.9% (96,110) |
| Mesquite: | 2.0% (615) |
| Texas: | 3.0% (147,182) |
Place of birth for U.S.-born residents:
- This state: 92,926
- Other state: 25,990
- Northeast: 3,776
- Midwest: 6,006
- South: 11,085
- West: 5,123
87.5% of Mesquite residents lived in the same house 1 years ago.
Out of people who lived in different houses, 43.1% lived in this county.
Out of people who lived in different counties, 68.4% lived in Texas.
| Mesquite: | 87.5% |
| State average: | 85.7% |
Education attainment for males 25 years and older:
- No schooling: 1,282
- Nursery to 4th grade: 118
- 5th and 6th grade: 1,875
- 7th and 8th grade: 1,238
- 9th grade: 1,573
- 10th grade: 893
- 11th grade: 840
- 12th grade, no diploma: 2,570
- High school graduate (or equivalency): 12,931
- Less than 1 year of college: 3,985
- Some college more than 1 year, no degree: 5,813
- Associate degree: 4,619
- Bachelor's degree: 4,539
- Master's degree: 931
- Professional school degree: 134
- Doctorate degree: 1,607

Education attainment for females 25 years and older:
- No schooling: 1,267
- Nursery to 4th grade: 183
- 5th and 6th grade: 1,172
- 7th and 8th grade: 814
- 9th grade: 1,203
- 10th grade: 807
- 11th grade: 362
- 12th grade, no diploma: 1,273
- High school graduate (or equivalency): 13,750
- Less than 1 year of college: 6,226
- Some college more than 1 year, no degree: 6,641
- Associate degree: 3,612
- Bachelor's degree: 5,567
- Master's degree: 2,927
- Professional school degree: 61
- Doctorate degree: 927


Housing units in structures:
- One, detached: 36,042
- One, attached: 1,378
- Two: 1,099
- 3 or 4: 2,918
- 5 to 9: 2,430
- 10 to 19: 4,928
- 20 to 49: 2,852
- 50 or more: 2,221
Housing units lacking complete kitchen facilities in 2022: 0.4%
House/condo owner moved in on average 12 years ago
Renter moved in on average 2 years ago

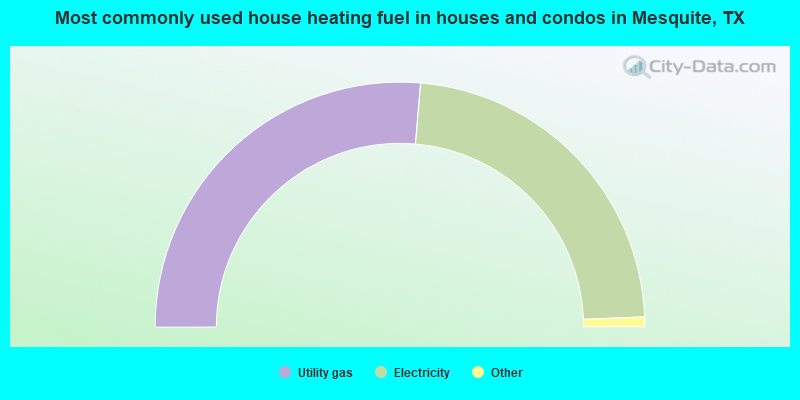
- 52.7%Utility gas
- 46.0%Electricity
- 0.7%Bottled, tank, or LP gas
- 0.3%No fuel used
- 0.2%Solar energy
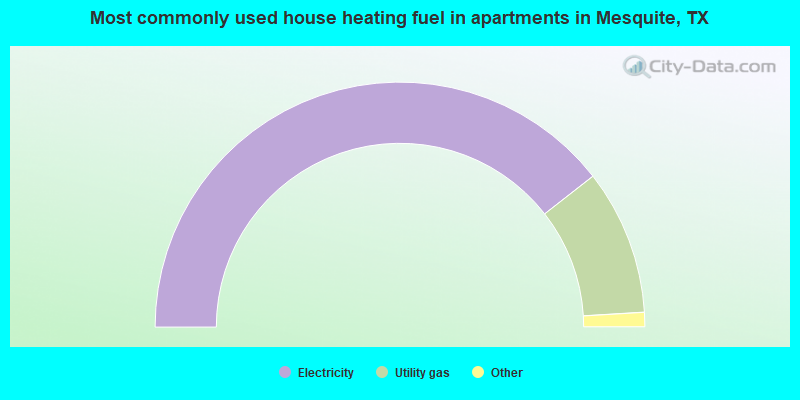
- 78.9%Electricity
- 19.2%Utility gas
- 1.3%Bottled, tank, or LP gas
- 0.3%No fuel used
- 0.1%Wood
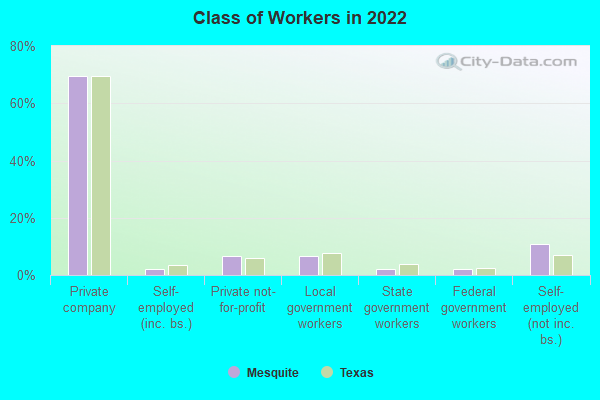
Private vs. public school enrollment:
| Here: | 5.8% |
| Texas: | 8.8% |
| Here: | 6.9% |
| Texas: | 8.0% |
| Here: | 14.4% |
| Texas: | 16.2% |


