Jump to a detailed profile or search site with Google Custom Search

Methuen, MA (Massachusetts) Houses and Residents

Estimated median house or condo value in 2022: $476,857 (it was $156,100 in 2000)
Methuen:

$476,857
Massachusetts:

$534,700
Lower value quartile - upper value quartile: $349,725 - $596,970

Mean price in 2022:

Detached houses: $501,504
Here:

$501,504
State:

$651,570

Townhouses or other attached units: $631,947
Here:

$631,947
State:

$617,749

In 2-unit structures: $479,416
Here:

$479,416
State:

$594,808

In 3-to-4-unit structures: $364,240
Here:

$364,240
State:

$601,912

In 5-or-more-unit structures: $219,071
Here:

$219,071
State:

$555,768

Total population: 49,112 (Urban population: 43,789, Rural population: 0)

Houses: 20,051 (19,230 occupied: 14,271 owner occupied, 5,013 renter occupied)

% of renters here:

26%
State:

38%

Housing density: 895 houses/condos per square mile

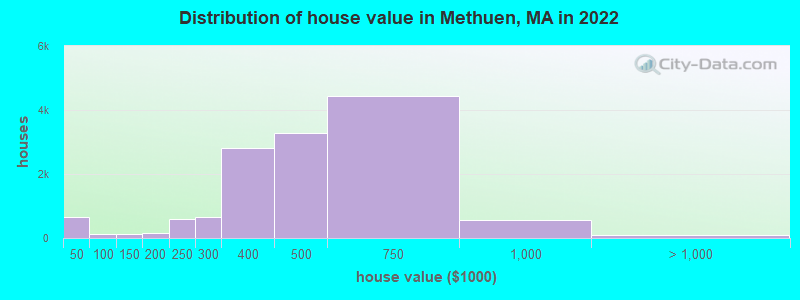
Median price asked for vacant for-sale houses and condos in 2022: $344,614.

Median contract rent in 2022: $1,407 (lower quartile is $681, upper quartile is $1,774)


Median rent asked for vacant for-rent units in 2022: $2,025


Median gross rent in Methuen, MA in 2022: $1,623

Housing units in Methuen with a mortgage: 9,824 (1,207 second mortgage, 45 home equity loan, 1,047 both second mortgage and home equity loan)
Houses without a mortgage: 455

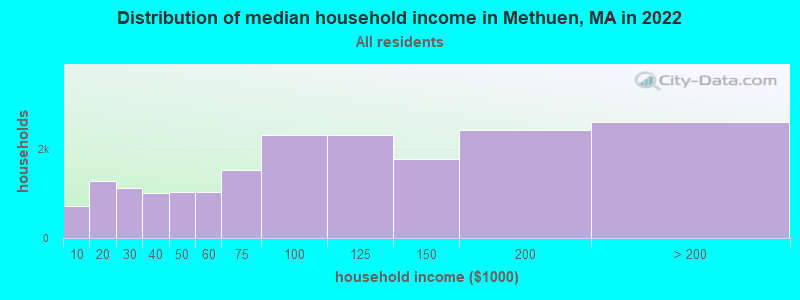
Median household income for houses/condos with a mortgage: $126,479

Median household income for apartments without a mortgage: $81,406

Median monthly housing costs: $1,759

Compare current foreclosures in Methuen, MA:

Check out more offers in Methuen, MA.
Powered by Foreclosure.com


Latest news about housing in Methuen, MA collected exclusively by city-data.com from local newspapers, TV, and radio stations

Methuen, Massachusetts Age and Sex of Residents
Median year house/condo built: 1971

Median year apartment built: 1958

Household type by relationship:

Households: 52,855
  • Male householders: 8,949 (1,620 living alone), Female householders: 10,109 (2,819 living alone)
  • 9,887 spouses (9,753 opposite-sex spouses), 1,474 unmarried partners, (1,394 opposite-sex unmarried partners), 16,922 children (15,715 natural, 450 adopted, 756 stepchildren), 1,308 grandchildren, 629 brothers or sisters, 1,164 parents, 57 foster children, 888 other relatives, 926 non-relatives
  • In group quarters: 537

Size of family households: 4,899 2-persons, 3,340 3-persons, 3,209 4-persons, 1,551 5-persons, 389 6-persons, 197 7-or-more-persons.

Size of nonfamily households: 4,783 1-person, 813 2-persons, 20 3-persons, 6 4-persons.

6,133 married couples with children.
3,455 single-parent households (1,023 men, 2,432 women).

61.6% of residents of Methuen speak English at home.
26.1% of residents speak Spanish at home (61% speak English very well, 16% speak English well, 14% speak English not well, 9% don't speak English at all).
7.1% of residents speak other Indo-European language at home (65% speak English very well, 25% speak English well, 6% speak English not well, 3% don't speak English at all).
1.9% of residents speak Asian or Pacific Island language at home (60% speak English very well, 15% speak English well, 24% speak English not well, 1% don't speak English at all).
3.1% of residents speak other language at home (73% speak English very well, 18% speak English well, 9% speak English not well, 1% don't speak English at all).

Foreign born population: 12,970 (24.5%)
(66.7% of them are naturalized citizens)

Median number of rooms in houses and condos:
Here:

6.4
State:

6.5

Median number of rooms in apartments
Here:

4.1
State:

4.0

Owner-occupied Renter-occupied
Bedrooms in owner-occupied houses and condos in Methuen, Massachusetts
  • Bedrooms in owner-occupied houses and condos in Methuen, Massachusetts
  • 51no bedroom
  • 2701 bedroom
  • 2,9482 bedrooms
  • 7,3913 bedrooms
  • 2,9834 bedrooms
  • 6285+ bedrooms
Bedrooms in renter-occupied apartments in Methuen, Massachusetts
  • Bedrooms in renter-occupied apartments in Methuen, Massachusetts
  • 272no bedroom
  • 1,3891 bedroom
  • 2,0942 bedrooms
  • 9343 bedrooms
  • 2344 bedrooms
  • 905+ bedrooms
Owner-occupied Renter-occupied
Cars and other vehicles available in Methuen in owner-occupied houses/condos
  • Cars and other vehicles available in Methuen in owner-occupied houses/condos
  • 362no vehicle
  • 3,6661 vehicle
  • 5,8882 vehicles
  • 2,7443 vehicles
  • 9974 vehicles
  • 6155+ vehicles
Cars and other vehicles available in Methuen in renter-occupied apartments
  • Cars and other vehicles available in Methuen in renter-occupied apartments
  • 759no vehicle
  • 2,8821 vehicle
  • 1,1042 vehicles
  • 1723 vehicles
  • 864 vehicles
  • 115+ vehicles
Owner-occupied Renter-occupied
Rooms in owner-occupied houses in Methuen, Massachusetts
  • Rooms in owner-occupied houses in Methuen, Massachusetts
  • 511 room
  • 572 rooms
  • 3003 rooms
  • 1,4074 rooms
  • 2,8865 rooms
  • 2,8646 rooms
  • 2,8237 rooms
  • 1,8678 rooms
  • 2,0169+ rooms
Rooms in renter-occupied apartments in Methuen, Massachusetts
  • Rooms in renter-occupied apartments in Methuen, Massachusetts
  • 2581 room
  • 2862 rooms
  • 1,2703 rooms
  • 1,3344 rooms
  • 6745 rooms
  • 7616 rooms
  • 2287 rooms
  • 788 rooms
  • 1269+ rooms
Year house built
Median 2022 house/condo value by year built
Median house/condo value by year householder moved into unit
Breakdown of mean house values by ages of householders
Owners and renters by unit type in Methuen, MA
  • Methuen, MA household income distribution

  • Distribution of median household income in Methuen, MA in 2022
  • 719Less than $10,000
  • 1,289$10,000 to $19,999
  • 1,128$20,000 to $29,999
  • 1,009$30,000 to $39,999
  • 1,046$40,000 to $49,999
  • 1,039$50,000 to $59,999
  • 1,530$60,000 to $74,999
  • 2,337$75,000 to $99,999
  • 2,321$100,000 to $124,999
  • 1,783$125,000 to $149,999
  • 2,438$150,000 to $199,999
  • 2,620$200,000 or more
  • Home value of owner - occupied houses in 2022 in Methuen, MA

  • Distribution of house value in Methuen, MA in 2022
  • 522Less than $10,000
  • 6$15,000 to $19,999
  • 66$25,000 to $29,999
  • 16$30,000 to $34,999
  • 4$35,000 to $39,999
  • 39$40,000 to $49,999
  • 39$50,000 to $59,999
  • 38$60,000 to $69,999
  • 113$100,000 to $124,999
  • 22$125,000 to $149,999
  • 67$150,000 to $174,999
  • 91$175,000 to $199,999
  • 582$200,000 to $249,999
  • 650$250,000 to $299,999
  • 2,801$300,000 to $399,999
  • 3,281$400,000 to $499,999
  • 4,453$500,000 to $749,999
  • 548$750,000 to $999,999
  • 8$1,000,000 to $1,499,999
  • 75$2,000,000 or more
  • Rent paid by renters in 2022 in Methuen, MA

  • Distribution of rent paid by renters in Methuen, MA in 2022
  • 35Less than $100
  • 177$100 to $149
  • 65$150 to $199
  • 40$200 to $249
  • 238$250 to $299
  • 156$300 to $349
  • 83$350 to $399
  • 133$400 to $449
  • 57$450 to $499
  • 3$550 to $599
  • 85$600 to $649
  • 47$650 to $699
  • 25$700 to $749
  • 69$750 to $799
  • 71$800 to $899
  • 74$900 to $999
  • 596$1,000 to $1,249
  • 722$1,250 to $1,499
  • 1,395$1,500 to $1,999
  • 393$2,000 to $2,499
  • 86$2,500 to $2,999
  • 17$3,000 to $3,499
  • 274No cash rent
Time Leaving Home To Go To Work in 2022

Percentage of workers working in this county: 59.6%
Number of people working at home: 3,520 (12.8% of all workers)

Travel time (in minutes) to work in 2022

Travel time to work (commute)

  • Less than 5 minutes: 585
  • 5 to 9 minutes: 1,379
  • 10 to 14 minutes: 3,407
  • 15 to 19 minutes: 4,032
  • 20 to 24 minutes: 3,357
  • 25 to 29 minutes: 1,583
  • 30 to 34 minutes: 2,639
  • 35 to 39 minutes: 771
  • 40 to 44 minutes: 1,184
  • 45 to 59 minutes: 2,566
  • 60 to 89 minutes: 1,430
  • 90 or more minutes: 679
Means of transportation to work in 2022 - Methuen

Means of transportation to work:

  • Drove a car alone: 11,899 (67.3%)
  • Carpooled: 899 (5.1%)
  • Bus: 111 (0.6%)
  • Taxi: 799 (4.5%)
  • Walked: 544 (3.1%)
  • Worked at home: 3,520 (19.9%)
Class of Workers in 2022
  • Unemployment by race in 2022
  • Unemployment rate for White non-Hispanic residents
  • 4.9%Males
  • 2.6%Females
  • Unemployment rate for Asian residents
  • 5.0%Males
  • 1.9%Females
  • Unemployment rate for other race residents
  • 5.0%Males
  • 1.4%Females
  • Unemployment rate for two or more race residents
  • 5.2%Males
  • 6.9%Females
  • Unemployment rate for Hispanic or Latino residents
  • 5.9%Males
  • 2.9%Females
Year of entry for the foreign-born population in Methuen, Massachusetts
  • Year of entry for the foreign-born population in Methuen, Massachusetts
  • 3,3752010 or later
  • 3,5922000 to 2009
  • 2,4981990 to 1999
  • 1,4261980 to 1989
  • 8881970 to 1979
  • 1,054Before 1970
Ancestries in Methuen, MA

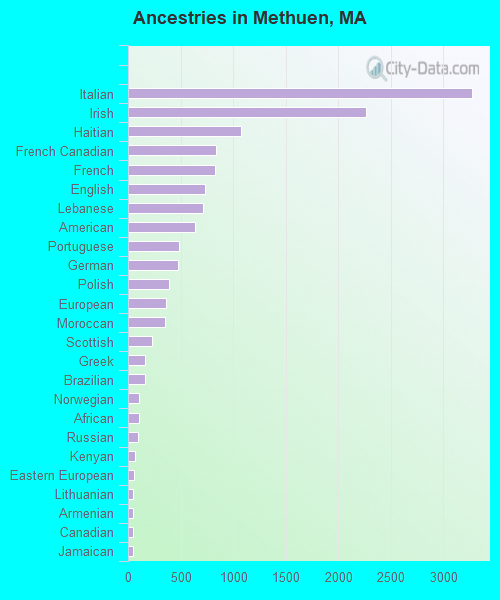
First ancestries reported:

  • Italian: 3,272 (11.3%)
  • Irish: 2,265 (7.8%)
  • Haitian: 1,078 (3.7%)
  • French Canadian: 839 (2.9%)
  • French: 832 (2.9%)
  • English: 736 (2.5%)
  • Lebanese: 712 (2.5%)
  • American: 635 (2.2%)
  • Portuguese: 483 (1.7%)
  • German: 476 (1.6%)
  • Polish: 393 (1.4%)
  • European: 362 (1.2%)
  • Moroccan: 355 (1.2%)
  • Scottish: 226 (0.8%)
  • Greek: 164 (0.6%)
  • Brazilian: 159 (0.5%)
  • Norwegian: 108 (0.4%)
  • African: 107 (0.4%)
  • Russian: 92 (0.3%)
  • Kenyan: 63 (0.2%)
  • Eastern European: 56 (0.2%)
  • Lithuanian: 52 (0.2%)
  • Armenian: 51 (0.2%)
  • Canadian: 50 (0.2%)
  • Jamaican: 43 (0.1%)
  • Cape Verdean: 28 (0.10%)
  • Ukrainian: 26 (0.09%)
  • Scotch-Irish: 23 (0.08%)
  • Scandinavian: 20 (0.07%)
  • Iranian: 18 (0.06%)
  • Syrian: 13 (0.04%)
  • Swiss: 13 (0.04%)
  • British: 12 (0.04%)
  • Latvian: 9 (0.03%)
  • Swedish: 7 (0.02%)
  • Arab: 6 (0.02%)
  • Croatian: 6 (0.02%)
  • Hungarian: 4 (0.01%)

Most common places of birth for foreign-born residents (%):

Dominican Republic
Methuen:

42.3% (5,308)
Massachusetts:

8.3% (101,767)

Haiti
Methuen:

7.1% (891)
Massachusetts:

4.9% (60,432)

India
Methuen:

6.1% (763)
Massachusetts:

6.8% (82,934)

Ecuador
Methuen:

5.0% (632)
Massachusetts:

1.0% (11,727)

Guatemala
Methuen:

4.6% (571)
Massachusetts:

2.7% (32,733)

Lebanon
Methuen:

4.1% (513)
Massachusetts:

0.6% (7,064)

Vietnam
Methuen:

2.9% (369)
Massachusetts:

3.0% (37,197)

Morocco
Methuen:

2.5% (311)
Massachusetts:

0.7% (8,562)

Portugal
Methuen:

2.1% (261)
Massachusetts:

4.1% (50,360)

El Salvador
Methuen:

1.9% (234)
Massachusetts:

3.7% (45,667)

Honduras
Methuen:

1.8% (230)
Massachusetts:

1.1% (13,563)

Place of birth for U.S.-born residents:

  • This state: 32,636
  • Other state: 5,486
  • Northeast: 3,727
  • Midwest: 470
  • South: 830
  • West: 458

90.7% of Methuen residents lived in the same house 1 years ago.
   Out of people who lived in different houses, 36.1% lived in this county.
   Out of people who lived in different counties, 74.3% lived in Massachusetts.


Methuen:

90.7%
State average:

87.7%

Education attainment for males 25 years and older:

  • No schooling: 560
  • Nursery to 4th grade: 57
  • 5th and 6th grade: 167
  • 7th and 8th grade: 260
  • 9th grade: 337
  • 10th grade: 140
  • 11th grade: 57
  • 12th grade, no diploma: 503
  • High school graduate (or equivalency): 5,710
  • Less than 1 year of college: 1,533
  • Some college more than 1 year, no degree: 1,701
  • Associate degree: 1,163
  • Bachelor's degree: 3,522
  • Master's degree: 1,621
  • Professional school degree: 243
  • Doctorate degree: 131
Educational Attainment for Males

Education attainment for females 25 years and older:

  • No schooling: 385
  • Nursery to 4th grade: 239
  • 5th and 6th grade: 194
  • 7th and 8th grade: 322
  • 9th grade: 203
  • 10th grade: 127
  • 11th grade: 141
  • 12th grade, no diploma: 405
  • High school graduate (or equivalency): 5,789
  • Less than 1 year of college: 1,571
  • Some college more than 1 year, no degree: 2,458
  • Associate degree: 1,868
  • Bachelor's degree: 3,638
  • Master's degree: 1,817
  • Professional school degree: 137
  • Doctorate degree: 226
Educational Attainment for Females
Methuen marital status for males
Methuen marital status for females

Housing units in structures:

  • One, detached: 12,151
  • One, attached: 1,570
  • Two: 1,717
  • 3 or 4: 1,697
  • 5 to 9: 950
  • 10 to 19: 893
  • 20 to 49: 685
  • 50 or more: 357
  • Mobile homes: 27
Housing units lacking complete plumbing facilities in 2022: 0.4%

Housing units lacking complete kitchen facilities in 2022: 0.2%

House/condo owner moved in on average 12 years ago

Renter moved in on average 3 years ago

Year householders moved into residence in Methuen
Houses and condos Apartments
Most commonly used house heating fuel in houses and condos in Methuen, MA
  • 66.4%Utility gas
  • 19.9%Fuel oil, kerosene, etc.
  • 6.6%Electricity
  • 5.5%Bottled, tank, or LP gas
  • 1.2%Other fuel
  • 0.1%Wood
Most commonly used house heating fuel in apartments in Methuen, MA
  • 65.5%Utility gas
  • 22.2%Electricity
  • 7.6%Fuel oil, kerosene, etc.
  • 3.4%Bottled, tank, or LP gas
  • 0.7%Other fuel
  • 0.7%No fuel used

Private vs. public school enrollment:

Students in private schools in grades 1 to 8 (elementary and middle school): 925
Here:

18.5%
Massachusetts:

10.3%

Students in private schools in grades 9 to 12 (high school): 451
Here:

14.5%
Massachusetts:

12.3%

Students in private undergraduate colleges: 681
Here:

29.3%
Massachusetts:

51.2%
School Enrollment by Level of School for Male Students
School Enrollment by Level of School for Female Students
Age and Sex of Sensory-Disabled Noninstitutionalized Residents
Age and Sex of Physically-Disabled Noninstitutionalized Residents
Age and Sex of Mentally-Disabled Noninstitutionalized Residents
Age and Sex of Self-Care Disabled Noninstitutionalized Residents
Age and Sex of Go-Outside-Home Disabled Noninstitutionalized Residents
Age and Sex of Noninstitutionalized Residents with Employment Disability