Metropolis, IL (Illinois) Houses and Residents
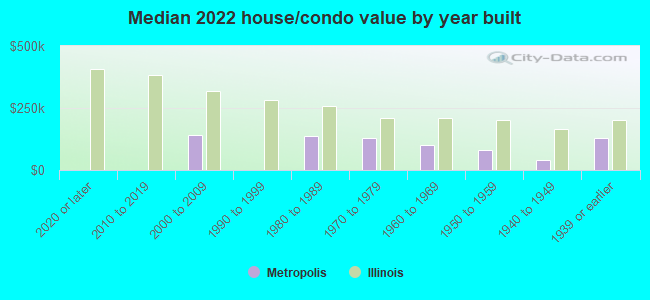
| Metropolis: | $102,808 |
| Illinois: | $251,600 |
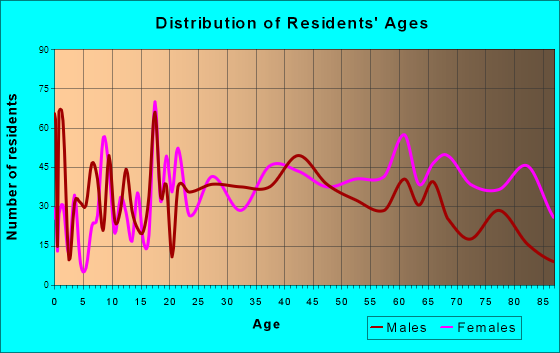
Total population: 6,390 (Urban population: 6,305 (all inside urban clusters), Rural population: 44 (all nonfarm))
Houses: 3,160 (2,480 occupied: 1,679 owner occupied, 833 renter occupied)
| % of renters here: | 33% |
| State: | 33% |
Housing density: 631 houses/condos per square mile
Median price asked for vacant for-sale houses and condos in 2022: $108,366.
Median contract rent in 2022: $477 (lower quartile is $305, upper quartile is $622)
Median rent asked for vacant for-rent units in 2022: $535
Median gross rent in Metropolis, IL in 2022: $682
Housing units in Metropolis with a mortgage: 988 (47 second mortgage, 0 home equity loan, 28 both second mortgage and home equity loan)
Houses without a mortgage: 25
Median household income for houses/condos with a mortgage: $60,435
Median household income for apartments without a mortgage: $54,790
Median monthly housing costs: $763
Compare current foreclosures near Metropolis, IL:
| Photo | Address | Area | Beds / Baths | Price | Details |
|---|---|---|---|---|---|

|
#1
W 10th St
Metropolis, IL 62960
|
- sq. feet
|
1 baths 3 beds |
show details | |

|
#2
Woodland Dr
Metropolis, IL 62960
|
- sq. feet
|
3 baths 3 beds |
show details | |

|
#3
Market St Apt 1
Metropolis, IL 62960
|
- sq. feet
|
- baths - beds |
show details | |

|
#4
Butler St
Metropolis, IL 62960
|
- sq. feet
|
- baths - beds |
show details | |

|
#5
W 20th St
Metropolis, IL 62960
|
- sq. feet
|
- baths - beds |
show details | |

|
#6
E 7th St
Metropolis, IL 62960
|
- sq. feet
|
- baths - beds |
show details | |

|
#7
Old Joppa Rd
Metropolis, IL 62960
|
- sq. feet
|
- baths - beds |
show details | |

|
#8
Jon St
Metropolis, IL 62960
|
- sq. feet
|
- baths - beds |
show details | |

|
#9
Mann Lake Rd
Metropolis, IL 62960
|
- sq. feet
|
- baths - beds |
show details | |

|
#10
White Oak Ln
Metropolis, IL 62960
|
- sq. feet
|
- baths - beds |
show details |
| Photo | Address | Area | Beds / Baths | Price | Details |
|---|---|---|---|---|---|

|
#11
Vienna St
Metropolis, IL 62960
|
- sq. feet
|
- baths - beds |
show details | |

|
#12
Us Highway 60 W
Ledbetter, KY 42058
|
1,365 sq. feet
|
1 baths 3 beds |
show details | |

|
#13
Ogden Landing Rd
West Paducah, KY 42086
|
1,500 sq. feet
|
1 baths 3 beds |
show details | |

|
#14
Shelly Dr
Ledbetter, KY 42058
|
1,163 sq. feet
|
1 baths 3 beds |
show details | |

|
#15
Country Club Est
La Center, KY 42056
|
2,147 sq. feet
|
1 baths 2 beds |
show details | |

|
#16
Loretta Dr
Ledbetter, KY 42058
|
1,790 sq. feet
|
2 baths 2 beds |
show details | |

|
#17
Gholson Rd
Paducah, KY 42001
|
968 sq. feet
|
1 baths 2 beds |
show details | |

|
#18
Westchester Ln
Paducah, KY 42003
|
1,810 sq. feet
|
2 baths 3 beds |
show details | |

|
#19
Spring Valley Road
Paducah, KY 42003
|
1,962 sq. feet
|
2 baths 3 beds |
show details | |

|
#20
Harrison St
Paducah, KY 42001
|
1,800 sq. feet
|
1 baths 3 beds |
show details |
| Photo | Address | Area | Beds / Baths | Price | Details |
|---|---|---|---|---|---|

|
#21
Longview Dr
Paducah, KY 42001
|
1,545 sq. feet
|
1 baths 3 beds |
show details | |

|
#22
Old Hinkleville Rd
Kevil, KY 42053
|
2,548 sq. feet
|
2 baths 3 beds |
show details | |

|
#23
Lakeview Dr
Ledbetter, KY 42058
|
1,755 sq. feet
|
1 baths 3 beds |
show details | |

|
#24
Clay St
Paducah, KY 42001
|
1,319 sq. feet
|
1 baths 3 beds |
show details | |

|
#25
Skyline Dr
West Paducah, KY 42086
|
2,758 sq. feet
|
2 baths 4 beds |
show details | |

|
#26
Myrna Dr
Paducah, KY 42003
|
1,342 sq. feet
|
2 baths 3 beds |
show details | |

|
#27
Six Oaks Dr
Paducah, KY 42003
|
2,240 sq. feet
|
2 baths 3 beds |
show details | |

|
#28
Sharon Dr
Ledbetter, KY 42058
|
1,190 sq. feet
|
1 baths 3 beds |
show details | |

|
#29
Sharon Dr
Ledbetter, KY 42058
|
1,620 sq. feet
|
2 baths 3 beds |
show details | |

|
#30
Sharon Dr
Ledbetter, KY 42058
|
1,175 sq. feet
|
1 baths 3 beds |
show details |
| Photo | Address | Area | Beds / Baths | Price | Details |
|---|---|---|---|---|---|

|
#31
Carson Way
Paducah, KY 42003
|
2,090 sq. feet
|
4 baths 5 beds |
show details | |

|
#32
Sharon Dr
Ledbetter, KY 42058
|
1,960 sq. feet
|
2 baths 3 beds |
show details | |

|
#33
N 24th St
Paducah, KY 42001
|
1,987 sq. feet
|
1 baths 3 beds |
show details | |

|
#34
Geraldine Dr
Paducah, KY 42003
|
1,775 sq. feet
|
2 baths 3 beds |
show details | |

|
#35
Cold Springs Rd
Paducah, KY 42003
|
2,318 sq. feet
|
2 baths 3 beds |
show details | |

|
#36
Us Highway 68 W
Benton, KY 42025
|
1,776 sq. feet
|
1 baths 3 beds |
show details | |

|
#37
Hodge Landing Rd
Ledbetter, KY 42058
|
1,125 sq. feet
|
1 baths 3 beds |
show details | |

|
#38
Kentucky Dam Rd
Paducah, KY 42003
|
2,088 sq. feet
|
1 baths 3 beds |
show details | |

|
#39
Culp Rd
Paducah, KY 42003
|
1,778 sq. feet
|
1 baths 3 beds |
show details | |

|
#40
N 23rd St
Paducah, KY 42001
|
1,120 sq. feet
|
1 baths 3 beds |
show details |
| Photo | Address | Area | Beds / Baths | Price | Details |
|---|---|---|---|---|---|

|
#41
Wilton Cir
Paducah, KY 42003
|
1,482 sq. feet
|
2 baths 3 beds |
show details | |

|
#42
Tuck Rd
Paducah, KY 42001
|
1,526 sq. feet
|
2 baths 3 beds |
show details | |

|
#43
Rebecca Ln
Paducah, KY 42001
|
1,491 sq. feet
|
2 baths 3 beds |
show details | |

|
#44
Harris Rd
Paducah, KY 42001
|
1,983 sq. feet
|
4 baths 6 beds |
show details | |

|
#45
Woodville Rd
Kevil, KY 42053
|
1,749 sq. feet
|
1 baths - beds |
show details | |

|
#46
Robinwood Dr
Paducah, KY 42001
|
3,916 sq. feet
|
4 baths 4 beds |
show details | |

|
#47
Emily Dr
West Paducah, KY 42086
|
960 sq. feet
|
1 baths 3 beds |
show details | |

|
#48
Shawnee Ln
Paducah, KY 42001
|
1,579 sq. feet
|
1 baths - beds |
show details | |

|
#49
Century Ln
Paducah, KY 42003
|
1,272 sq. feet
|
- baths 3 beds |
show details | |

|
Check over 1 million property listings on Foreclosure.com!
|
browse all offers | |||

Latest news about housing in Metropolis, IL collected exclusively by city-data.com from local newspapers, TV, and radio stations

 | Looking into Metropolis in downstate IL (12 replies) |
| What areas to invest in for real estate? (155 replies) |
| Liberal Southern Illinois Cities? (23 replies) |
| Favorite Chicagoland Airport? (81 replies) |
| Relocating to Carbondale, Illinois (5 replies) |
| Edgewater(Chicago) (3 replies) |
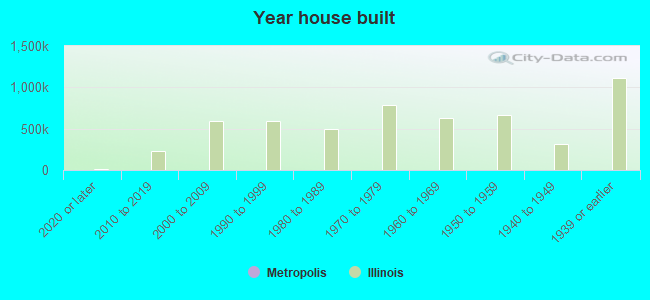
Median year apartment built: 1981
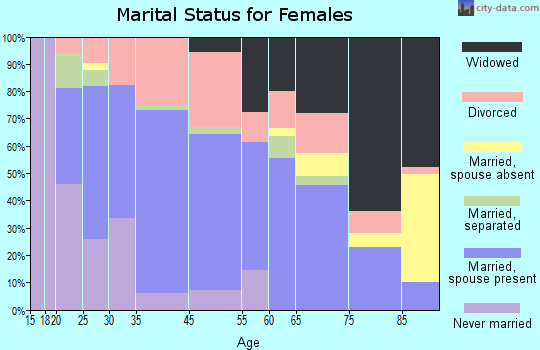
Household type by relationship:
Households: 5,880- Male householders: 1,238 (334 living alone), Female householders: 1,196 (504 living alone)
1,026 spouses (1,026 opposite-sex spouses), 157 unmarried partners, (157 opposite-sex unmarried partners), 1,433 children (1,384 natural, 0 adopted, 49 stepchildren), 214 grandchildren, 64 brothers or sisters, 117 parents, 0 foster children, 80 other relatives, 70 non-relatives
- In group quarters: 280
Size of family households: 723 2-persons, 367 3-persons, 234 4-persons, 147 5-persons, 42 6-persons.
Size of nonfamily households: 883 1-person, 78 2-persons, 31 3-persons.
744 married couples with children.
273 single-parent households (57 men, 216 women).
96.3% of residents of Metropolis speak English at home.
2.3% of residents speak Spanish at home (51% speak English very well, 49% speak English well).
0.1% of residents speak other Indo-European language at home (100% don't speak English at all).
0.7% of residents speak Asian or Pacific Island language at home (59% speak English very well, 36% speak English well, 5% speak English not well).
0.6% of residents speak other language at home (74% speak English very well, 26% speak English well).
Foreign born population: 140 (2.4%)
(32.9% of them are naturalized citizens)
| Here: | 5.9 |
| State: | 6.4 |
| Here: | 4.6 |
| State: | 4.1 |
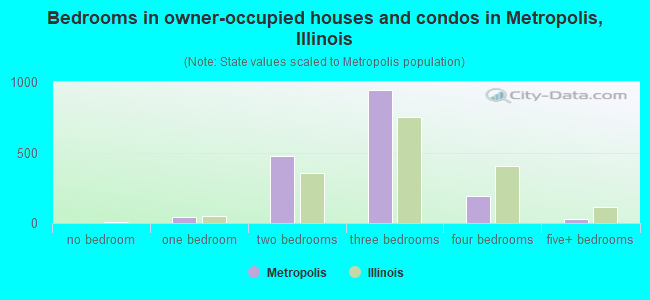
- Bedrooms in owner-occupied houses and condos in Metropolis, Illinois
- 0no bedroom
- 431 bedroom
- 4782 bedrooms
- 9413 bedrooms
- 1914 bedrooms
- 255+ bedrooms
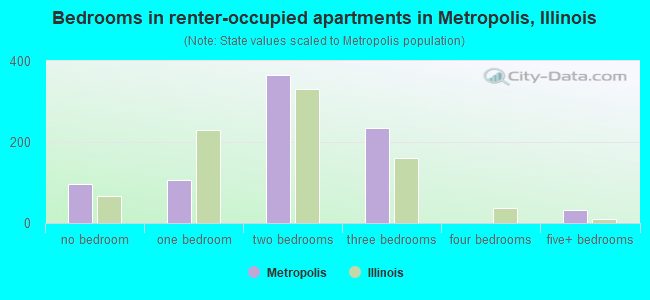
- Bedrooms in renter-occupied apartments in Metropolis, Illinois
- 97no bedroom
- 1051 bedroom
- 3652 bedrooms
- 2353 bedrooms
- 04 bedrooms
- 325+ bedrooms
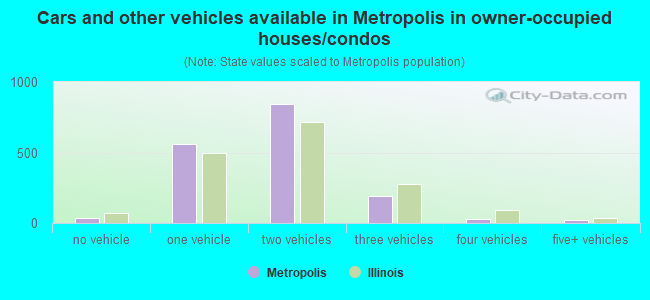
- Cars and other vehicles available in Metropolis in owner-occupied houses/condos
- 34no vehicle
- 5631 vehicle
- 8412 vehicles
- 1933 vehicles
- 284 vehicles
- 205+ vehicles
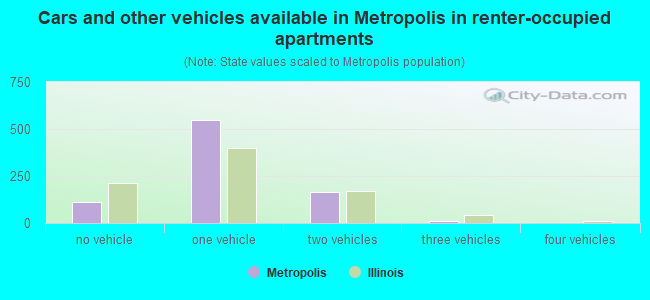
- Cars and other vehicles available in Metropolis in renter-occupied apartments
- 112no vehicle
- 5461 vehicle
- 1662 vehicles
- 93 vehicles
- 04 vehicles
- 05+ vehicles
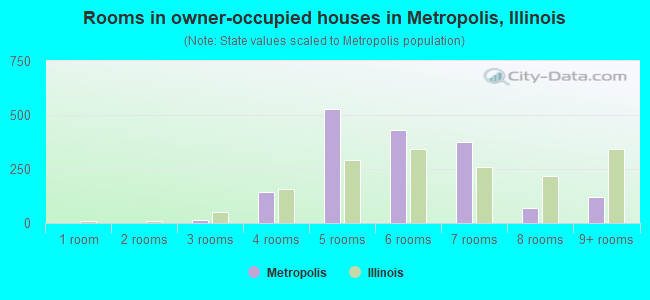
- Rooms in owner-occupied houses in Metropolis, Illinois
- 01 room
- 02 rooms
- 163 rooms
- 1454 rooms
- 5275 rooms
- 4296 rooms
- 3737 rooms
- 688 rooms
- 1209+ rooms
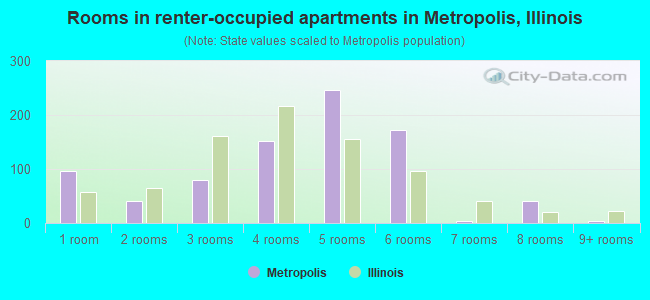
- Rooms in renter-occupied apartments in Metropolis, Illinois
- 971 room
- 402 rooms
- 793 rooms
- 1524 rooms
- 2465 rooms
- 1726 rooms
- 47 rooms
- 408 rooms
- 49+ rooms
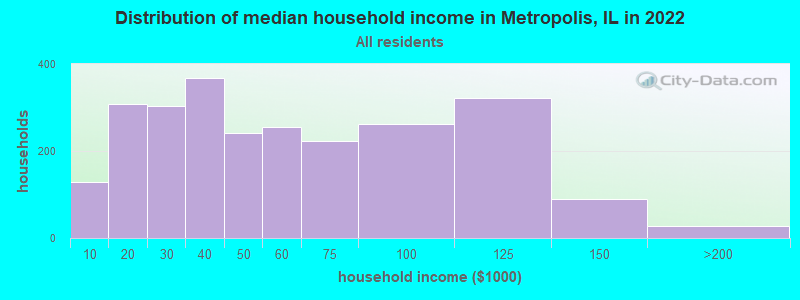
Metropolis, IL household income distribution

- 129Less than $10,000
- 308$10,000 to $19,999
- 304$20,000 to $29,999
- 368$30,000 to $39,999
- 241$40,000 to $49,999
- 255$50,000 to $59,999
- 224$60,000 to $74,999
- 263$75,000 to $99,999
- 322$100,000 to $124,999
- 90$125,000 to $149,999
- 22$150,000 to $199,999
- 6$200,000 or more
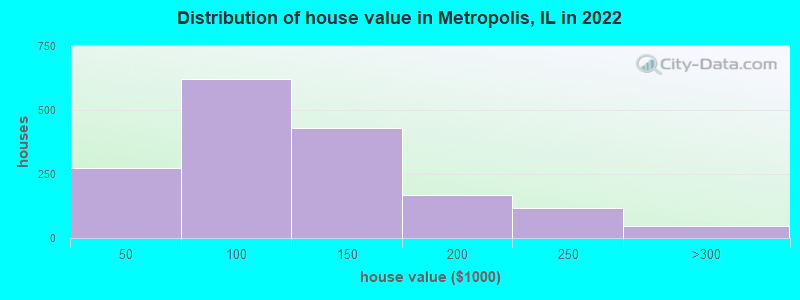
Home value of owner - occupied houses in 2022 in Metropolis, IL
-
- 16Less than $10,000
- 7$10,000 to $14,999
- 17$15,000 to $19,999
- 43$20,000 to $24,999
- 46$25,000 to $29,999
- 16$30,000 to $34,999
- 70$35,000 to $39,999
- 54$40,000 to $49,999
- 84$50,000 to $59,999
- 145$60,000 to $69,999
- 97$70,000 to $79,999
- 106$80,000 to $89,999
- 132$90,000 to $99,999
- 278$100,000 to $124,999
- 152$125,000 to $149,999
- 150$150,000 to $174,999
- 16$175,000 to $199,999
- 115$200,000 to $249,999
- 47$250,000 to $299,999
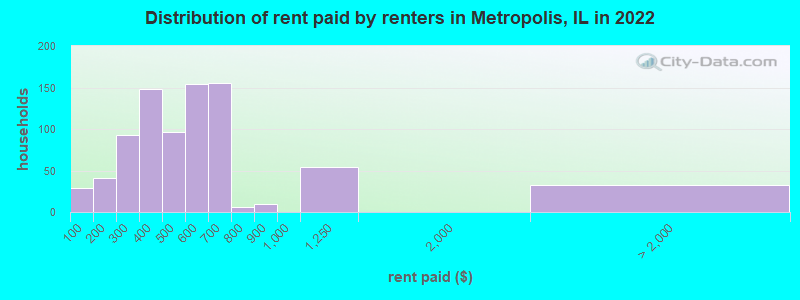
Rent paid by renters in 2022 in Metropolis, IL
-
- 29Less than $100
- 41$100 to $149
- 92$250 to $299
- 105$300 to $349
- 42$350 to $399
- 40$400 to $449
- 55$450 to $499
- 102$500 to $549
- 52$550 to $599
- 48$600 to $649
- 106$650 to $699
- 5$700 to $749
- 9$800 to $899
- 54$1,000 to $1,249
- 16$2,000 to $2,499
- 15No cash rent
Percentage of workers working in this county: 61.3%
Number of people working at home: 152 (7.0% of all workers)
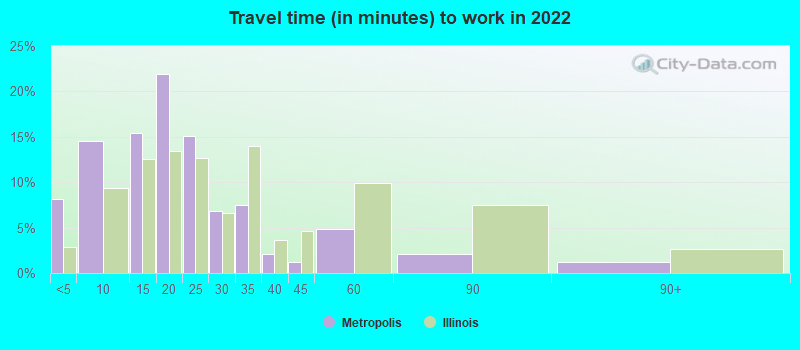
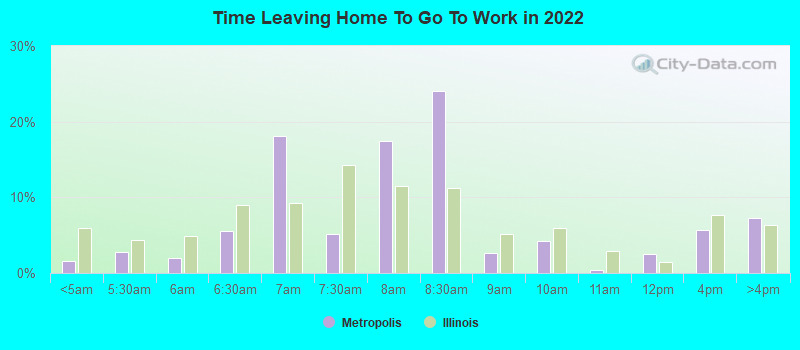
Travel time to work (commute)
- Less than 5 minutes: 200
- 5 to 9 minutes: 377
- 10 to 14 minutes: 367
- 15 to 19 minutes: 425
- 20 to 24 minutes: 70
- 25 to 29 minutes: 186
- 30 to 34 minutes: 169
- 35 to 39 minutes: 20
- 40 to 44 minutes: 43
- 45 to 59 minutes: 65
- 60 to 89 minutes: 33
- 90 or more minutes: 33
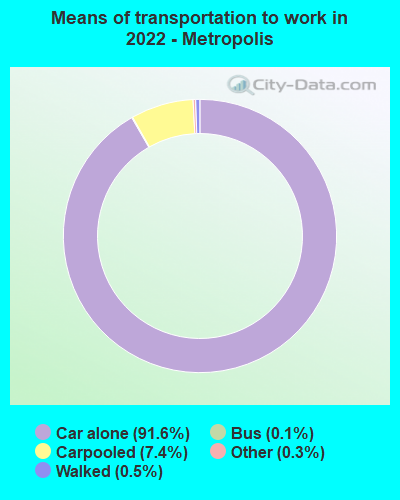
Means of transportation to work:
- Drove a car alone: 2,368 (84.6%)
- Carpooled: 204 (7.3%)
- Bus: 2 (0.1%)
- Taxi: 8 (0.3%)
- Bicycle: 2 (0.1%)
- Walked: 13 (0.5%)
- Worked at home: 152 (5.4%)
- Unemployment by race in 2022
- Unemployment rate for White non-Hispanic residents
- 1.6%Males
- 2.3%Females
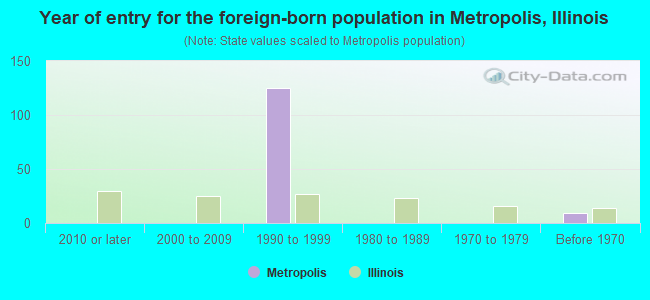
- Year of entry for the foreign-born population in Metropolis, Illinois
- 02010 or later
- 02000 to 2009
- 1251990 to 1999
- 01980 to 1989
- 01970 to 1979
- 9Before 1970
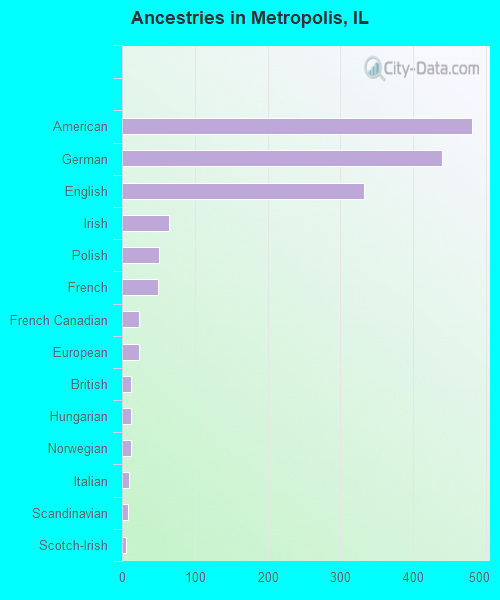
First ancestries reported:
- American: 480 (21.0%)
- German: 439 (19.2%)
- English: 333 (14.5%)
- Irish: 64 (2.8%)
- Polish: 51 (2.2%)
- French: 49 (2.1%)
- French Canadian: 24 (1.0%)
- European: 23 (1.0%)
- British: 12 (0.5%)
- Hungarian: 12 (0.5%)
- Norwegian: 12 (0.5%)
- Italian: 10 (0.4%)
- Scandinavian: 8 (0.3%)
- Scotch-Irish: 5 (0.2%)
- Yugoslavian: 3 (0.1%)
Most common places of birth for foreign-born residents (%):
| Metropolis: | 66.4% (93) |
| Illinois: | 34.7% (626,958) |
| Metropolis: | 14.3% (20) |
| Illinois: | 2.2% (40,393) |
| Metropolis: | 7.1% (10) |
| Illinois: | 0.1% (1,630) |
| Metropolis: | 7.1% (10) |
| Illinois: | 1.1% (19,306) |
| Metropolis: | 2.9% (4) |
| Illinois: | 0.6% (10,776) |
Place of birth for U.S.-born residents:
- This state: 2,623
- Other state: 3,117
- Northeast: 133
- Midwest: 418
- South: 2,397
- West: 83
87.1% of Metropolis residents lived in the same house 1 years ago.
Out of people who lived in different houses, 32.7% lived in this county.
Out of people who lived in different counties, 15.9% lived in Illinois.
| Metropolis: | 87.1% |
| State average: | 88.3% |
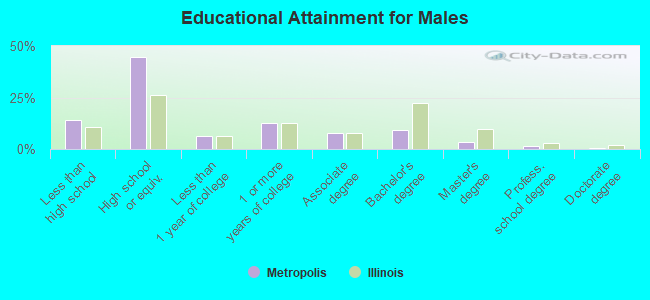
Education attainment for males 25 years and older:
- No schooling: 36
- Nursery to 4th grade: 0
- 5th and 6th grade: 29
- 7th and 8th grade: 70
- 9th grade: 0
- 10th grade: 11
- 11th grade: 64
- 12th grade, no diploma: 43
- High school graduate (or equivalency): 794
- Less than 1 year of college: 115
- Some college more than 1 year, no degree: 225
- Associate degree: 141
- Bachelor's degree: 164
- Master's degree: 63
- Professional school degree: 24
- Doctorate degree: 7
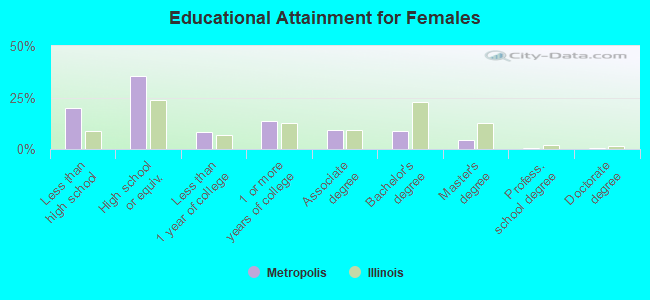
Education attainment for females 25 years and older:
- No schooling: 51
- Nursery to 4th grade: 1
- 5th and 6th grade: 27
- 7th and 8th grade: 118
- 9th grade: 47
- 10th grade: 135
- 11th grade: 45
- 12th grade, no diploma: 56
- High school graduate (or equivalency): 852
- Less than 1 year of college: 203
- Some college more than 1 year, no degree: 332
- Associate degree: 220
- Bachelor's degree: 212
- Master's degree: 101
- Professional school degree: 7
- Doctorate degree: 10
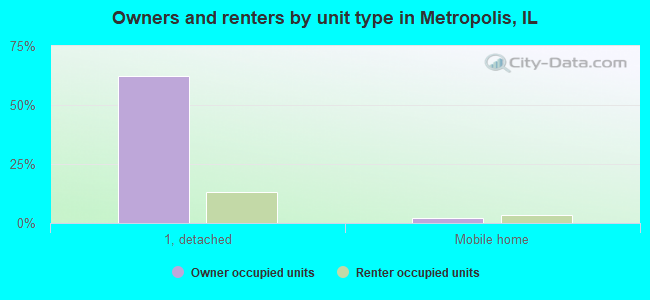
Housing units in structures:
- One, detached: 2,427
- One, attached: 62
- Two: 100
- 3 or 4: 87
- 5 to 9: 28
- 10 to 19: 65
- 20 to 49: 64
- 50 or more: 61
- Mobile homes: 264
Median worth of mobile homes: $33,836
Housing units lacking complete kitchen facilities in 2022: 1.5%
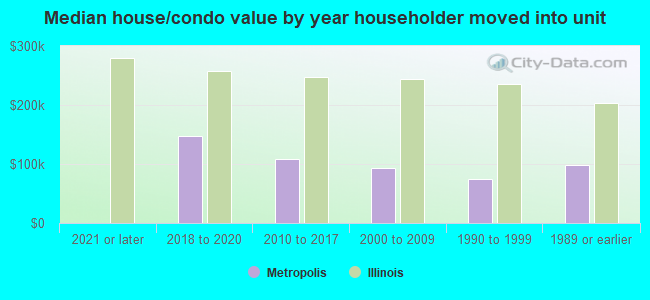
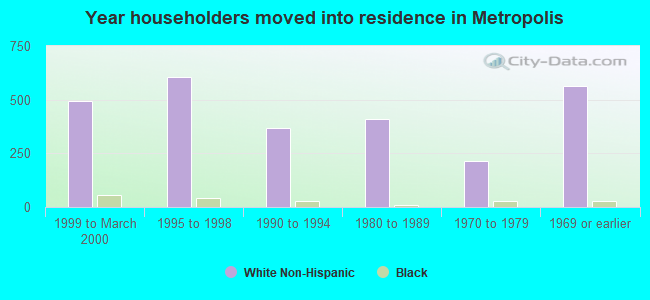
House/condo owner moved in on average 10 years ago
Renter moved in on average 7 years ago
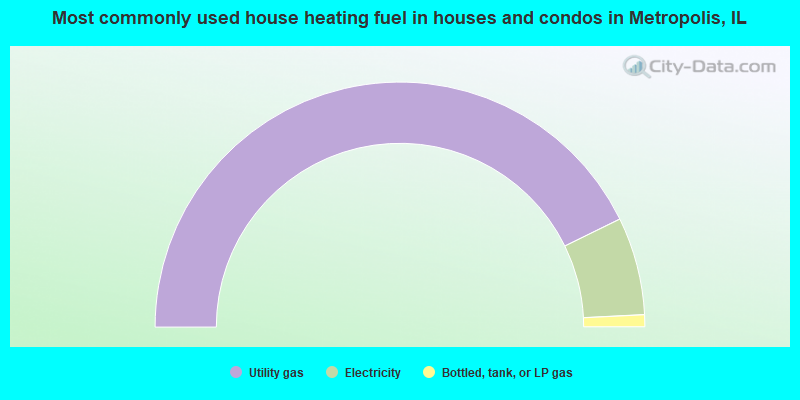
- 85.5%Utility gas
- 12.9%Electricity
- 1.6%Bottled, tank, or LP gas
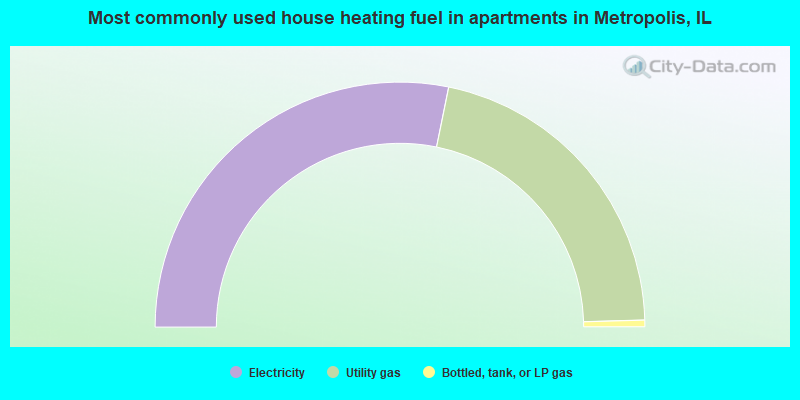
- 56.4%Electricity
- 42.7%Utility gas
- 0.9%Bottled, tank, or LP gas
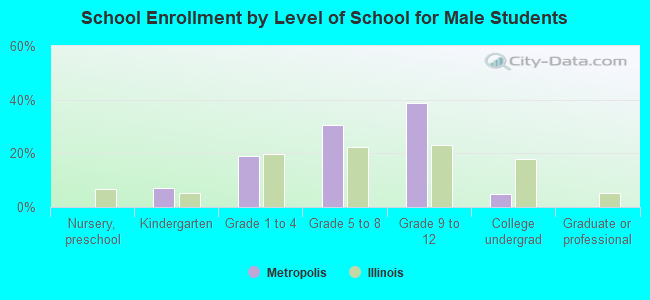
Private vs. public school enrollment:
| Here: | 11.7% |
| Illinois: | 13.3% |
| Here: | 0.4% |
| Illinois: | 9.9% |
| Here: | 31.1% |
| Illinois: | 27.4% |