Middletown, OH (Ohio) Houses and Residents
| Middletown: | $161,300 |
| Ohio: | $204,100 |
Mean price in 2022:
Detached houses: $170,977
Here: $170,977 State: $254,366 Townhouses or other attached units: $132,034
Here: $132,034 State: $225,733 In 2-unit structures: $131,775
Here: $131,775 State: $144,384 In 3-to-4-unit structures: $81,519
Here: $81,519 State: $203,002 In 5-or-more-unit structures: $92,783
Here: $92,783 State: $211,593 Mobile homes: $124,104
Here: $124,104 State: $62,719
Total population: 48,791 (All urban)
Houses: 23,054 (21,157 occupied: 11,552 owner occupied, 9,928 renter occupied)
| % of renters here: | 46% |
| State: | 33% |
Housing density: 899 houses/condos per square mile
Median price asked for vacant for-sale houses and condos in 2022: $107,527.
Median contract rent in 2022: $659 (lower quartile is $566, upper quartile is $897)
Median rent asked for vacant for-rent units in 2022: $757
Median gross rent in Middletown, OH in 2022: $858
Housing units in Middletown with a mortgage: 6,619 (545 second mortgage, 20 home equity loan, 463 both second mortgage and home equity loan)
Houses without a mortgage: 279
Median household income for houses/condos with a mortgage: $77,791
Median household income for apartments without a mortgage: $55,864
Median monthly housing costs: $859
Compare current foreclosures in Middletown, OH:
| Photo | Address | Area | Beds / Baths | Price | Details |
|---|---|---|---|---|---|

|
#1
Lewis St
Middletown, OH 45044
|
960 sq. feet
|
1 baths 3 beds |
$189,900
|
show details |

|
#2
Clayton Ave
Middletown, OH 45042
|
- sq. feet
|
1 baths 2 beds |
$65,100
|
show details |

|
#3
Lakeview Dr
Middletown, OH 45044
|
1,825 sq. feet
|
2 baths 4 beds |
show details | |

|
#4
Roosevelt Blvd
Middletown, OH 45044
|
784 sq. feet
|
1 baths 2 beds |
show details | |

|
#5
El Camino Dr
Middletown, OH 45044
|
1,536 sq. feet
|
2 baths 4 beds |
show details | |

|
#6
Amberley Ct
Middletown, OH 45044
|
3,354 sq. feet
|
4 baths 4 beds |
show details | |

|
#7
Yankee Rd
Middletown, OH 45044
|
1,376 sq. feet
|
1 baths 3 beds |
show details | |

|
#8
Wilbraham Rd
Middletown, OH 45042
|
1,361 sq. feet
|
1 baths 3 beds |
show details | |

|
#9
Winton St
Middletown, OH 45044
|
1,165 sq. feet
|
1 baths 2 beds |
show details | |

|
#10
Kunz Ave
Middletown, OH 45044
|
1,029 sq. feet
|
1 baths 2 beds |
show details |
| Photo | Address | Area | Beds / Baths | Price | Details |
|---|---|---|---|---|---|

|
#11
August Ave
Middletown, OH 45044
|
960 sq. feet
|
1 baths 3 beds |
show details | |

|
#12
Union Rd
Middletown, OH 45044
|
1,376 sq. feet
|
1 baths 3 beds |
show details | |

|
#13
North Ave
Middletown, OH 45042
|
1,356 sq. feet
|
1 baths 3 beds |
show details | |

|
#14
Yankee Rd
Middletown, OH 45044
|
1,998 sq. feet
|
1 baths 3 beds |
show details | |

|
#15
Baybrook Ct
Middletown, OH 45044
|
1,722 sq. feet
|
2 baths 3 beds |
show details | |

|
#16
Berwick Ln
Middletown, OH 45042
|
1,660 sq. feet
|
2 baths 3 beds |
show details | |

|
#17
Pershing Ave
Middletown, OH 45044
|
1,176 sq. feet
|
1 baths 4 beds |
show details | |

|
#18
Shawnray Dr Apt 48
Middletown, OH 45044
|
1,294 sq. feet
|
1 baths 3 beds |
show details | |

|
#19
Victoria Ave
Middletown, OH 45044
|
1,336 sq. feet
|
1 baths 3 beds |
show details | |

|
#20
Vannest Ave
Middletown, OH 45042
|
840 sq. feet
|
1 baths 3 beds |
show details |
| Photo | Address | Area | Beds / Baths | Price | Details |
|---|---|---|---|---|---|

|
#21
Tytus Ave
Middletown, OH 45042
|
2,004 sq. feet
|
2 baths 5 beds |
show details | |

|
#22
Spencer Ln
Middletown, OH 45042
|
864 sq. feet
|
1 baths 2 beds |
show details | |

|
#23
Orchard St
Middletown, OH 45044
|
1,536 sq. feet
|
2 baths 4 beds |
show details | |

|
#24
N Breiel Blvd
Middletown, OH 45042
|
1,400 sq. feet
|
1 baths 3 beds |
show details | |

|
#25
Lawn Ave
Middletown, OH 45044
|
1,080 sq. feet
|
1 baths 3 beds |
show details | |

|
#26
9th Ave
Middletown, OH 45044
|
816 sq. feet
|
1 baths 2 beds |
show details | |

|
#27
Princeton Rd
Middletown, OH 45044
|
1,218 sq. feet
|
2 baths 3 beds |
show details | |

|
#28
Aberdeen Dr
Middletown, OH 45042
|
2,122 sq. feet
|
2 baths 4 beds |
show details | |

|
#29
Ardmore Dr
Middletown, OH 45042
|
2,328 sq. feet
|
2 baths 3 beds |
show details | |

|
#30
Rosedale Rd
Middletown, OH 45042
|
2,633 sq. feet
|
2 baths 4 beds |
show details |
| Photo | Address | Area | Beds / Baths | Price | Details |
|---|---|---|---|---|---|

|
#31
Richardson Dr
Middletown, OH 45042
|
1,128 sq. feet
|
1 baths 2 beds |
show details | |

|
#32
Kensington St
Middletown, OH 45044
|
2,028 sq. feet
|
2 baths 4 beds |
show details | |

|
#33
Hetzler Rd
Middletown, OH 45042
|
3,032 sq. feet
|
2 baths 4 beds |
show details | |

|
#34
Diamond Loop
Middletown, OH 45044
|
1,344 sq. feet
|
2 baths 3 beds |
show details | |

|
#35
Prospect Ave
Middletown, OH 45044
|
768 sq. feet
|
1 baths 2 beds |
show details | |

|
#36
Baltimore St
Middletown, OH 45044
|
1,548 sq. feet
|
1 baths 3 beds |
show details | |

|
#37
Carolina St
Middletown, OH 45044
|
768 sq. feet
|
1 baths 2 beds |
show details | |

|
#38
Flemming Rd
Middletown, OH 45042
|
1,019 sq. feet
|
1 baths 2 beds |
show details | |

|
#39
Aberdeen Dr
Middletown, OH 45042
|
1,196 sq. feet
|
1 baths 3 beds |
show details | |

|
#40
Elmo Pl
Middletown, OH 45042
|
1,148 sq. feet
|
1 baths 2 beds |
show details |
| Photo | Address | Area | Beds / Baths | Price | Details |
|---|---|---|---|---|---|

|
#41
Woodlawn Ave
Middletown, OH 45044
|
1,768 sq. feet
|
1 baths 3 beds |
show details | |

|
#42
Alpine Aster Ct
Middletown, OH 45044
|
4,307 sq. feet
|
4 baths 4 beds |
show details | |

|
#43
Jacksonburg Rd
Middletown, OH 45042
|
1,048 sq. feet
|
1 baths 2 beds |
show details | |

|
#44
Schul Rd
Middletown, OH 45042
|
1,856 sq. feet
|
1 baths 3 beds |
show details | |

|
#45
Rachel Ln
Middletown, OH 45042
|
2,581 sq. feet
|
2 baths 4 beds |
show details | |

|
#46
Sandric Ln
Middletown, OH 45044
|
1,495 sq. feet
|
2 baths 3 beds |
show details | |

|
#47
Middletown Germantown Rd
Middletown, OH 45042
|
1,118 sq. feet
|
1 baths 3 beds |
show details | |

|
#48
Carmody Pl
Middletown, OH 45044
|
1,680 sq. feet
|
1 baths 3 beds |
show details | |

|
#49
Church St
Middletown, OH 45042
|
770 sq. feet
|
1 baths 1 beds |
show details | |

|
Check over 1 million property listings on Foreclosure.com!
|
browse all offers | |||

Latest news about housing in Middletown, OH collected exclusively by city-data.com from local newspapers, TV, and radio stations


Median year apartment built: 1965
Household type by relationship:
Households: 50,526- Male householders: 10,121 (3,610 living alone), Female householders: 10,824 (3,701 living alone)
7,129 spouses (7,062 opposite-sex spouses), 2,214 unmarried partners, (2,024 opposite-sex unmarried partners), 13,184 children (12,279 natural, 184 adopted, 720 stepchildren), 2,578 grandchildren, 449 brothers or sisters, 488 parents, 0 foster children, 862 other relatives, 1,898 non-relatives
- In group quarters: 775
Size of family households: 6,237 2-persons, 2,857 3-persons, 1,695 4-persons, 1,095 5-persons, 447 6-persons, 334 7-or-more-persons.
Size of nonfamily households: 6,951 1-person, 1,621 2-persons, 102 3-persons, 79 4-persons, 43 5-persons.
3,748 married couples with children.
4,625 single-parent households (1,403 men, 3,222 women).
95.1% of residents of Middletown speak English at home.
3.7% of residents speak Spanish at home (42% speak English very well, 25% speak English well, 25% speak English not well, 8% don't speak English at all).
0.5% of residents speak other Indo-European language at home (82% speak English very well, 11% speak English well, 6% speak English not well).
0.6% of residents speak Asian or Pacific Island language at home (26% speak English very well, 38% speak English well, 36% speak English not well).
0.1% of residents speak other language at home (100% speak English very well).
Foreign born population: 1,577 (3.1%)
(39.9% of them are naturalized citizens)
| Here: | 6.3 |
| State: | 6.7 |
| Here: | 4.5 |
| State: | 4.4 |

- Bedrooms in owner-occupied houses and condos in Middletown, Ohio
- 6no bedroom
- 1741 bedroom
- 2,9352 bedrooms
- 5,7193 bedrooms
- 2,2924 bedrooms
- 4275+ bedrooms

- Bedrooms in renter-occupied apartments in Middletown, Ohio
- 414no bedroom
- 2,2001 bedroom
- 4,3632 bedrooms
- 2,2613 bedrooms
- 6244 bedrooms
- 675+ bedrooms

- Cars and other vehicles available in Middletown in owner-occupied houses/condos
- 332no vehicle
- 3,3831 vehicle
- 4,7432 vehicles
- 2,2563 vehicles
- 6114 vehicles
- 2275+ vehicles

- Cars and other vehicles available in Middletown in renter-occupied apartments
- 1,687no vehicle
- 5,1281 vehicle
- 2,1942 vehicles
- 6233 vehicles
- 2074 vehicles
- 895+ vehicles

- Rooms in owner-occupied houses in Middletown, Ohio
- 01 room
- 242 rooms
- 1403 rooms
- 8924 rooms
- 2,6565 rooms
- 3,0206 rooms
- 1,7417 rooms
- 1,2728 rooms
- 1,8089+ rooms

- Rooms in renter-occupied apartments in Middletown, Ohio
- 4051 room
- 5562 rooms
- 1,5083 rooms
- 2,3384 rooms
- 2,3565 rooms
- 1,6686 rooms
- 5427 rooms
- 1858 rooms
- 3719+ rooms


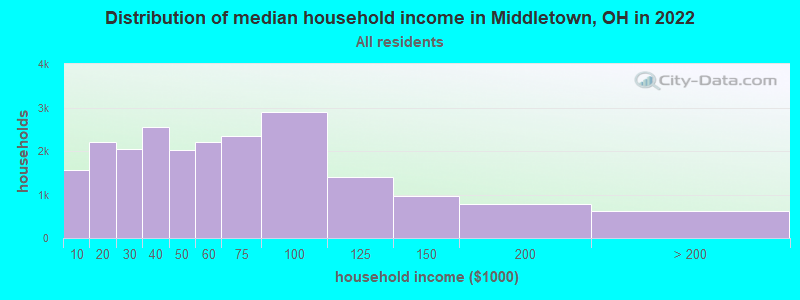
Middletown, OH household income distribution

- 1,572Less than $10,000
- 2,198$10,000 to $19,999
- 2,052$20,000 to $29,999
- 2,563$30,000 to $39,999
- 2,027$40,000 to $49,999
- 2,213$50,000 to $59,999
- 2,356$60,000 to $74,999
- 2,897$75,000 to $99,999
- 1,405$100,000 to $124,999
- 975$125,000 to $149,999
- 783$150,000 to $199,999
- 627$200,000 or more
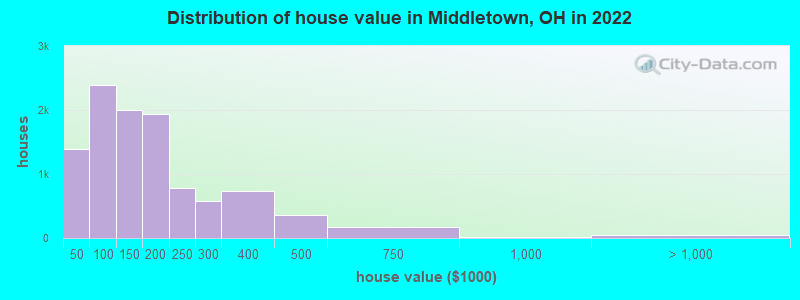
Home value of owner - occupied houses in 2022 in Middletown, OH
-
- 388Less than $10,000
- 146$10,000 to $14,999
- 43$15,000 to $19,999
- 95$20,000 to $24,999
- 183$25,000 to $29,999
- 158$30,000 to $34,999
- 61$35,000 to $39,999
- 312$40,000 to $49,999
- 202$50,000 to $59,999
- 402$60,000 to $69,999
- 450$70,000 to $79,999
- 371$80,000 to $89,999
- 644$90,000 to $99,999
- 922$100,000 to $124,999
- 1,070$125,000 to $149,999
- 1,246$150,000 to $174,999
- 690$175,000 to $199,999
- 778$200,000 to $249,999
- 572$250,000 to $299,999
- 733$300,000 to $399,999
- 363$400,000 to $499,999
- 167$500,000 to $749,999
- 11$750,000 to $999,999
- 18$1,000,000 to $1,499,999
- 8$1,500,000 to $1,999,999
- 18$2,000,000 or more
Rent paid by renters in 2022 in Middletown, OH
-
- 285Less than $100
- 59$100 to $149
- 36$150 to $199
- 83$200 to $249
- 54$250 to $299
- 165$300 to $349
- 85$350 to $399
- 486$400 to $449
- 252$450 to $499
- 679$500 to $549
- 549$550 to $599
- 1,229$600 to $649
- 920$650 to $699
- 1,330$700 to $749
- 693$750 to $799
- 734$800 to $899
- 786$900 to $999
- 826$1,000 to $1,249
- 92$1,250 to $1,499
- 274$1,500 to $1,999
- 9$2,000 to $2,499
- 2$3,500 or more
- 732No cash rent


Percentage of workers working in this county: 53.1%
Number of people working at home: 1,853 (8.4% of all workers)
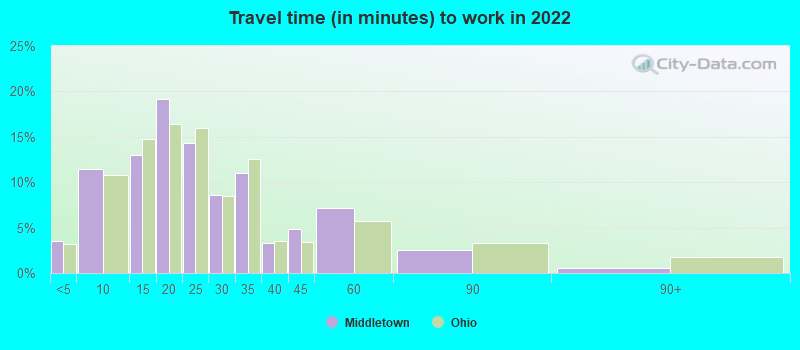
Travel time to work (commute)
- Less than 5 minutes: 904
- 5 to 9 minutes: 2,128
- 10 to 14 minutes: 2,481
- 15 to 19 minutes: 2,924
- 20 to 24 minutes: 3,137
- 25 to 29 minutes: 2,132
- 30 to 34 minutes: 2,893
- 35 to 39 minutes: 720
- 40 to 44 minutes: 710
- 45 to 59 minutes: 1,155
- 60 to 89 minutes: 370
- 90 or more minutes: 214
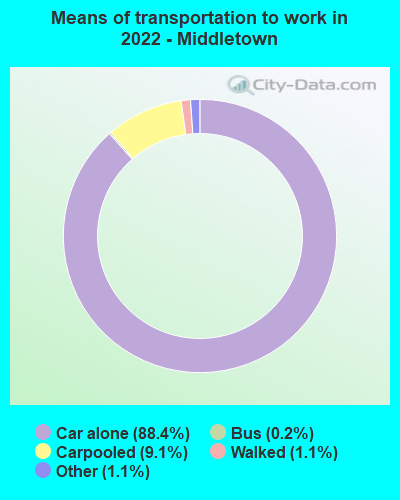
Means of transportation to work:
- Drove a car alone: 17,016 (78.2%)
- Carpooled: 1,918 (8.8%)
- Bus: 35 (0.2%)
- Taxi: 438 (2.0%)
- Walked: 211 (1.0%)
- Worked at home: 1,853 (8.5%)

- Unemployment by race in 2022
- Unemployment rate for White non-Hispanic residents
- 5.6%Males
- 4.9%Females
- Unemployment rate for Black residents
- 2.6%Males
- 7.1%Females
- Unemployment rate for Asian residents
- 41.3%Males
- Unemployment rate for other race residents
- 10.9%Males
- 8.6%Females
- Unemployment rate for two or more race residents
- 6.3%Males
- 9.7%Females
- Unemployment rate for Hispanic or Latino residents
- 6.9%Males
- 11.6%Females

- Year of entry for the foreign-born population in Middletown, Ohio
- 6172010 or later
- 4632000 to 2009
- 941990 to 1999
- 361980 to 1989
- 711970 to 1979
- 213Before 1970

First ancestries reported:
- English: 4,098 (18.0%)
- American: 3,177 (14.0%)
- German: 2,876 (12.7%)
- Irish: 1,976 (8.7%)
- Italian: 542 (2.4%)
- European: 383 (1.7%)
- Scottish: 273 (1.2%)
- Jamaican: 150 (0.7%)
- French: 117 (0.5%)
- Nigerian: 114 (0.5%)
- Scotch-Irish: 105 (0.5%)
- Greek: 82 (0.4%)
- Scandinavian: 63 (0.3%)
- Slovak: 61 (0.3%)
- Hungarian: 58 (0.3%)
- African: 50 (0.2%)
- Polish: 47 (0.2%)
- British: 44 (0.2%)
- Lithuanian: 41 (0.2%)
- Dutch: 40 (0.2%)
- Welsh: 39 (0.2%)
- Eastern European: 37 (0.2%)
- Norwegian: 31 (0.1%)
- Canadian: 25 (0.1%)
- French Canadian: 18 (0.08%)
- Northern European: 17 (0.07%)
- Czechoslovakian: 17 (0.07%)
- Yugoslavian: 15 (0.07%)
- Danish: 10 (0.04%)
- Arab: 9 (0.04%)
- Swedish: 8 (0.04%)
- Israeli: 7 (0.03%)
- Serbian: 6 (0.03%)
- Austrian: 4 (0.02%)
Most common places of birth for foreign-born residents (%):
| Middletown: | 27.7% (415) |
| Ohio: | 7.8% (44,796) |
| Middletown: | 22.9% (343) |
| Ohio: | 1.1% (6,549) |
| Middletown: | 12.3% (184) |
| Ohio: | 6.2% (35,703) |
| Middletown: | 8.5% (127) |
| Ohio: | 0.8% (4,549) |
| Middletown: | 5.1% (77) |
| Ohio: | 1.2% (7,029) |
| Middletown: | 5.0% (75) |
| Ohio: | 11.6% (66,525) |
| Middletown: | 2.7% (40) |
| Ohio: | 0.0% (168) |
| Middletown: | 1.9% (29) |
| Ohio: | 2.6% (14,988) |
Place of birth for U.S.-born residents:
- This state: 39,604
- Other state: 8,669
- Northeast: 1,013
- Midwest: 1,963
- South: 4,556
- West: 1,087
85.3% of Middletown residents lived in the same house 1 years ago.
Out of people who lived in different houses, 32.7% lived in this county.
Out of people who lived in different counties, 81.6% lived in Ohio.
| Middletown: | 85.3% |
| State average: | 87.8% |
Education attainment for males 25 years and older:
- No schooling: 301
- Nursery to 4th grade: 87
- 5th and 6th grade: 70
- 7th and 8th grade: 232
- 9th grade: 408
- 10th grade: 477
- 11th grade: 436
- 12th grade, no diploma: 459
- High school graduate (or equivalency): 6,369
- Less than 1 year of college: 1,361
- Some college more than 1 year, no degree: 1,879
- Associate degree: 1,390
- Bachelor's degree: 1,886
- Master's degree: 574
- Professional school degree: 242
- Doctorate degree: 83

Education attainment for females 25 years and older:
- No schooling: 214
- Nursery to 4th grade: 41
- 5th and 6th grade: 19
- 7th and 8th grade: 345
- 9th grade: 320
- 10th grade: 530
- 11th grade: 884
- 12th grade, no diploma: 577
- High school graduate (or equivalency): 6,567
- Less than 1 year of college: 1,951
- Some college more than 1 year, no degree: 2,011
- Associate degree: 1,509
- Bachelor's degree: 1,880
- Master's degree: 924
- Professional school degree: 66
- Doctorate degree: 163


Housing units in structures:
- One, detached: 15,537
- One, attached: 1,543
- Two: 756
- 3 or 4: 1,338
- 5 to 9: 1,111
- 10 to 19: 1,340
- 20 to 49: 322
- 50 or more: 756
- Mobile homes: 302
- Boats, RVs, vans, etc.: 44
Median worth of mobile homes: $6,710
Housing units lacking complete kitchen facilities in 2022: 3.5%
House/condo owner moved in on average 11 years ago
Renter moved in on average 2 years ago


- 72.5%Utility gas
- 24.7%Electricity
- 1.1%Bottled, tank, or LP gas
- 0.8%Fuel oil, kerosene, etc.
- 0.6%Wood
- 0.2%Other fuel
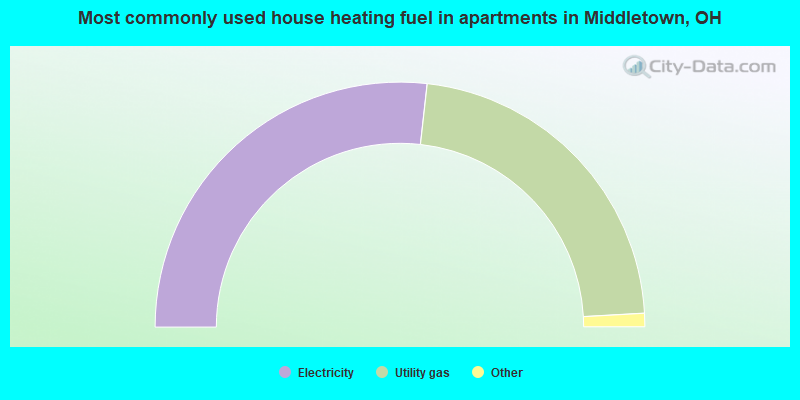
- 53.6%Electricity
- 44.7%Utility gas
- 0.7%Bottled, tank, or LP gas
- 0.6%No fuel used
- 0.4%Other fuel
- 0.1%Fuel oil, kerosene, etc.
Private vs. public school enrollment:
| Here: | 19.7% |
| Ohio: | 16.0% |
| Here: | 14.5% |
| Ohio: | 13.1% |
| Here: | 14.2% |
| Ohio: | 22.3% |


