Midway, TN (Tennessee) Houses and Residents
| Midway: | $250,355 |
| Tennessee: | $284,800 |
Total population: 2,704 (Urban population: 1,896, Rural population: 950 (43 farm, 907 nonfarm))
Houses: 1,151 (1,140 occupied: 832 owner occupied, 308 renter occupied)
| % of renters here: | 27% |
| State: | 33% |
Housing density: 186 houses/condos per square mile
Median price asked for vacant for-sale houses and condos in 2022 in this county: $342,342.
Median contract rent in 2022: $862 (lower quartile is $568, upper quartile is $999)
Median rent asked for vacant for-rent units in 2022: $798
Median gross rent in Midway, TN in 2022: $1,031
Housing units in Midway with a mortgage: 359 (31 second mortgage, 33 home equity loan, 0 both second mortgage and home equity loan)
Houses without a mortgage: 280


Latest news about housing in Midway, TN collected exclusively by city-data.com from local newspapers, TV, and radio stations

 | Tell us about Eastern Tennessee (38 replies) |
| The Pinnacle in Bristol, TN (174 replies) |
| renting in Greeneville or Tusculum (6 replies) |
| Relocation: Greenville, tn (2 replies) |
| Vacation Lake Watauga Can we pull our boat there? (3 replies) |
| Daycares between Kingsport and JC (2 replies) |

Household type by relationship:
Households: 118,330- In family households: 94,660 (23,497 male householders, 8,822 female householders)
24,570 spouses, 29,839 children (27,230 natural, 912 adopted, 1,697 stepchildren), 2,427 grandchildren, 849 brothers or sisters, 812 parents, foster children, 959 other relatives, 2,263 non-relatives
- In nonfamily households: 23,670 (8,833 male householders (6,790 living alone)), 10,170 female householders (8,536 living alone)), 4,667 nonrelatives
- In group quarters: 4,649 (1,446 institutionalized population)
15,721 married couples with children.
5,069 single-parent households (1,053 men, 4,016 women).
98.0% of residents of Midway speak English at home.
1.6% of residents speak Spanish at home (79% speak English very well, 21% speak English well).
0.4% of residents speak other Indo-European language at home (100% speak English very well).
Foreign born population: 49 (1.4%)
(0.0% of them are naturalized citizens)
| Here: | 5.7 |
| State: | 6.5 |
| Here: | 4.3 |
| State: | 4.4 |

- Bedrooms in owner-occupied houses and condos in Midway, Tennessee
- 0no bedroom
- 241 bedroom
- 1862 bedrooms
- 5093 bedrooms
- 924 bedrooms
- 215+ bedrooms

- Bedrooms in renter-occupied apartments in Midway, Tennessee
- 7no bedroom
- 461 bedroom
- 1722 bedrooms
- 553 bedrooms
- 284 bedrooms
- 05+ bedrooms

- Cars and other vehicles available in Midway in owner-occupied houses/condos
- 37no vehicle
- 1891 vehicle
- 3992 vehicles
- 1593 vehicles
- 214 vehicles
- 275+ vehicles

- Cars and other vehicles available in Midway in renter-occupied apartments
- 9no vehicle
- 1471 vehicle
- 1242 vehicles
- 223 vehicles
- 64 vehicles
- 05+ vehicles

- Rooms in owner-occupied houses in Midway, Tennessee
- 01 room
- 02 rooms
- 83 rooms
- 1054 rooms
- 2315 rooms
- 2436 rooms
- 1097 rooms
- 568 rooms
- 809+ rooms

- Rooms in renter-occupied apartments in Midway, Tennessee
- 71 room
- 202 rooms
- 193 rooms
- 1404 rooms
- 395 rooms
- 526 rooms
- 317 rooms
- 08 rooms
- 09+ rooms


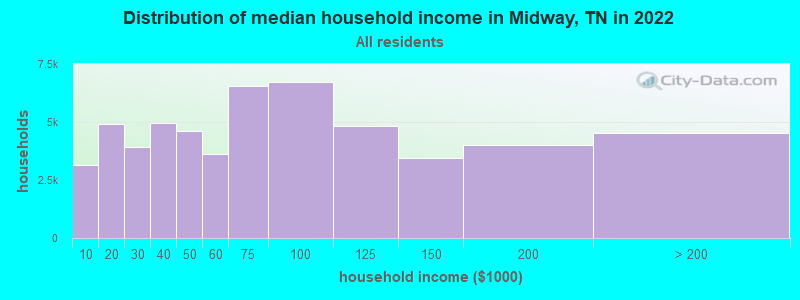
Midway, TN household income distribution

- 3,132Less than $10,000
- 4,909$10,000 to $19,999
- 3,941$20,000 to $29,999
- 4,948$30,000 to $39,999
- 4,612$40,000 to $49,999
- 3,640$50,000 to $59,999
- 6,540$60,000 to $74,999
- 6,704$75,000 to $99,999
- 4,831$100,000 to $124,999
- 3,443$125,000 to $149,999
- 3,991$150,000 to $199,999
- 4,506$200,000 or more
Percentage of workers working in this county: 83.1%
Number of people working at home: 235 (13.3% of all workers)
Travel time to work (commute)
- Less than 5 minutes: 31
- 5 to 9 minutes: 79
- 10 to 14 minutes: 321
- 15 to 19 minutes: 353
- 20 to 24 minutes: 239
- 25 to 29 minutes: 48
- 30 to 34 minutes: 108
- 35 to 39 minutes: 35
- 40 to 44 minutes: 7
- 45 to 59 minutes: 38
- 60 to 89 minutes: 61
- 90 or more minutes: 27
Means of transportation to work:
- Drove a car alone: 1,157 (83.9%)
- Carpooled: 182 (13.2%)
- Walked: 8 (0.6%)
- Worked at home: 32 (2.3%)


- Year of entry for the foreign-born population in Midway, Tennessee
- 01995 to March 2000
- 01990 to 1994
- 91985 to 1989
- 01980 to 1984
- 01975 to 1979
- 01970 to 1974
- 101965 to 1969
- 0Before 1965

First ancestries reported:
- United States: 805 (33.1%)
- Other: 430 (17.7%)
- Irish: 261 (10.7%)
- English: 250 (10.3%)
- German: 221 (9.1%)
- Scotch-Irish: 171 (7.0%)
- Dutch: 72 (3.0%)
- Scottish: 71 (2.9%)
- French: 50 (2.1%)
- Norwegian: 41 (1.7%)
- Italian: 24 (1.0%)
- Polish: 20 (0.8%)
- Swedish: 8 (0.3%)
- Welsh: 7 (0.3%)
Most common places of birth for foreign-born residents (%):
| Midway: | 52.6% (10) |
| Tennessee: | 5.2% (8,316) |
| Midway: | 47.4% (9) |
| Tennessee: | 28.1% (44,682) |
Place of birth for U.S.-born residents:
- This state: 2,033
- Other state: 787
- Northeast: 134
- Midwest: 120
- South: 501
- West: 32
63% of Midway residents lived in the same house 5 years ago.
Out of people who lived in different houses, 67% lived in this county.
Out of people who lived in different counties, 28% lived in Tennessee.
Education attainment for males 25 years and older:
- No schooling: 0
- Nursery to 4th grade: 9
- 5th and 6th grade: 8
- 7th and 8th grade: 81
- 9th grade: 25
- 10th grade: 37
- 11th grade: 22
- 12th grade, no diploma: 33
- High school graduate (or equivalency): 330
- Less than 1 year of college: 51
- Some college more than 1 year, no degree: 137
- Associate degree: 17
- Bachelor's degree: 112
- Master's degree: 39
- Professional school degree: 7
- Doctorate degree: 10

Education attainment for females 25 years and older:
- No schooling: 6
- Nursery to 4th grade: 8
- 5th and 6th grade: 15
- 7th and 8th grade: 61
- 9th grade: 22
- 10th grade: 49
- 11th grade: 67
- 12th grade, no diploma: 5
- High school graduate (or equivalency): 405
- Less than 1 year of college: 62
- Some college more than 1 year, no degree: 133
- Associate degree: 27
- Bachelor's degree: 135
- Master's degree: 23
- Professional school degree: 7
- Doctorate degree: 0


Housing units in structures:
- One, detached: 814
- One, attached: 9
- Two: 10
- 3 or 4: 21
- 5 to 9: 22
- 10 to 19: 27
- Mobile homes: 248
Median worth of mobile homes: $44,200
Housing units lacking complete kitchen facilities: 1.2%

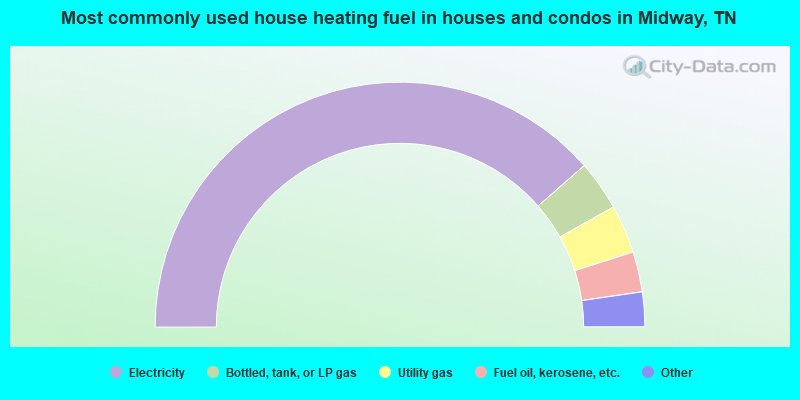
- 77.2%Electricity
- 6.6%Bottled, tank, or LP gas
- 6.4%Utility gas
- 5.3%Fuel oil, kerosene, etc.
- 3.5%Wood
- 1.1%Coal or coke
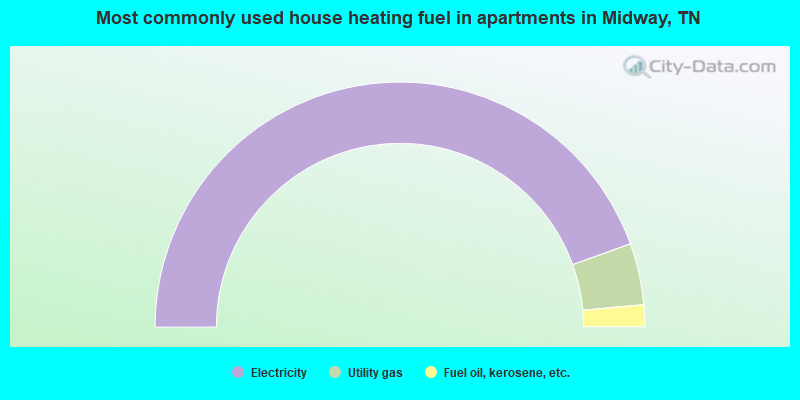
- 89.0%Electricity
- 8.1%Utility gas
- 2.9%Fuel oil, kerosene, etc.
Private vs. public school enrollment:
| Here: | 13.4% |
| Tennessee: | 9.5% |
| Here: | 0.0% |
| Tennessee: | 10.4% |
| Here: | 19.1% |
| Tennessee: | 22.8% |


