Milford, IL (Illinois) Houses and Residents
| Milford: | $61,453 |
| Illinois: | $251,600 |
Total population: 1,254 (Urban population: 0, Rural population: 1,364 (all nonfarm))
Houses: 654 (554 occupied: 417 owner occupied, 144 renter occupied)
| % of renters here: | 26% |
| State: | 33% |
Housing density: 1,035 houses/condos per square mile
Median price asked for vacant for-sale houses and condos in 2022: $41,689.
Median contract rent in 2022: $500 (lower quartile is $459, upper quartile is $590)
Median rent asked for vacant for-rent units in 2022: $530
Median gross rent in Milford, IL in 2022: $708
Housing units in Milford with a mortgage: 233 (23 second mortgage, 0 home equity loan, 7 both second mortgage and home equity loan)
Houses without a mortgage: 0
Median household income for houses/condos with a mortgage: $54,492
Median household income for apartments without a mortgage: $46,080
Median monthly housing costs: $706
Compare current foreclosures near Milford, IL:
| Photo | Address | Area | Beds / Baths | Price | Details |
|---|---|---|---|---|---|

|
#1
W Jones St
Milford, IL 60953
|
- sq. feet
|
1 baths 4 beds |
show details | |

|
#2
N Walnut St
Milford, IL 60953
|
2 sq. feet
|
2 baths 3 beds |
show details | |

|
#3
W Koplin Ave
Cissna Park, IL 60924
|
1,100 sq. feet
|
1 baths 2 beds |
$67,500
|
show details |

|
#4
N Chicago St
Watseka, IL 60970
|
- sq. feet
|
- baths - beds |
$27,900
|
show details |

|
#5
N Chestnut St
Earl Park, IN 47942
|
1,748 sq. feet
|
1 baths 4 beds |
show details | |

|
#6
W Garfield Ave
Cissna Park, IL 60924
|
1,608 sq. feet
|
2 baths 3 beds |
show details | |

|
#7
E Washington St
Hoopeston, IL 60942
|
1,968 sq. feet
|
2 baths 3 beds |
show details | |

|
#8
E Thompson Ave
Hoopeston, IL 60942
|
1,476 sq. feet
|
2 baths 2 beds |
show details | |

|
#9
N 2nd St
Watseka, IL 60970
|
- sq. feet
|
2 baths 3 beds |
show details | |

|
#10
E Ray St
Kentland, IN 47951
|
1,996 sq. feet
|
1 baths 2 beds |
show details |
| Photo | Address | Area | Beds / Baths | Price | Details |
|---|---|---|---|---|---|

|
#11
N 6th St
Kentland, IN 47951
|
1,389 sq. feet
|
1 baths 3 beds |
show details | |

|
#12
Yount Ave
Watseka, IL 60970
|
- sq. feet
|
- baths - beds |
show details | |

|
#13
S 4th St
Hoopeston, IL 60942
|
- sq. feet
|
- baths - beds |
show details | |

|
#14
E 5th Ave
Rankin, IL 60960
|
- sq. feet
|
- baths - beds |
show details | |

|
#15
E Mulberry St
Watseka, IL 60970
|
- sq. feet
|
- baths - beds |
show details | |

|
#16
W 4th Ave
Rankin, IL 60960
|
- sq. feet
|
- baths - beds |
show details | |

|
#17
S Western Ave
Watseka, IL 60970
|
- sq. feet
|
- baths - beds |
show details | |

|
#18
E Washington St
Hoopeston, IL 60942
|
- sq. feet
|
- baths - beds |
show details | |

|
#19
W Penn St
Hoopeston, IL 60942
|
- sq. feet
|
- baths - beds |
show details | |

|
#20
N Wabash St
Watseka, IL 60970
|
- sq. feet
|
- baths - beds |
show details |
| Photo | Address | Area | Beds / Baths | Price | Details |
|---|---|---|---|---|---|

|
#21
N Boughton St
Watseka, IL 60970
|
- sq. feet
|
- baths - beds |
show details | |

|
#22
E Lincoln St
Hoopeston, IL 60942
|
- sq. feet
|
- baths - beds |
show details | |

|
#23
E Maple St
Hoopeston, IL 60942
|
- sq. feet
|
- baths - beds |
show details | |

|
#24
S 4th St
Hoopeston, IL 60942
|
- sq. feet
|
- baths - beds |
show details | |

|
#25
Judson Ave
Hoopeston, IL 60942
|
- sq. feet
|
- baths - beds |
show details | |

|
Check over 1 million property listings on Foreclosure.com!
|
browse all offers | |||

Latest news about housing in Milford, IL collected exclusively by city-data.com from local newspapers, TV, and radio stations

 | Naperville? What else? (31 replies) |
| Rockford IL good or bad (193 replies) |
| Young Professional moving to Rockford Region (1 reply) |
| Should we relocate from Naperville to CT for family? (9 replies) |
| where to live in or near Rockford (6 replies) |
| Want to make the move...but (33 replies) |

Median year apartment built: 1973
Household type by relationship:
Households: 1,228- Male householders: 216 (72 living alone), Female householders: 327 (132 living alone)
195 spouses (195 opposite-sex spouses), 57 unmarried partners, (57 opposite-sex unmarried partners), 333 children (309 natural, 11 adopted, 11 stepchildren), 32 grandchildren, 7 brothers or sisters, 4 parents, 0 foster children, 33 other relatives, 19 non-relatives
Size of family households: 137 2-persons, 76 3-persons, 58 4-persons, 16 5-persons, 16 6-persons.
Size of nonfamily households: 216 1-person, 37 2-persons, 5 4-persons.
149 married couples with children.
76 single-parent households (9 men, 67 women).
97.8% of residents of Milford speak English at home.
1.0% of residents speak Spanish at home (42% speak English very well, 58% speak English not well).
0.7% of residents speak other Indo-European language at home (100% speak English well).
Foreign born population: 26 (2.1%)
(100.0% of them are naturalized citizens)
| Here: | 6.2 |
| State: | 6.4 |
| Here: | 4.2 |
| State: | 4.1 |

- Bedrooms in owner-occupied houses and condos in Milford, Illinois
- 0no bedroom
- 171 bedroom
- 1082 bedrooms
- 2083 bedrooms
- 424 bedrooms
- 435+ bedrooms

- Bedrooms in renter-occupied apartments in Milford, Illinois
- 0no bedroom
- 311 bedroom
- 912 bedrooms
- 233 bedrooms
- 04 bedrooms
- 05+ bedrooms

- Cars and other vehicles available in Milford in owner-occupied houses/condos
- 23no vehicle
- 1401 vehicle
- 1882 vehicles
- 373 vehicles
- 244 vehicles
- 45+ vehicles

- Cars and other vehicles available in Milford in renter-occupied apartments
- 12no vehicle
- 781 vehicle
- 542 vehicles
- 03 vehicles
- 04 vehicles
- 05+ vehicles

- Rooms in owner-occupied houses in Milford, Illinois
- 01 room
- 02 rooms
- 83 rooms
- 244 rooms
- 785 rooms
- 1476 rooms
- 427 rooms
- 728 rooms
- 469+ rooms

- Rooms in renter-occupied apartments in Milford, Illinois
- 01 room
- 02 rooms
- 343 rooms
- 494 rooms
- 345 rooms
- 206 rooms
- 87 rooms
- 08 rooms
- 09+ rooms


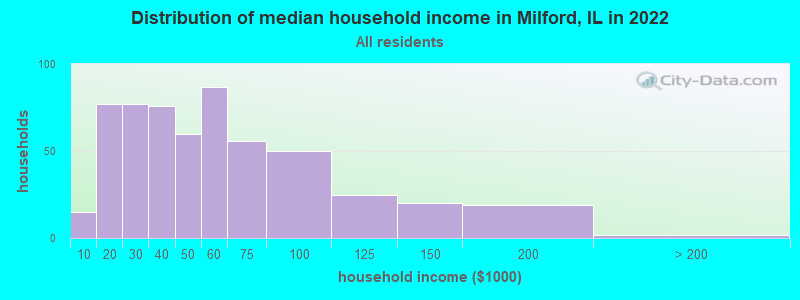
Milford, IL household income distribution

- 15Less than $10,000
- 77$10,000 to $19,999
- 77$20,000 to $29,999
- 76$30,000 to $39,999
- 60$40,000 to $49,999
- 87$50,000 to $59,999
- 56$60,000 to $74,999
- 50$75,000 to $99,999
- 25$100,000 to $124,999
- 20$125,000 to $149,999
- 19$150,000 to $199,999
- 2$200,000 or more
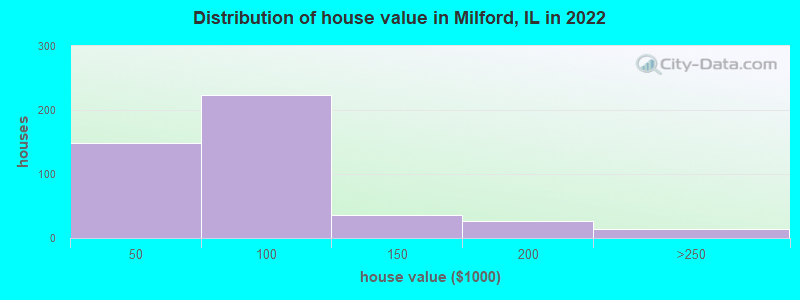
Home value of owner - occupied houses in 2022 in Milford, IL
-
- 4Less than $10,000
- 25$10,000 to $14,999
- 10$25,000 to $29,999
- 23$30,000 to $34,999
- 35$35,000 to $39,999
- 48$40,000 to $49,999
- 55$50,000 to $59,999
- 36$60,000 to $69,999
- 43$70,000 to $79,999
- 22$80,000 to $89,999
- 15$90,000 to $99,999
- 23$100,000 to $124,999
- 12$125,000 to $149,999
- 12$150,000 to $174,999
- 13$175,000 to $199,999
- 9$200,000 to $249,999
- 4$250,000 to $299,999
Rent paid by renters in 2022 in Milford, IL
-
- 7$100 to $149
- 3$150 to $199
- 3$200 to $249
- 3$250 to $299
- 4$400 to $449
- 37$450 to $499
- 18$500 to $549
- 17$550 to $599
- 11$600 to $649
- 12$650 to $699
- 8$800 to $899
- 7No cash rent


Percentage of workers working in this county: 72.4%
Number of people working at home: 27 (5.2% of all workers)
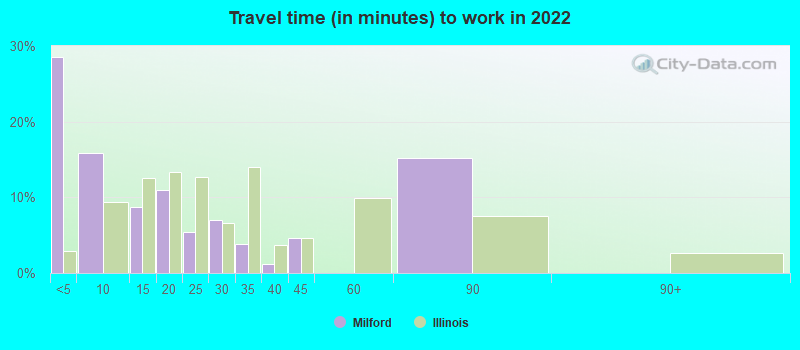
Travel time to work (commute)
- Less than 5 minutes: 61
- 5 to 9 minutes: 35
- 10 to 14 minutes: 58
- 15 to 19 minutes: 151
- 20 to 24 minutes: 58
- 25 to 29 minutes: 9
- 30 to 34 minutes: 28
- 35 to 39 minutes: 10
- 40 to 44 minutes: 2
- 45 to 59 minutes: 33
- 60 to 89 minutes: 9
- 90 or more minutes: 18
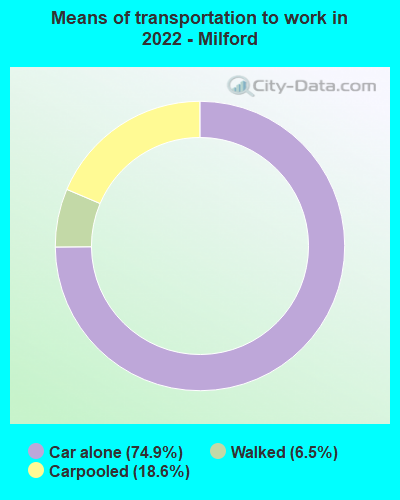
Means of transportation to work:
- Drove a car alone: 206 (64.8%)
- Carpooled: 51 (16.0%)
- Walked: 17 (5.3%)
- Worked at home: 65 (20.4%)

- Unemployment by race in 2022
- Unemployment rate for White non-Hispanic residents
- 4.1%Males
- 1.7%Females

- Year of entry for the foreign-born population in Milford, Illinois
- 02010 or later
- 02000 to 2009
- 01990 to 1999
- 01980 to 1989
- 31970 to 1979
- 6Before 1970

First ancestries reported:
- German: 189 (34.3%)
- English: 87 (15.8%)
- American: 75 (13.6%)
- European: 52 (9.4%)
- French: 15 (2.7%)
- Irish: 11 (2.0%)
- Italian: 8 (1.5%)
- Norwegian: 6 (1.1%)
- African: 6 (1.1%)
- Polish: 5 (0.9%)
- Welsh: 4 (0.7%)
- Dutch: 3 (0.5%)
- Swedish: 1 (0.2%)
Most common places of birth for foreign-born residents (%):
| Milford: | 69.2% (18) |
| Illinois: | 0.5% (8,551) |
| Milford: | 23.1% (6) |
| Illinois: | 0.3% (5,895) |
Place of birth for U.S.-born residents:
- This state: 937
- Other state: 251
- Northeast: 20
- Midwest: 172
- South: 38
- West: 21
83.3% of Milford residents lived in the same house 1 years ago.
Out of people who lived in different houses, 46.1% lived in this county.
Out of people who lived in different counties, 100.0% lived in Illinois.
| Milford: | 83.3% |
| State average: | 88.3% |
Education attainment for males 25 years and older:
- No schooling: 5
- Nursery to 4th grade: 0
- 5th and 6th grade: 0
- 7th and 8th grade: 0
- 9th grade: 0
- 10th grade: 32
- 11th grade: 23
- 12th grade, no diploma: 6
- High school graduate (or equivalency): 132
- Less than 1 year of college: 32
- Some college more than 1 year, no degree: 54
- Associate degree: 32
- Bachelor's degree: 44
- Master's degree: 19
- Professional school degree: 0
- Doctorate degree: 0

Education attainment for females 25 years and older:
- No schooling: 25
- Nursery to 4th grade: 7
- 5th and 6th grade: 0
- 7th and 8th grade: 10
- 9th grade: 8
- 10th grade: 10
- 11th grade: 12
- 12th grade, no diploma: 5
- High school graduate (or equivalency): 134
- Less than 1 year of college: 53
- Some college more than 1 year, no degree: 52
- Associate degree: 37
- Bachelor's degree: 91
- Master's degree: 12
- Professional school degree: 0
- Doctorate degree: 0


Housing units in structures:
- One, detached: 564
- One, attached: 3
- Two: 24
- 3 or 4: 15
- 5 to 9: 20
- 10 to 19: 11
- Mobile homes: 16
Housing units lacking complete kitchen facilities in 2022: 2.0%
House/condo owner moved in on average 14 years ago
Renter moved in on average 6 years ago

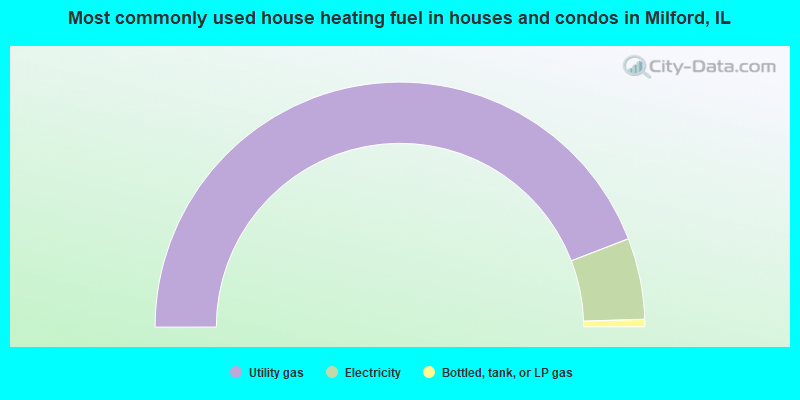
- 88.3%Utility gas
- 10.7%Electricity
- 1.0%Bottled, tank, or LP gas
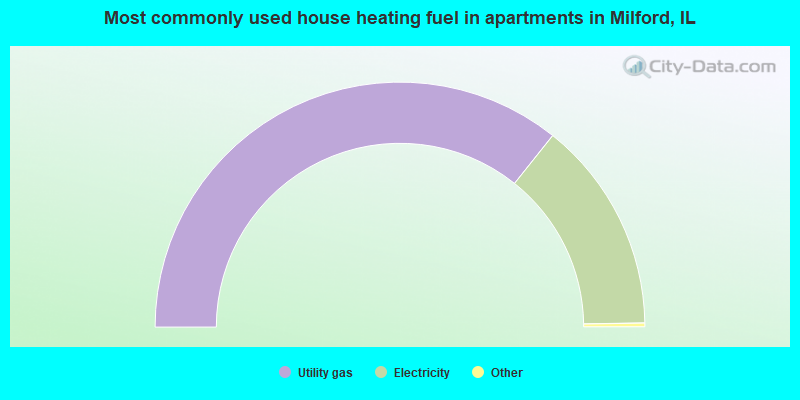
- 71.8%Utility gas
- 28.2%Electricity
Private vs. public school enrollment:
| Here: | 42.1% |
| Illinois: | 13.3% |
| Here: | 0.0% |
| Illinois: | 9.9% |
| Here: | 0.0% |
| Illinois: | 27.4% |


