Milford, MA (Massachusetts) Houses and Residents
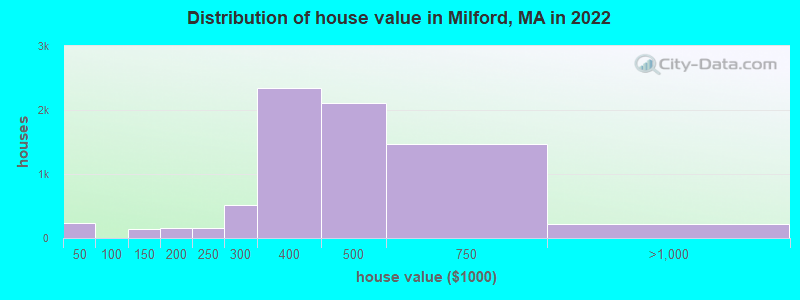
Estimated median house or condo value in 2022: $421,882 (it was $165,600 in 2000 )
Milford:
$421,882Massachusetts:
$534,700
Lower value quartile - upper value quartile: $349,250 - $532,326Mean price in 2022: Detached houses: $473,041 Here:
$473,041State:
$651,570
Townhouses or other attached units: $416,166 Here:
$416,166State:
$617,749
In 2-unit structures: $360,580 Here:
$360,580State:
$594,808
In 3-to-4-unit structures: $291,666 Here:
$291,666State:
$601,912
In 5-or-more-unit structures: $249,034 Here:
$249,034State:
$555,768
Total population: 25,055 (Urban population: 24,179, Rural population: 128 (all nonfarm) )
Houses: 11,072 (10,596 occupied: 7,257 owner occupied, 3,460 renter occupied )
% of renters here:
32%State:
38%
Housing density: 1,110 houses/condos per square mile
Median price asked for vacant for-sale houses and condos in 2022: $762,388.
Median contract rent in 2022: $1,439 (lower quartile is $1,043, upper quartile is $1,922)
Median rent asked for vacant for-rent units in 2022: $1,117
Median gross rent in Milford, MA in 2022: $1,663
Housing units in Milford with a mortgage: 4,853 (903 second mortgage, 18 home equity loan, 675 both second mortgage and home equity loan )Houses without a mortgage: 152
Median household income for houses/condos with a mortgage: $125,258
Median household income for apartments without a mortgage: $70,530
Median monthly housing costs: $1,770
Data:
Median house or condo value ($)
Median house or condo value ($ change since 2000)
Median house or condo value ($) - White
Median house or condo value ($) - Black or African American
Median house or condo value ($) - Asian
Median house or condo value ($) - Hispanic or Latino
Median house or condo value ($) - American Indian and Alaska Native
Median house or condo value ($) - Multirace
Median house or condo value ($) - Other Race
Median price asked for mobile homes ($)
Household density (households per square mile)
Mean house or condo value by units in structure - 1, detached ($)
Mean house or condo value by units in structure - 1, attached ($)
Mean house or condo value by units in structure - 2 ($)
Mean house or condo value by units in structure by units in structure - 3 or 4 ($)
Mean house or condo value by units in structure - 5 or more ($)
Mean house or condo value by units in structure - Boat, RV, van, etc. ($)
Mean house or condo value by units in structure - Mobile home ($)
Median contract rent ($)
Median contract rent - Lower quartile ($)
Median contract rent - Upper quartile ($)
Median gross rent ($)
Urban houses (%)
Rural houses (%)
Houses occupied (%)
Houses occupied (% change since 2000)
Houses owner occupied (%)
Houses owner occupied (% change since 2000)
Houses renter occupied (%)
Houses renter occupied (% change since 2000)
Vacant housing units - For rent (%)
Vacant housing units - For rent (% change since 2000)
Vacant housing units - For sale only (%)
Vacant housing units - For sale only (% change since 2000)
Vacant housing units - Rented or sold, not occupied (%)
Vacant housing units - Rented or sold, not occupied (% change since 2000)
Vacant housing units - For seasonal, recreational, or occasional use (%)
Vacant housing units - For seasonal, recreational, or occasional use (% change since 2000)
Vacant housing units - For migrant workers (%)
Vacant housing units - For migrant workers (% change since 2000)
Vacant housing units - Other vacant (%)
Vacant housing units - Other vacant (% change since 2000)
Median monthly housing costs ($)
Median household income for houses/condos with a mortgage ($)
Median household income for houses/condos without a mortgage ($)
Median household income ($)
Median household income ($) - White
Median household income ($) - Black or African American
Median household income ($) - Asian
Median household income ($) - Hispanic or Latino
Median household income ($) - American Indian and Alaska Native
Median household income ($) - Multirace
Median household income ($) - Other Race
Mortgage status - with mortgage (%)
Mortgage status - with second mortgage (%)
Mortgage status - with home equity loan (%)
Mortgage status - with both second mortgage and home equity loan (%)
Mortgage status - without a mortgage (%)
Median year house/condo built
Median year apartment built
Household type by relationship - Male householder living alone (%)
Household type by relationship - Male householder not living alone (%)
Household type by relationship - Female householder living alone (%)
Household type by relationship - Female householder not living alone (%)
Household type by relationship - Opposite-Sex spouse (%)
Household type by relationship - Same-Sex spouse (%)
Household type by relationship - Opposite-Sex unmarried partner (%)
Household type by relationship - Same-Sex unmarried partner (%)
Household type by relationship - In group quarters (%)
Size of family households - 2-person household (%)
Size of family households - 3-person household (%)
Size of family households - 4-person household (%)
Size of family households - 5-person household (%)
Size of family households - 6-person household (%)
Size of family households - 7-or-more-person household (%)
Size of nonfamily households - 1-person household (%)
Size of nonfamily households - 2-person household (%)
Size of nonfamily households - 3-person household (%)
Size of nonfamily households - 4-person household (%)
Size of nonfamily households - 5-person household (%)
Size of nonfamily households - 6-person household (%)
Size of nonfamily households - 7-or-moreperson household (%)
Year house built - Built 2010 or later (%)
Year house built - Built 2000 to 2009 (%)
Year house built - Built 1990 to 1999 (%)
Year house built - Built 1980 to 1989 (%)
Year house built - Built 1970 to 1979 (%)
Year house built - Built 1960 to 1969 (%)
Year house built - Built 1950 to 1959 (%)
Year house built - Built 1940 to 1949 (%)
Year house built - Built 1939 or earlier (%)
Median number of rooms in houses and condos
Median number of rooms in apartments
Median number of bedrooms in owner occupied houses
Mean number of bedrooms in owner occupied houses
Median number of bedrooms in renter occupied houses
Mean number of bedrooms in renter occupied houses
Median number of vehichles in owner occupied houses
Mean number of vehichles in owner occupied houses
Median number of vehichles in renter occupied houses
Mean number of vehichles in renter occupied houses
Rooms in owner-occupied houses - 1 room (%)
Rooms in owner-occupied houses - 2 rooms (%)
Rooms in owner-occupied houses - 3 rooms (%)
Rooms in owner-occupied houses - 4 rooms (%)
Rooms in owner-occupied houses - 5 rooms (%)
Rooms in owner-occupied houses - 6 rooms (%)
Rooms in owner-occupied houses - 7 rooms (%)
Rooms in owner-occupied houses - 8 rooms (%)
Rooms in owner-occupied houses - 9+ rooms (%)
Rooms in renter-occupied houses - 1 room (%)
Rooms in renter-occupied houses - 2 rooms (%)
Rooms in renter-occupied houses - 3 rooms (%)
Rooms in renter-occupied houses - 4 rooms (%)
Rooms in renter-occupied houses - 5 rooms (%)
Rooms in renter-occupied houses - 6 rooms (%)
Rooms in renter-occupied houses - 7 rooms (%)
Rooms in renter-occupied houses - 8 rooms (%)
Rooms in renter-occupied houses - 9+ rooms (%)
Bedrooms in owner-occupied houses - no bedrooms (%)
Bedrooms in owner-occupied houses - 1 bedroom (%)
Bedrooms in owner-occupied houses - 2 bedrooms (%)
Bedrooms in owner-occupied houses - 3 bedrooms (%)
Bedrooms in owner-occupied houses - 4 bedrooms (%)
Bedrooms in owner-occupied houses - 5+ bedrooms (%)
Bedrooms in renter-occupied houses - no bedrooms (%)
Bedrooms in renter-occupied houses - 1 bedroom (%)
Bedrooms in renter-occupied houses - 2 bedrooms (%)
Bedrooms in renter-occupied houses - 3 bedrooms (%)
Bedrooms in renter-occupied houses - 4 bedrooms (%)
Bedrooms in renter-occupied houses - 5+ bedrooms (%)
Vehicles available in owner-occupied houses - no vehicle available (%)
Vehicles available in owner-occupied houses - 1 vehicle available(%)
Vehicles available in owner-occupied houses - 2 Vehicles available (%)
Vehicles available in owner-occupied houses - 3 Vehicles available (%)
Vehicles available in owner-occupied houses - 4 Vehicles available (%)
Vehicles available in owner-occupied houses - 5+ Vehicles available (%)
Vehicles available in renter-occupied houses - no vehicle available (%)
Vehicles available in renter-occupied houses - 1 vehicle available (%)
Vehicles available in renter-occupied houses - 2 Vehicles available (%)
Vehicles available in renter-occupied houses - 3 Vehicles available (%)
Vehicles available in renter-occupied houses - 4 Vehicles available (%)
Vehicles available in renter-occupied houses - 5+ Vehicles available (%)
Housing units in structures - 1, detached (%)
Housing units in structures - 1, attached (%)
Housing units in structures - 2 (%)
Housing units in structures - 3 or 4 (%)
Housing units in structures - 5 to 9 (%)
Housing units in structures - 10 to 19 (%)
Housing units in structures - 20 to 49 (%)
Housing units in structures - 50 or more (%)
Housing units in structures - Mobile home (%)
Housing units in structures - Boat, RV, van, etc. (%)
Housing units in structures - Owners - 1, detached (%)
Housing units in structures - Owners - 1, attached (%)
Housing units in structures - Owners - 2 (%)
Housing units in structures - Owners - 3 or 4 (%)
Housing units in structures - Owners - 5 to 9 (%)
Housing units in structures - Owners - 10 to 19 (%)
Housing units in structures - Owners - 20 to 49 (%)
Housing units in structures - Owners - 50 or more (%)
Housing units in structures - Owners - Mobile home (%)
Housing units in structures - Owners - Boat, RV, van, etc. (%)
Housing units in structures - Renters - 1, detached (%)
Housing units in structures - Renters - 1, attached (%)
Housing units in structures - Renters - 2 (%)
Housing units in structures - Renters - 3 or 4 (%)
Housing units in structures - Renters - 5 to 9 (%)
Housing units in structures - Renters - 10 to 19 (%)
Housing units in structures - Renters - 20 to 49 (%)
Housing units in structures - Renters - 50 or more (%)
Housing units in structures - Renters - Mobile home (%)
Housing units in structures - Renters - Boat, RV, van, etc. (%)
House/condo owner moved in on average (years ago)
Renter moved in on average (years ago)
Year householder moved into unit - Moved in 1999 to March 2000 (%)
Year householder moved into unit - Moved in 1999 to March 2000 (%) - White
Year householder moved into unit - Moved in 1999 to March 2000 (%) - Black or African American
Year householder moved into unit - Moved in 1999 to March 2000 (%) - Asian
Year householder moved into unit - Moved in 1999 to March 2000 (%) - Hispanic or Latino
Year householder moved into unit - Moved in 1999 to March 2000 (%) - American Indian and Alaska Native
Year householder moved into unit - Moved in 1999 to March 2000 (%) - Multirace
Year householder moved into unit - Moved in 1999 to March 2000 (%) - Other Race
Year householder moved into unit - Moved in 1995 to 1998 (%)
Year householder moved into unit - Moved in 1995 to 1998 (%) - White
Year householder moved into unit - Moved in 1995 to 1998 (%) - Black or African American
Year householder moved into unit - Moved in 1995 to 1998 (%) - Asian
Year householder moved into unit - Moved in 1995 to 1998 (%) - Hispanic or Latino
Year householder moved into unit - Moved in 1995 to 1998 (%) - American Indian and Alaska Native
Year householder moved into unit - Moved in 1995 to 1998 (%) - Multirace
Year householder moved into unit - Moved in 1995 to 1998 (%) - Other Race
Year householder moved into unit - Moved in 1990 to 1994 (%)
Year householder moved into unit - Moved in 1990 to 1994 (%) - White
Year householder moved into unit - Moved in 1990 to 1994 (%) - Black or African American
Year householder moved into unit - Moved in 1990 to 1994 (%) - Asian
Year householder moved into unit - Moved in 1990 to 1994 (%) - Hispanic or Latino
Year householder moved into unit - Moved in 1990 to 1994 (%) - American Indian and Alaska Native
Year householder moved into unit - Moved in 1990 to 1994 (%) - Multirace
Year householder moved into unit - Moved in 1990 to 1994 (%) - Other Race
Year householder moved into unit - Moved in 1980 to 1989 (%)
Year householder moved into unit - Moved in 1980 to 1989 (%) - White
Year householder moved into unit - Moved in 1980 to 1989 (%) - Black or African American
Year householder moved into unit - Moved in 1980 to 1989 (%) - Asian
Year householder moved into unit - Moved in 1980 to 1989 (%) - Hispanic or Latino
Year householder moved into unit - Moved in 1980 to 1989 (%) - American Indian and Alaska Native
Year householder moved into unit - Moved in 1980 to 1989 (%) - Multirace
Year householder moved into unit - Moved in 1980 to 1989 (%) - Other Race
Year householder moved into unit - Moved in 1970 to 1979 (%)
Year householder moved into unit - Moved in 1970 to 1979 (%) - White
Year householder moved into unit - Moved in 1970 to 1979 (%) - Black or African American
Year householder moved into unit - Moved in 1970 to 1979 (%) - Asian
Year householder moved into unit - Moved in 1970 to 1979 (%) - Hispanic or Latino
Year householder moved into unit - Moved in 1970 to 1979 (%) - American Indian and Alaska Native
Year householder moved into unit - Moved in 1970 to 1979 (%) - Multirace
Year householder moved into unit - Moved in 1970 to 1979 (%) - Other Race
Year householder moved into unit - Moved in 1969 or earlier (%)
Year householder moved into unit - Moved in 1969 or earlier (%) - White
Year householder moved into unit - Moved in 1969 or earlier (%) - Black or African American
Year householder moved into unit - Moved in 1969 or earlier (%) - Asian
Year householder moved into unit - Moved in 1969 or earlier (%) - Hispanic or Latino
Year householder moved into unit - Moved in 1969 or earlier (%) - American Indian and Alaska Native
Year householder moved into unit - Moved in 1969 or earlier (%) - Multirace
Year householder moved into unit - Moved in 1969 or earlier (%) - Other Race
Housing units lacking complete plumbing facilities (%)
Housing units lacking complete kitchen facilities (%)
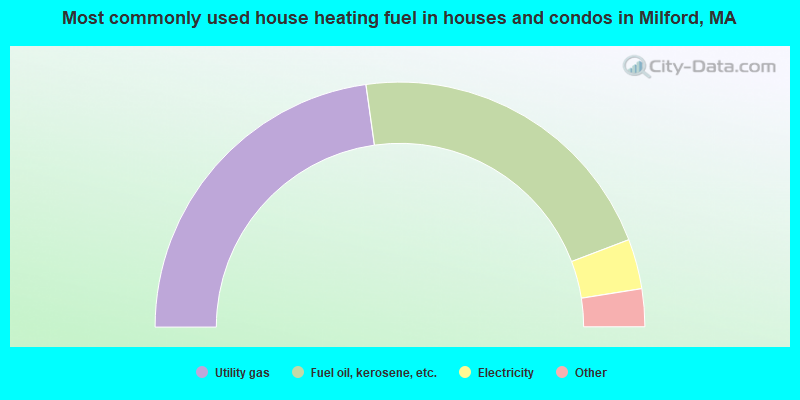
House heating fuel used in houses and condos - Utility gas (%)
House heating fuel used in houses and condos - Bottled, tank, or LP gas (%)
House heating fuel used in houses and condos - Electricity (%)
House heating fuel used in houses and condos - Fuel oil, kerosene, etc. (%)
House heating fuel used in houses and condos - Coal or coke (%)
House heating fuel used in houses and condos - Wood (%)
House heating fuel used in houses and condos - Solar energy (%)
House heating fuel used in houses and condos - Other fuel (%)
House heating fuel used in houses and condos - No fuel used (%)
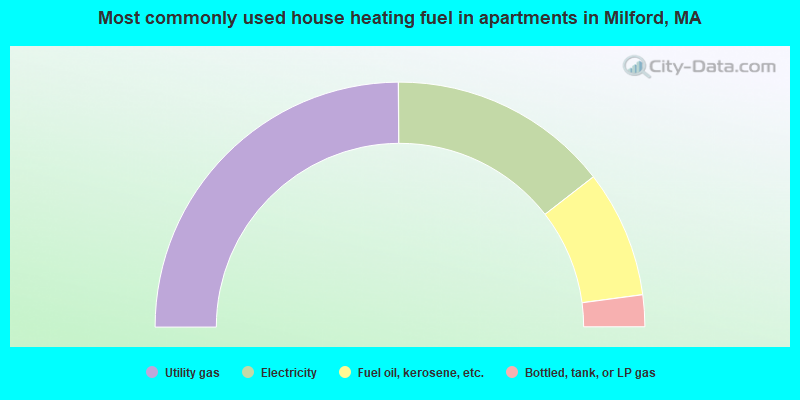
House heating fuel used in apartments - Utility gas (%)
House heating fuel used in apartments - Bottled, tank, or LP gas (%)
House heating fuel used in apartments - Electricity (%)
House heating fuel used in apartments - Fuel oil, kerosene, etc. (%)
House heating fuel used in apartments - Coal or coke (%)
House heating fuel used in apartments - Wood (%)
House heating fuel used in apartments - Solar energy (%)
House heating fuel used in apartments - Other fuel (%)
House heating fuel used in apartments - No fuel used (%)
Latest news about housing in Milford, MA collected exclusively by city-data.com from local newspapers, TV, and radio stations
Median year house/condo built: 1973Median year apartment built: 1956Household type by relationship:
Households: 27,698
Male householders: 5,741 (1,366 living alone ), Female householders: 4,779 (1,325 living alone )5,243 spouses (5,178 opposite-sex spouses ), 784 unmarried partners , (769 opposite-sex unmarried partners ), 8,072 children (7,876 natural , 104 adopted , 91 stepchildren ), 459 grandchildren , 358 brothers or sisters , 448 parents , 84 foster children , 737 other relatives , 755 non-relatives In group quarters: 233
Size of family households: 3,159 2-persons , 1,563 3-persons , 1,414 4-persons , 620 5-persons , 134 6-persons , 183 7-or-more-persons .
Size of nonfamily households: 2,780 1-person , 681 2-persons , 42 3-persons , 143 4-persons , 9 5-persons .
3,649 married couples with children. single-parent households (247 men , 1,174 women ).
62.7% of residents of Milford speak English at home. of residents speak Spanish at home (35% speak English very well , 12% speak English well , 16% speak English not well , 37% don't speak English at all ).of residents speak other Indo-European language at home (43% speak English very well , 20% speak English well , 13% speak English not well , 24% don't speak English at all ).of residents speak Asian or Pacific Island language at home (25% speak English very well , 31% speak English well , 41% speak English not well , 4% don't speak English at all ).of residents speak other language at home (74% speak English very well , 16% speak English well , 10% speak English not well ).
Foreign born population: 7,879 (28.4%)of them are naturalized citizens )
Median number of rooms in houses and condos:
Median number of rooms in apartments
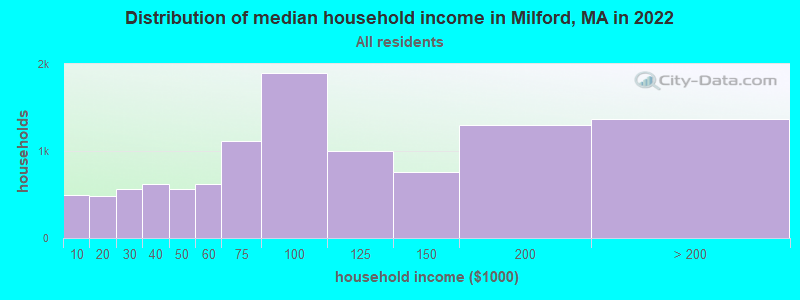
Milford, MA household income distribution 496 Less than $10,000479 $10,000 to $19,999559 $20,000 to $29,999626 $30,000 to $39,999561 $40,000 to $49,999617 $50,000 to $59,9991,115 $60,000 to $74,9991,891 $75,000 to $99,9991,000 $100,000 to $124,999764 $125,000 to $149,9991,297 $150,000 to $199,9991,366 $200,000 or more
Home value of owner - occupied houses in 2022 in Milford, MA 89 Less than $10,00018 $15,000 to $19,99931 $20,000 to $24,99924 $25,000 to $29,99918 $30,000 to $34,99940 $35,000 to $39,9995 $40,000 to $49,9990 $50,000 to $59,99922 $100,000 to $124,999112 $125,000 to $149,99973 $150,000 to $174,99986 $175,000 to $199,999148 $200,000 to $249,999521 $250,000 to $299,9992,335 $300,000 to $399,9992,116 $400,000 to $499,9991,474 $500,000 to $749,999219 $750,000 to $999,999Rent paid by renters in 2022 in Milford, MA 54 $150 to $19933 $200 to $24931 $300 to $34912 $350 to $399163 $400 to $44960 $450 to $49945 $500 to $54928 $550 to $59948 $600 to $64920 $650 to $69923 $700 to $74977 $750 to $79983 $800 to $899210 $900 to $999584 $1,000 to $1,249496 $1,250 to $1,4991,279 $1,500 to $1,999451 $2,000 to $2,499111 $2,500 to $2,99938 $3,000 to $3,49946 No cash rent
Percentage of workers working in this county: 51.1%Number of people working at home: 2,014 (13.6% of all workers )
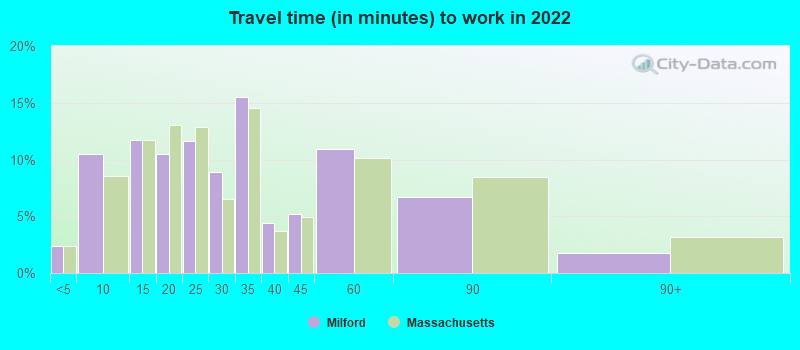
Travel time to work (commute)
Less than 5 minutes: 4965 to 9 minutes: 1,17710 to 14 minutes: 1,79115 to 19 minutes: 1,12020 to 24 minutes: 99625 to 29 minutes: 79030 to 34 minutes: 1,92435 to 39 minutes: 49040 to 44 minutes: 53045 to 59 minutes: 1,49460 to 89 minutes: 1,34390 or more minutes: 467
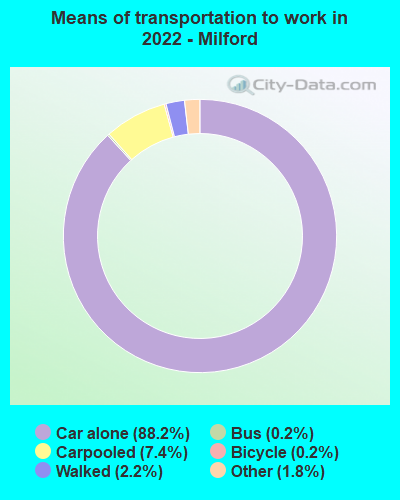
Means of transportation to work:
Drove a car alone: 14,330 (77.1%)Carpooled: 1,283 (6.9%)Bus : 34 (0.2%)Taxi: 365 (2.0%)Bicycle: 19 (0.1%)Walked: 265 (1.4%)Worked at home: 2,014 (10.8%)
Unemployment by race in 2022
Unemployment rate for White non-Hispanic residents 3.8% Males3.6% FemalesUnemployment rate for Black residents 23.4% FemalesUnemployment rate for Asian residents 5.2% Males22.7% FemalesUnemployment rate for other race residents 7.2% Males9.6% FemalesUnemployment rate for two or more race residents 1.9% Males9.0% FemalesUnemployment rate for Hispanic or Latino residents 7.9% Males3.0% Females
Year of entry for the foreign-born population in Milford, Massachusetts
4,432 2010 or later 1,279 2000 to 2009 1,119 1990 to 1999 627 1980 to 1989 640 1970 to 1979 607 Before 1970
First ancestries reported:
Brazilian: 4,492 (29.0%)
Irish: 1,595 (10.3%)
Italian: 1,527 (9.9%)
Portuguese: 1,154 (7.5%)
French Canadian: 624 (4.0%)
English: 561 (3.6%)
American: 527 (3.4%)
French: 258 (1.7%)
Haitian: 254 (1.6%)
Polish: 216 (1.4%)
Greek: 194 (1.3%)
German: 193 (1.2%)
Scottish: 161 (1.0%)
European: 135 (0.9%)
Eastern European: 96 (0.6%)
Moroccan: 91 (0.6%)
Egyptian: 88 (0.6%)
Guyanese: 73 (0.5%)
Lebanese: 59 (0.4%)
Armenian: 49 (0.3%)
Russian: 33 (0.2%)
Canadian: 26 (0.2%)
Swedish: 25 (0.2%)
British: 22 (0.1%)
Dutch: 16 (0.1%)
African: 16 (0.1%)
Bulgarian: 15 (0.10%)
Arab: 13 (0.08%)
Trinidadian and Tobagonian: 12 (0.08%)
Yugoslavian: 11 (0.07%)
Syrian: 10 (0.06%)
Lithuanian: 8 (0.05%)
Scotch-Irish: 8 (0.05%)
Ghanaian: 5 (0.03%)
Welsh: 5 (0.03%) Most common places of birth for foreign-born residents (%): Brazil Milford:
51.2% (3,962)Massachusetts:
7.6% (92,959)
Ecuador Milford:
16.4% (1,266)Massachusetts:
1.0% (11,727)
Portugal Milford:
9.4% (728)Massachusetts:
4.1% (50,360)
Cameroon Milford:
3.6% (282)Massachusetts:
0.2% (2,679)
El Salvador Milford:
3.6% (276)Massachusetts:
3.7% (45,667)
India Milford:
3.2% (245)Massachusetts:
6.8% (82,934)
Canada Milford:
2.1% (162)Massachusetts:
2.3% (28,158)
Dominican Republic Milford:
2.1% (159)Massachusetts:
8.3% (101,767)
Haiti Milford:
1.9% (148)Massachusetts:
4.9% (60,432)
Guatemala Milford:
1.8% (141)Massachusetts:
2.7% (32,733)
Korea Milford:
1.7% (133)Massachusetts:
1.4% (17,613)
Place of birth for U.S.-born residents:
This state: 15,556Other state: 3,546Northeast: 2,424Midwest: 225South: 652West: 218 89.3% of Milford residents lived in the same house 1 years ago.
Out of people who lived in different houses, 29.8% lived in this county.
Out of people who lived in different counties, 83.1% lived in Massachusetts.
Milford:
89.3%State average:
87.7%
Education attainment for males 25 years and older:
No schooling: 277Nursery to 4th grade: 905th and 6th grade: 2207th and 8th grade: 3239th grade: 12810th grade: 12011th grade: 30612th grade, no diploma: 171High school graduate (or equivalency): 2,905Less than 1 year of college: 521Some college more than 1 year, no degree: 1,003Associate degree: 813Bachelor's degree: 1,955Master's degree: 755Professional school degree: 251Doctorate degree: 142
Education attainment for females 25 years and older:
No schooling: 256Nursery to 4th grade: 1045th and 6th grade: 1307th and 8th grade: 1189th grade: 18010th grade: 15711th grade: 4912th grade, no diploma: 177High school graduate (or equivalency): 3,146Less than 1 year of college: 336Some college more than 1 year, no degree: 965Associate degree: 1,015Bachelor's degree: 2,023Master's degree: 902Professional school degree: 132Doctorate degree: 44
Housing units in structures:
One, detached: 6,051One, attached: 1,192Two: 1,2893 or 4: 9495 to 9: 28610 to 19: 64720 to 49: 55150 or more: 93Mobile homes: 12Housing units lacking complete plumbing facilities in 2022: 0.3%Housing units lacking complete kitchen facilities in 2022: 0.6%House/condo owner moved in on average 14 years ago
Renter moved in on average 3 years ago
Private vs. public school enrollment:
Students in private schools in grades 1 to 8 (elementary and middle school): 88 Here:
3.6%Massachusetts:
10.3%
Students in private schools in grades 9 to 12 (high school): 67 Here:
4.9%Massachusetts:
12.3%
Students in private undergraduate colleges: 274 Here:
27.4%Massachusetts:
51.2%