Milford, NH (New Hampshire) Houses and Residents
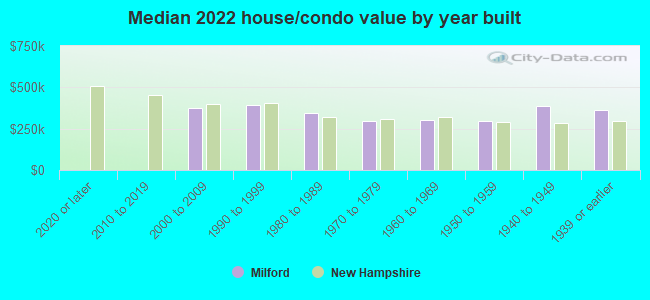
| Milford: | $356,248 |
| New Hampshire: | $384,700 |
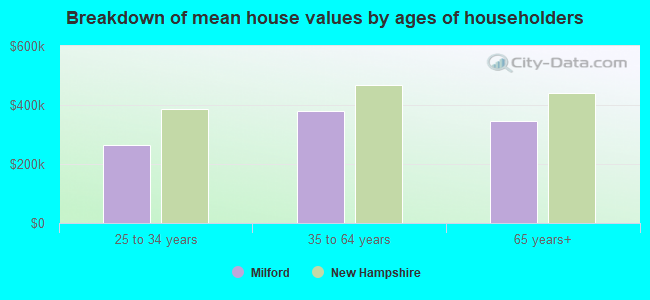
Mean price in 2022:
Detached houses: $398,885
Here: $398,885 State: $491,479 Townhouses or other attached units: $242,835
Here: $242,835 State: $361,001 In 2-unit structures: $261,697
Here: $261,697 State: $368,847 In 5-or-more-unit structures: $260,215
Here: $260,215 State: $274,068 Mobile homes: $281,086
Here: $281,086 State: $124,817
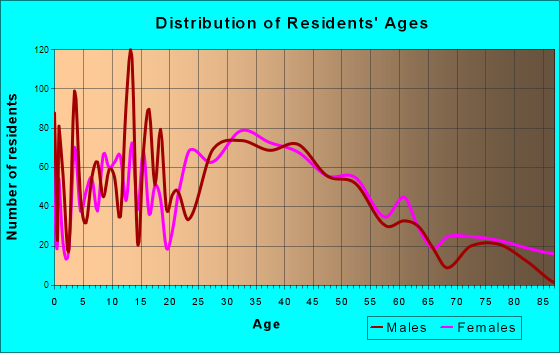
Total population: 8,835 (Urban population: 7,900, Rural population: 167 (all nonfarm))
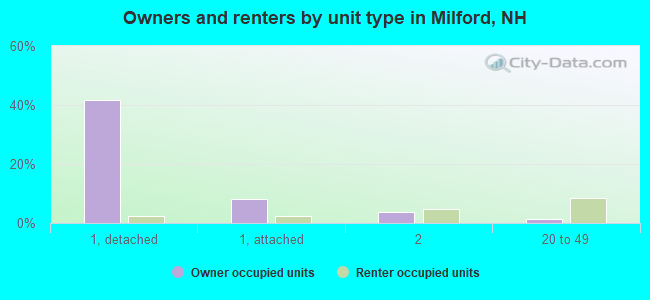
Houses: 3,924 (3,747 occupied: 2,109 owner occupied, 1,623 renter occupied)
| % of renters here: | 43% |
| State: | 28% |
Housing density: 686 houses/condos per square mile
Median price asked for vacant for-sale houses and condos in 2022 in this county: $219,786.
Median contract rent in 2022: $1,205 (lower quartile is $1,017, upper quartile is $1,467)
Median rent asked for vacant for-rent units in 2022: $2,750
Median gross rent in Milford, NH in 2022: $1,354
Housing units in Milford with a mortgage: 1,625 (72 second mortgage, 0 home equity loan, 74 both second mortgage and home equity loan)
Houses without a mortgage: 32
Median household income for houses/condos with a mortgage: $108,411
Median household income for apartments without a mortgage: $65,828
Median monthly housing costs: $1,611
Compare current foreclosures near Milford, NH:
| Photo | Address | Area | Beds / Baths | Price | Details |
|---|---|---|---|---|---|

|
#1
Cypress Rd
Milford, NH 03055
|
1,929 sq. feet
|
1 baths 3 beds |
show details | |

|
#2
Ridgefield Dr
Milford, NH 03055
|
1,357 sq. feet
|
1 baths 3 beds |
show details | |

|
#3
Wallingford Rd
Milford, NH 03055
|
2,756 sq. feet
|
2 baths 4 beds |
show details | |

|
#4
Elm St Apt 11
Milford, NH 03055
|
- sq. feet
|
- baths - beds |
show details | |

|
#5
Powers St Apt 135
Milford, NH 03055
|
- sq. feet
|
- baths - beds |
show details | |

|
#6
Bridge St Apt 112
Milford, NH 03055
|
- sq. feet
|
- baths - beds |
show details | |

|
#7
Powers St Apt 119
Milford, NH 03055
|
- sq. feet
|
- baths - beds |
show details | |

|
#8
Michael Ave
Derry, NH 03038
|
1,536 sq. feet
|
1 baths 4 beds |
show details | |

|
#9
West Rd
Ashby, MA 01431
|
7,000 sq. feet
|
3 baths 10 beds |
show details | |

|
#10
Reagan Rd
Townsend, MA 01469
|
1,591 sq. feet
|
2 baths 3 beds |
show details |
| Photo | Address | Area | Beds / Baths | Price | Details |
|---|---|---|---|---|---|

|
#11
Elm St
Manchester, NH 03104
|
4,352 sq. feet
|
3 baths 3 beds |
show details | |

|
#12
Hemlock Dr
Lunenburg, MA 01462
|
696 sq. feet
|
1 baths 2 beds |
show details | |

|
#13
High St
Derry, NH 03038
|
2,149 sq. feet
|
3 baths 4 beds |
show details | |

|
#14
Brook St
Derry, NH 03038
|
1,476 sq. feet
|
2 baths 4 beds |
show details | |

|
#15
Blucher St
Manchester, NH 03102
|
2,448 sq. feet
|
2 baths 3 beds |
show details | |

|
#16
Amherst St
Amherst, NH 03031
|
- sq. feet
|
4 baths 3 beds |
show details | |

|
#17
Juniper Dr
Amherst, NH 03031
|
3,364 sq. feet
|
4 baths 4 beds |
show details | |

|
#18
Wells St
Manchester, NH 03104
|
2,800 sq. feet
|
1 baths 3 beds |
show details | |

|
#19
Wallace Rd
Goffstown, NH 03045
|
1,848 sq. feet
|
1 baths 2 beds |
show details | |

|
#20
Main St
Dunstable, MA 01827
|
2,452 sq. feet
|
2 baths 3 beds |
show details |
| Photo | Address | Area | Beds / Baths | Price | Details |
|---|---|---|---|---|---|

|
#21
Longbrook Rd
Goffstown, NH 03045
|
1,960 sq. feet
|
2 baths 3 beds |
show details | |

|
#22
Etta Ln
Weare, NH 03281
|
1,425 sq. feet
|
1 baths 3 beds |
show details | |

|
#23
Kendall Hill Rd
Ashby, MA 01431
|
2,852 sq. feet
|
2 baths 4 beds |
show details | |

|
#24
Haskell Rd
Pepperell, MA 01463
|
1,440 sq. feet
|
1 baths 3 beds |
show details | |

|
#25
Laurelwood Dr
Ashby, MA 01431
|
5,235 sq. feet
|
4 baths 4 beds |
show details | |

|
#26
Hedgerow Drive Unit # 5a
Hudson, NH Array
|
1,796 sq. feet
|
1 baths 3 beds |
show details | |

|
#27
Hollis St
Pepperell, MA 01463
|
1,242 sq. feet
|
1 baths 3 beds |
show details | |

|
#28
Old Coach Rd
Hudson, NH 03051
|
2,630 sq. feet
|
2 baths 3 beds |
show details | |

|
#29
Clay St # 2
Manchester, NH 03103
|
2,240 sq. feet
|
2 baths 4 beds |
show details | |

|
#30
Cedar St
Manchester, NH 03103
|
2,614 sq. feet
|
2 baths 6 beds |
show details |
| Photo | Address | Area | Beds / Baths | Price | Details |
|---|---|---|---|---|---|

|
#31
Glen Rd
Bedford, NH 03110
|
3,094 sq. feet
|
2 baths 4 beds |
show details | |

|
#32
Merrimack St # 2
Manchester, NH 03103
|
2,436 sq. feet
|
2 baths 6 beds |
show details | |

|
#33
Holbrook Rd
Bedford, NH 03110
|
3,376 sq. feet
|
2 baths 4 beds |
show details | |

|
#34
Wiley Hill Rd
Londonderry, NH 03053
|
2,668 sq. feet
|
2 baths 3 beds |
show details | |

|
#35
Lowell St # 1
Manchester, NH 03104
|
2,184 sq. feet
|
2 baths 6 beds |
show details | |

|
#36
Liberty St # 2
Manchester, NH 03104
|
1,987 sq. feet
|
2 baths 5 beds |
show details | |

|
#37
Normand St
Manchester, NH 03109
|
1,502 sq. feet
|
2 baths 3 beds |
show details | |

|
#38
East St
Pepperell, MA 01463
|
1,566 sq. feet
|
1 baths 3 beds |
show details | |

|
#39
Public St
Manchester, NH 03103
|
1,396 sq. feet
|
1 baths 3 beds |
show details | |

|
#40
Brown Ave
Manchester, NH 03103
|
1,296 sq. feet
|
1 baths 4 beds |
show details |
| Photo | Address | Area | Beds / Baths | Price | Details |
|---|---|---|---|---|---|

|
#41
Courthouse Rd
Amherst, NH 03031
|
1,391 sq. feet
|
1 baths 3 beds |
show details | |

|
#42
High St
Dunstable, MA 01827
|
2,416 sq. feet
|
2 baths 4 beds |
show details | |

|
#43
Diamond Ln
Goffstown, NH 03045
|
2,464 sq. feet
|
1 baths 4 beds |
show details | |

|
#44
Parker Ave
Manchester, NH 03102
|
1,352 sq. feet
|
1 baths 3 beds |
show details | |

|
#45
Moose Club Park Rd
Goffstown, NH 03045
|
1,864 sq. feet
|
2 baths 4 beds |
show details | |

|
#46
Emery Rd
Townsend, MA 01469
|
2,224 sq. feet
|
2 baths 3 beds |
show details | |

|
#47
Nashua Rd
Pepperell, MA 01463
|
3,236 sq. feet
|
4 baths 5 beds |
show details | |

|
#48
Nashua Rd
Pepperell, MA 01463
|
3,236 sq. feet
|
4 baths 5 beds |
show details | |

|
#49
Turnpike Rd
Ashby, MA 01431
|
960 sq. feet
|
1 baths 2 beds |
show details | |

|
Check over 1 million property listings on Foreclosure.com!
|
browse all offers | |||

Latest news about housing in Milford, NH collected exclusively by city-data.com from local newspapers, TV, and radio stations

 | NH Real Estate Market (52 replies) |
| Cool coffee houses around Milford/Nashua/Manchester (3 replies) |
| Milford NH (2 replies) |
| Question on NH (18 replies) |
| Well NH, its been nice but (85 replies) |
| Moving from Va to NH looking for some advice :) (32 replies) |
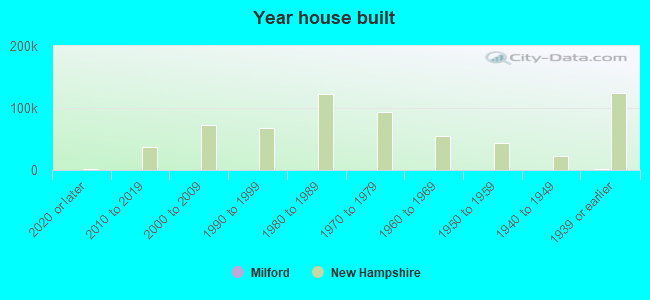
Median year apartment built: 1966
Household type by relationship:
Households: 8,607- Male householders: 1,824 (503 living alone), Female householders: 1,909 (831 living alone)
1,432 spouses (1,381 opposite-sex spouses), 469 unmarried partners, (460 opposite-sex unmarried partners), 2,265 children (2,161 natural, 31 adopted, 72 stepchildren), 118 grandchildren, 52 brothers or sisters, 191 parents, 0 foster children, 23 other relatives, 139 non-relatives
- In group quarters: 181
Size of family households: 841 2-persons, 776 3-persons, 260 4-persons, 169 5-persons, 30 6-persons, 54 7-or-more-persons.
Size of nonfamily households: 1,287 1-person, 263 2-persons, 27 3-persons.
838 married couples with children.
694 single-parent households (196 men, 498 women).
95.6% of residents of Milford speak English at home.
2.0% of residents speak Spanish at home (58% speak English very well, 36% speak English well, 6% don't speak English at all).
1.5% of residents speak other Indo-European language at home (59% speak English very well, 5% speak English well, 24% speak English not well, 12% don't speak English at all).
2.1% of residents speak Asian or Pacific Island language at home (51% speak English very well, 41% speak English well, 8% don't speak English at all).
Foreign born population: 349 (4.1%)
(43.6% of them are naturalized citizens)
| Here: | 5.7 |
| State: | 6.4 |
| Here: | 3.5 |
| State: | 4.0 |
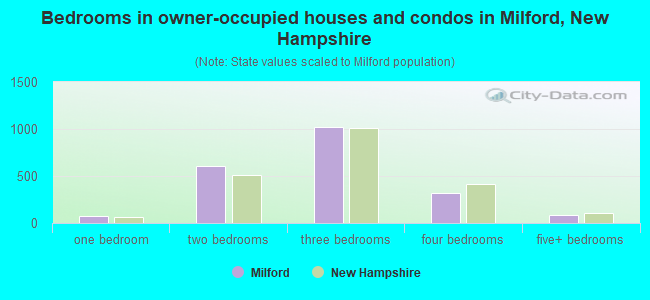
- Bedrooms in owner-occupied houses and condos in Milford, New Hampshire
- 2no bedroom
- 761 bedroom
- 6092 bedrooms
- 1,0253 bedrooms
- 3174 bedrooms
- 815+ bedrooms
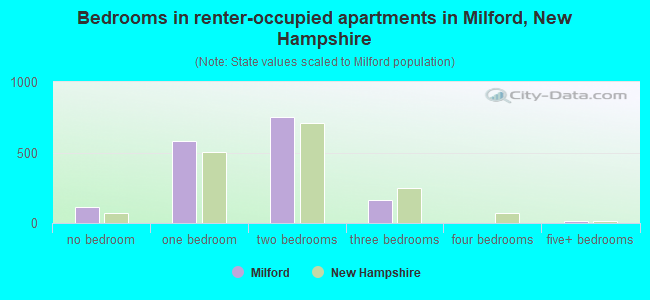
- Bedrooms in renter-occupied apartments in Milford, New Hampshire
- 113no bedroom
- 5791 bedroom
- 7542 bedrooms
- 1663 bedrooms
- 04 bedrooms
- 115+ bedrooms
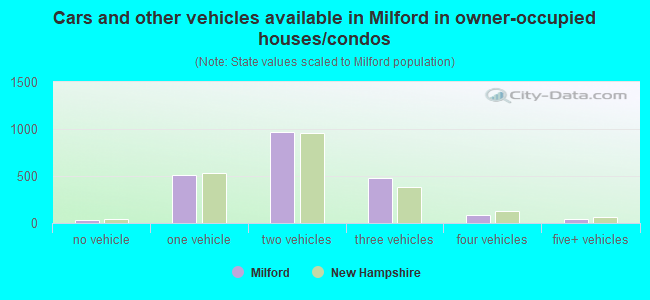
- Cars and other vehicles available in Milford in owner-occupied houses/condos
- 32no vehicle
- 5111 vehicle
- 9662 vehicles
- 4773 vehicles
- 844 vehicles
- 385+ vehicles
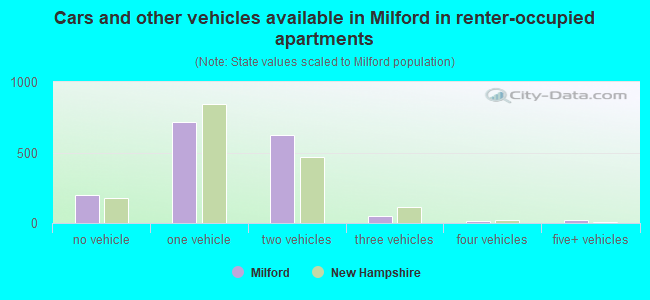
- Cars and other vehicles available in Milford in renter-occupied apartments
- 199no vehicle
- 7151 vehicle
- 6252 vehicles
- 533 vehicles
- 124 vehicles
- 185+ vehicles
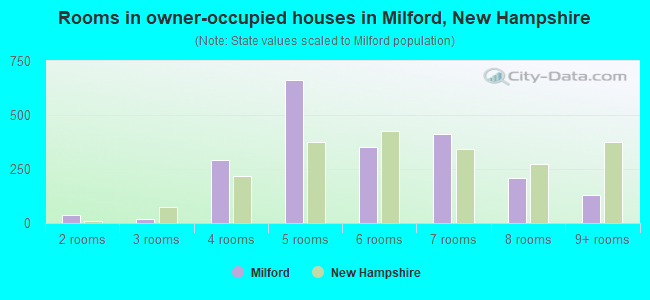
- Rooms in owner-occupied houses in Milford, New Hampshire
- 21 room
- 382 rooms
- 173 rooms
- 2904 rooms
- 6635 rooms
- 3546 rooms
- 4107 rooms
- 2088 rooms
- 1289+ rooms
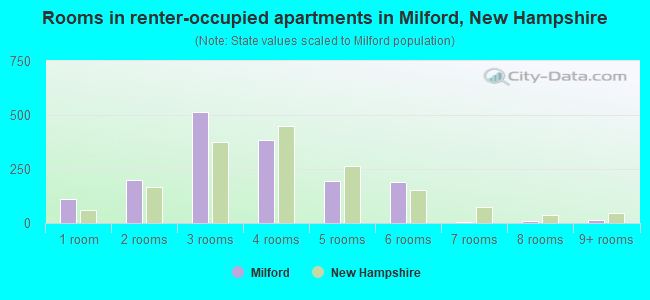
- Rooms in renter-occupied apartments in Milford, New Hampshire
- 1131 room
- 2002 rooms
- 5163 rooms
- 3824 rooms
- 1935 rooms
- 1916 rooms
- 67 rooms
- 118 rooms
- 129+ rooms
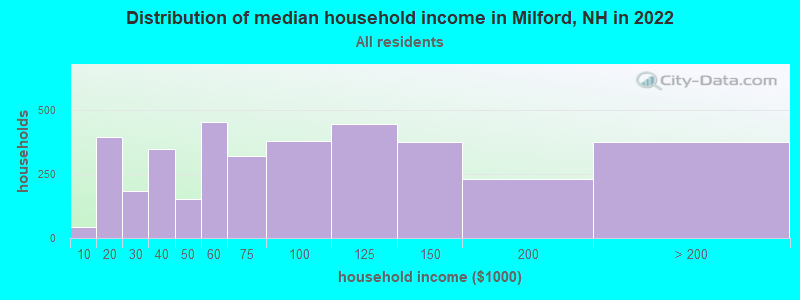
Milford, NH household income distribution

- 42Less than $10,000
- 396$10,000 to $19,999
- 184$20,000 to $29,999
- 350$30,000 to $39,999
- 151$40,000 to $49,999
- 454$50,000 to $59,999
- 322$60,000 to $74,999
- 380$75,000 to $99,999
- 445$100,000 to $124,999
- 374$125,000 to $149,999
- 231$150,000 to $199,999
- 376$200,000 or more
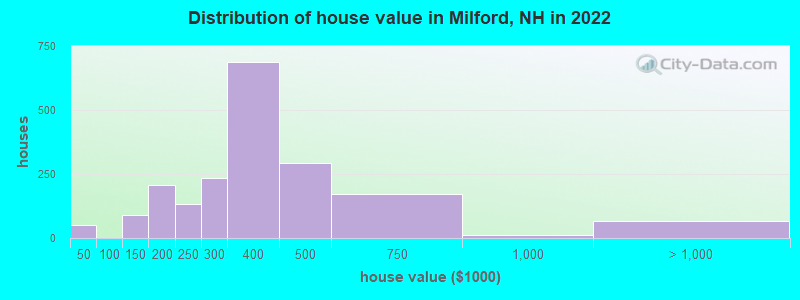
Home value of owner - occupied houses in 2022 in Milford, NH
-
- 22Less than $10,000
- 11$20,000 to $24,999
- 17$25,000 to $29,999
- 80$100,000 to $124,999
- 7$125,000 to $149,999
- 110$150,000 to $174,999
- 95$175,000 to $199,999
- 132$200,000 to $249,999
- 233$250,000 to $299,999
- 685$300,000 to $399,999
- 291$400,000 to $499,999
- 172$500,000 to $749,999
- 10$750,000 to $999,999
- 67$1,000,000 to $1,499,999
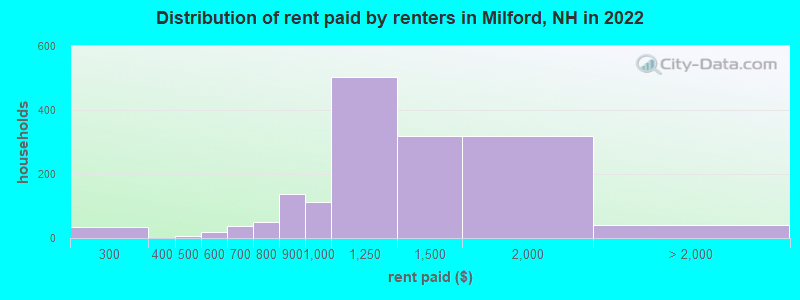
Rent paid by renters in 2022 in Milford, NH
-
- 33$250 to $299
- 6$400 to $449
- 12$500 to $549
- 5$550 to $599
- 28$600 to $649
- 7$650 to $699
- 31$700 to $749
- 19$750 to $799
- 139$800 to $899
- 112$900 to $999
- 503$1,000 to $1,249
- 319$1,250 to $1,499
- 318$1,500 to $1,999
- 39No cash rent
Percentage of workers working in this county: 85.7%
Number of people working at home: 504 (11.0% of all workers)
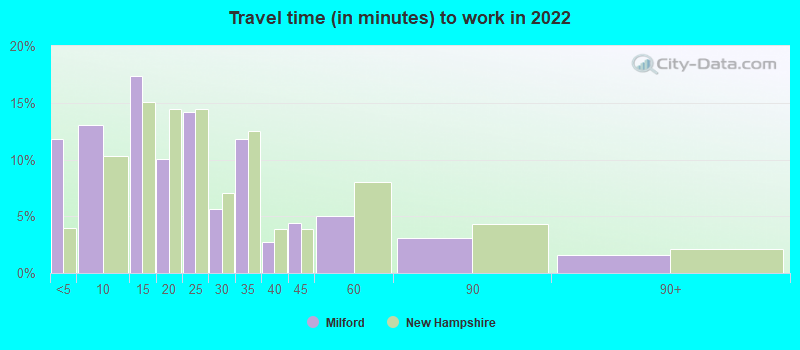
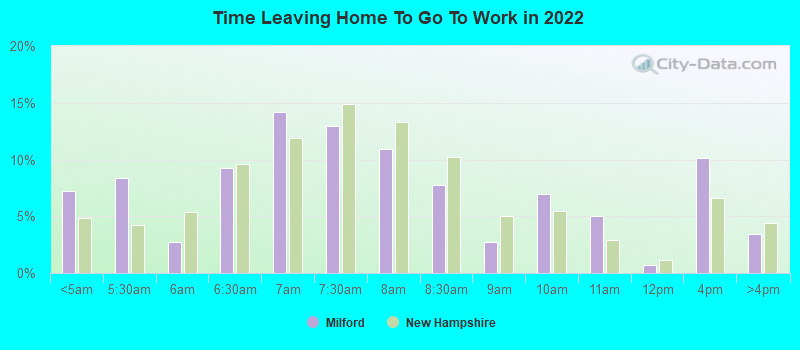
Travel time to work (commute)
- Less than 5 minutes: 243
- 5 to 9 minutes: 591
- 10 to 14 minutes: 508
- 15 to 19 minutes: 323
- 20 to 24 minutes: 349
- 25 to 29 minutes: 384
- 30 to 34 minutes: 337
- 35 to 39 minutes: 279
- 40 to 44 minutes: 216
- 45 to 59 minutes: 413
- 60 to 89 minutes: 223
- 90 or more minutes: 118
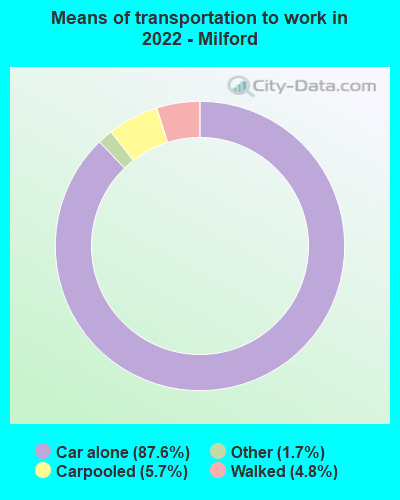
Means of transportation to work:
- Drove a car alone: 3,387 (74.1%)
- Carpooled: 287 (6.3%)
- Taxi: 78 (1.7%)
- Bicycle: 5 (0.1%)
- Walked: 195 (4.3%)
- Worked at home: 504 (11.0%)
- Unemployment by race in 2022
- Unemployment rate for White non-Hispanic residents
- 4.1%Males
- 1.8%Females
- Unemployment rate for Asian residents
- 100.0%Males
- Unemployment rate for other race residents
- 32.2%Males
- Unemployment rate for two or more race residents
- 17.8%Females
- Unemployment rate for Hispanic or Latino residents
- 17.6%Males
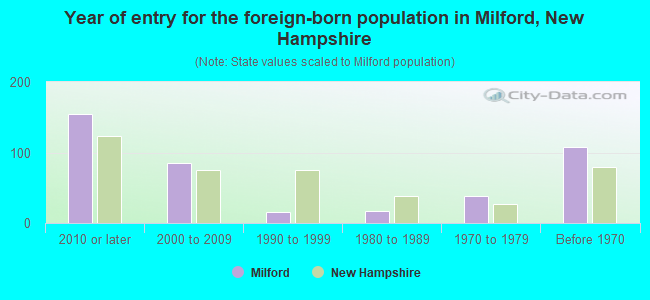
- Year of entry for the foreign-born population in Milford, New Hampshire
- 1552010 or later
- 852000 to 2009
- 161990 to 1999
- 171980 to 1989
- 381970 to 1979
- 108Before 1970
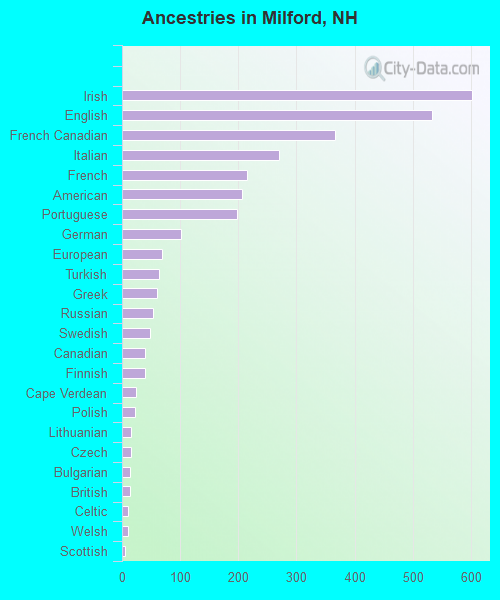
First ancestries reported:
- Irish: 601 (18.3%)
- English: 533 (16.2%)
- French Canadian: 367 (11.2%)
- Italian: 270 (8.2%)
- French: 215 (6.5%)
- American: 206 (6.3%)
- Portuguese: 198 (6.0%)
- German: 102 (3.1%)
- European: 69 (2.1%)
- Turkish: 63 (1.9%)
- Greek: 61 (1.9%)
- Russian: 53 (1.6%)
- Swedish: 48 (1.5%)
- Canadian: 40 (1.2%)
- Finnish: 39 (1.2%)
- Cape Verdean: 24 (0.7%)
- Polish: 22 (0.7%)
- Lithuanian: 16 (0.5%)
- Czech: 15 (0.5%)
- Bulgarian: 14 (0.4%)
- British: 13 (0.4%)
- Celtic: 10 (0.3%)
- Welsh: 10 (0.3%)
- Scottish: 6 (0.2%)
Most common places of birth for foreign-born residents (%):
| Milford: | 14.4% (50) |
| New Hampshire: | 3.6% (2,964) |
| Milford: | 11.2% (39) |
| New Hampshire: | 2.2% (1,838) |
| Milford: | 9.5% (33) |
| New Hampshire: | 1.3% (1,058) |
| Milford: | 9.5% (33) |
| New Hampshire: | 7.0% (5,842) |
| Milford: | 9.5% (33) |
| New Hampshire: | 9.1% (7,618) |
| Milford: | 8.6% (30) |
| New Hampshire: | 0.5% (436) |
| Milford: | 8.1% (28) |
| New Hampshire: | 0.3% (246) |
| Milford: | 7.5% (26) |
| New Hampshire: | 0.0% (26) |
| Milford: | 6.6% (23) |
| New Hampshire: | 1.4% (1,179) |
| Milford: | 4.3% (15) |
| New Hampshire: | 3.3% (2,742) |
| Milford: | 4.3% (15) |
| New Hampshire: | 0.9% (728) |
| Milford: | 4.3% (15) |
| New Hampshire: | 0.8% (694) |
Place of birth for U.S.-born residents:
- This state: 4,272
- Other state: 3,923
- Northeast: 2,935
- Midwest: 366
- South: 326
- West: 291
89.7% of Milford residents lived in the same house 1 years ago.
Out of people who lived in different houses, 40.9% lived in this county.
Out of people who lived in different counties, 37.3% lived in New Hampshire.
| Milford: | 89.7% |
| State average: | 89.8% |
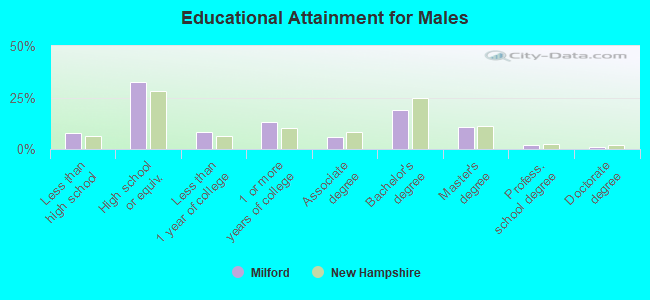
Education attainment for males 25 years and older:
- No schooling: 37
- Nursery to 4th grade: 15
- 5th and 6th grade: 0
- 7th and 8th grade: 62
- 9th grade: 16
- 10th grade: 50
- 11th grade: 0
- 12th grade, no diploma: 42
- High school graduate (or equivalency): 951
- Less than 1 year of college: 239
- Some college more than 1 year, no degree: 377
- Associate degree: 173
- Bachelor's degree: 546
- Master's degree: 311
- Professional school degree: 60
- Doctorate degree: 35
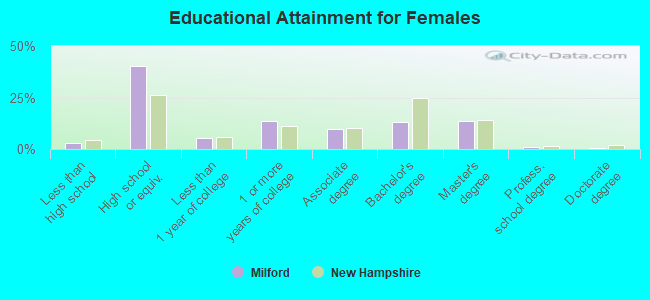
Education attainment for females 25 years and older:
- No schooling: 10
- Nursery to 4th grade: 0
- 5th and 6th grade: 23
- 7th and 8th grade: 24
- 9th grade: 6
- 10th grade: 0
- 11th grade: 28
- 12th grade, no diploma: 9
- High school graduate (or equivalency): 1,371
- Less than 1 year of college: 179
- Some college more than 1 year, no degree: 465
- Associate degree: 323
- Bachelor's degree: 438
- Master's degree: 467
- Professional school degree: 32
- Doctorate degree: 17
Housing units in structures:
- One, detached: 1,646
- One, attached: 336
- Two: 384
- 3 or 4: 497
- 5 to 9: 275
- 10 to 19: 123
- 20 to 49: 408
- 50 or more: 191
- Mobile homes: 60
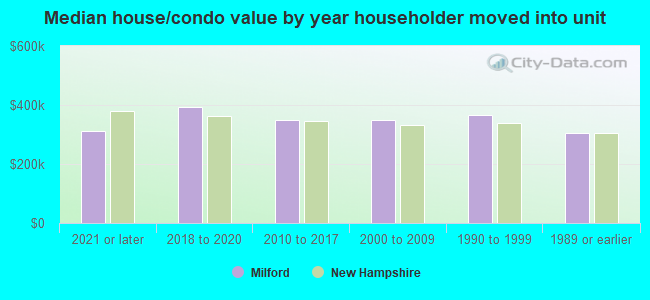
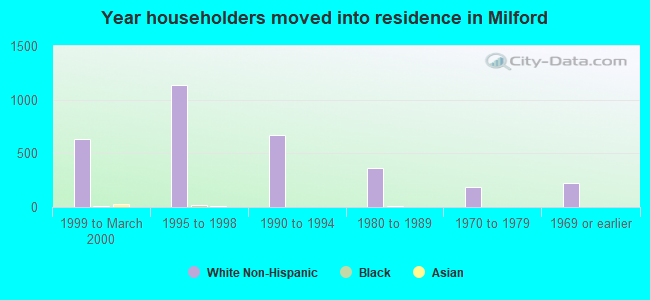
House/condo owner moved in on average 9 years ago
Renter moved in on average 3 years ago
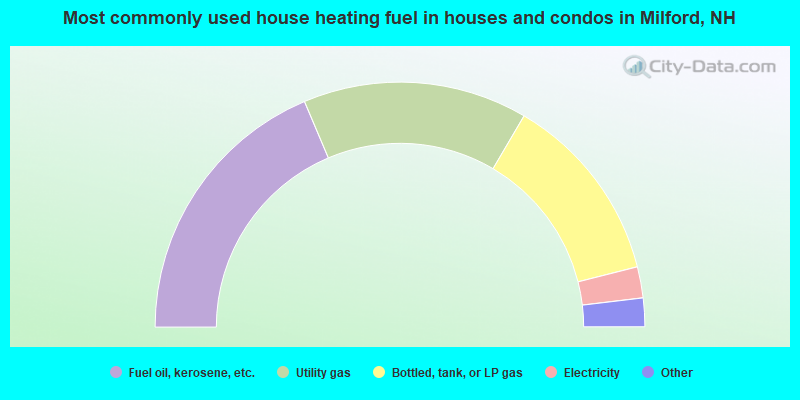
- 37.3%Fuel oil, kerosene, etc.
- 29.7%Utility gas
- 25.2%Bottled, tank, or LP gas
- 4.1%Electricity
- 1.6%Other fuel
- 1.1%Wood
- 0.9%Coal or coke
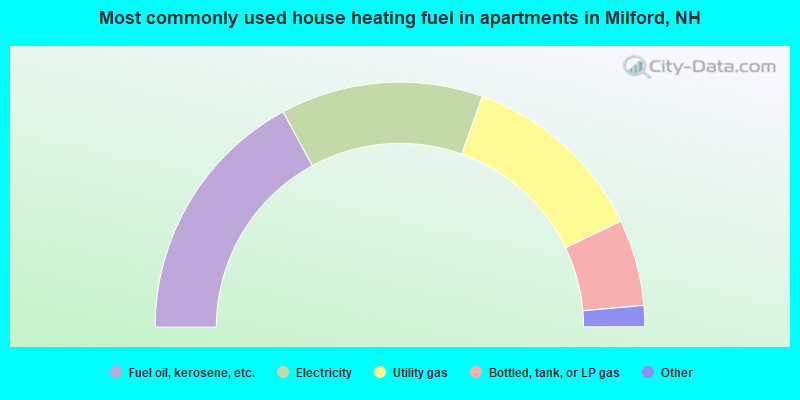
- 34.2%Fuel oil, kerosene, etc.
- 26.8%Electricity
- 24.9%Utility gas
- 11.4%Bottled, tank, or LP gas
- 2.1%No fuel used
- 0.6%Other fuel
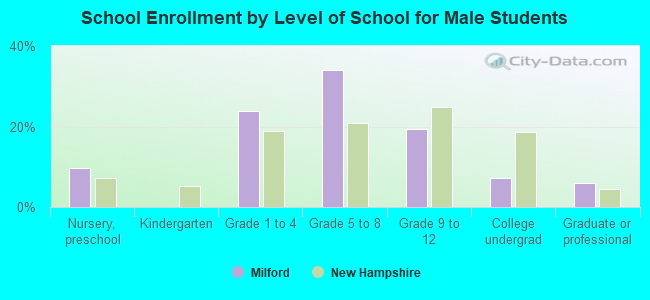
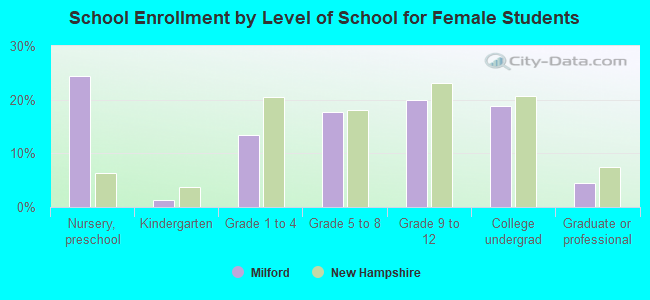
Private vs. public school enrollment:
| Here: | 1.7% |
| New Hampshire: | 11.4% |
| Here: | 1.8% |
| New Hampshire: | 14.0% |
| Here: | 17.0% |
| New Hampshire: | 38.0% |