Millersburg, IN (Indiana) Houses and Residents
| Millersburg: | $166,449 |
| Indiana: | $208,700 |
Mean price in 2022:
Detached houses: $160,648
Here: $160,648 State: $257,916
Total population: 926 (Urban population: 0, Rural population: 856 (5 farm, 851 nonfarm))
Houses: 237 (215 occupied: 149 owner occupied, 72 renter occupied)
| % of renters here: | 33% |
| State: | 29% |
Housing density: 450 houses/condos per square mile
Median price asked for vacant for-sale houses and condos in 2022 in this county: $308,006.
Median contract rent in 2022: $740 (lower quartile is $665, upper quartile is $920)
Median rent asked for vacant for-rent units in 2022: $847
Median gross rent in Millersburg, IN in 2022: $956
Housing units in Millersburg with a mortgage: 106 (15 second mortgage, 0 home equity loan, 15 both second mortgage and home equity loan)
Houses without a mortgage: 0
Median household income for houses/condos with a mortgage: $98,913
Median household income for apartments without a mortgage: $33,538
Median monthly housing costs: $942
Compare current foreclosures near Millersburg, IN:
| Photo | Address | Area | Beds / Baths | Price | Details |
|---|---|---|---|---|---|

|
#1
Cripe Dr
Millersburg, IN 46543
|
1,188 sq. feet
|
1 baths 3 beds |
show details | |

|
#2
Sandbrooke Dr
Millersburg, IN 46543
|
1,396 sq. feet
|
1 baths 3 beds |
show details | |

|
#3
N Benton St
Millersburg, IN 46543
|
- sq. feet
|
- baths - beds |
show details | |

|
#4
N Benton St
Millersburg, IN 46543
|
- sq. feet
|
- baths - beds |
show details | |

|
#5
Blessing St
Millersburg, IN 46543
|
- sq. feet
|
- baths - beds |
show details | |

|
#6
S Spring St
Wakarusa, IN 46573
|
1,064 sq. feet
|
1 baths 3 beds |
show details | |

|
#7
S 14th St
Goshen, IN 46526
|
1,128 sq. feet
|
1 baths 3 beds |
show details | |

|
#8
Midway Rd
Elkhart, IN 46517
|
- sq. feet
|
2 baths 3 beds |
show details | |

|
#9
Idlewild Ave
Elkhart, IN 46516
|
1,008 sq. feet
|
1 baths 2 beds |
show details | |

|
#10
N Sullivan Rd
Leesburg, IN 46538
|
- sq. feet
|
3 baths 3 beds |
show details |
| Photo | Address | Area | Beds / Baths | Price | Details |
|---|---|---|---|---|---|

|
#11
E 6th St
Ligonier, IN 46767
|
1,707 sq. feet
|
1 baths 3 beds |
show details | |

|
#12
E John St
Nappanee, IN 46550
|
2,618 sq. feet
|
2 baths 4 beds |
show details | |

|
#13
Stonebridge Dr
Elkhart, IN 46514
|
2,389 sq. feet
|
2 baths 4 beds |
show details | |

|
#14
N Main St
Nappanee, IN 46550
|
1,480 sq. feet
|
1 baths 3 beds |
show details | |

|
#15
Spring Arbor Dr
Middlebury, IN 46540
|
1,920 sq. feet
|
1 baths 3 beds |
show details | |

|
#16
Surrey Ln
Elkhart, IN 46517
|
2,236 sq. feet
|
1 baths 4 beds |
show details | |

|
#17
W Himes St
North Webster, IN 46555
|
1,296 sq. feet
|
1 baths 2 beds |
show details | |

|
#18
W 625 S
Wolcottville, IN 46795
|
1,740 sq. feet
|
2 baths 3 beds |
show details | |

|
#19
N Hickory St W
North Webster, IN 46555
|
1,595 sq. feet
|
1 baths 3 beds |
show details | |

|
#20
N Center Street Ext
North Webster, IN 46555
|
2,392 sq. feet
|
2 baths 3 beds |
show details |
| Photo | Address | Area | Beds / Baths | Price | Details |
|---|---|---|---|---|---|

|
#21
E Wesley Ln
North Webster, IN 46555
|
1,050 sq. feet
|
1 baths 3 beds |
show details | |

|
#22
W River Dr
Wawaka, IN 46794
|
2,128 sq. feet
|
1 baths 4 beds |
show details | |

|
#23
N Jefferson St
Cromwell, IN 46732
|
1,500 sq. feet
|
1 baths 2 beds |
show details | |

|
#24
W Us Highway 6
Wawaka, IN 46794
|
1,680 sq. feet
|
2 baths 4 beds |
show details | |

|
#25
W Pike St
Goshen, IN 46526
|
1,470 sq. feet
|
1 baths 3 beds |
show details | |

|
#26
Spring Valley Dr
Middlebury, IN 46540
|
1,606 sq. feet
|
1 baths 3 beds |
show details | |

|
#27
County Road 33
Middlebury, IN 46540
|
1,524 sq. feet
|
1 baths 3 beds |
show details | |

|
#28
Lexington Dr
Goshen, IN 46526
|
1,680 sq. feet
|
1 baths 3 beds |
show details | |

|
#29
Ridgepoint Ct
Elkhart, IN 46517
|
2,152 sq. feet
|
1 baths 4 beds |
show details | |

|
#30
Hidden Meadow Ln
Middlebury, IN 46540
|
1,334 sq. feet
|
1 baths 3 beds |
show details |
| Photo | Address | Area | Beds / Baths | Price | Details |
|---|---|---|---|---|---|

|
#31
Blue Heron Dr
Goshen, IN 46528
|
3,624 sq. feet
|
2 baths 4 beds |
show details | |

|
#32
Tippecanoe Dr
Goshen, IN 46526
|
1,728 sq. feet
|
1 baths 5 beds |
show details | |

|
#33
S Main St
Milford, IN 46542
|
2,446 sq. feet
|
1 baths 3 beds |
show details | |

|
#34
Caprice Dr
Middlebury, IN 46540
|
1,188 sq. feet
|
1 baths 3 beds |
show details | |

|
#35
Mandi Ln
Goshen, IN 46528
|
1,236 sq. feet
|
2 baths 3 beds |
show details | |

|
#36
Dundee Ct
Goshen, IN 46528
|
1,548 sq. feet
|
1 baths 4 beds |
show details | |

|
#37
Fieldstone Ln
Middlebury, IN 46540
|
1,238 sq. feet
|
1 baths 3 beds |
show details | |

|
#38
Sequoia Dr
Goshen, IN 46528
|
1,625 sq. feet
|
1 baths 3 beds |
show details | |

|
#39
Blackstone Blvd
Nappanee, IN 46550
|
1,398 sq. feet
|
1 baths 2 beds |
show details | |

|
#40
N 825 E
North Webster, IN 46555
|
1,075 sq. feet
|
1 baths 3 beds |
show details |
| Photo | Address | Area | Beds / Baths | Price | Details |
|---|---|---|---|---|---|

|
#41
Bridgewood Ct
Elkhart, IN 46514
|
2,332 sq. feet
|
1 baths 4 beds |
show details | |

|
#42
E Hazel St
Albion, IN 46701
|
1,266 sq. feet
|
1 baths 3 beds |
show details | |

|
#43
Kershner Ln
Elkhart, IN 46514
|
1,522 sq. feet
|
1 baths 4 beds |
show details | |

|
#44
Monterey Dr
Bristol, IN 46507
|
2,404 sq. feet
|
1 baths 4 beds |
show details | |

|
#45
Kelly Street Ext
Rome City, IN 46784
|
1,424 sq. feet
|
1 baths 2 beds |
show details | |

|
#46
N State Road 5-92
Pierceton, IN 46562
|
2,112 sq. feet
|
2 baths 3 beds |
show details | |

|
#47
Stanford Dr
Bristol, IN 46507
|
1,488 sq. feet
|
1 baths 4 beds |
show details | |

|
#48
N Liberty Dr
Albion, IN 46701
|
1,100 sq. feet
|
1 baths 2 beds |
show details | |

|
#49
County Road 38
Wakarusa, IN 46573
|
3,038 sq. feet
|
1 baths 3 beds |
show details | |

|
Check over 1 million property listings on Foreclosure.com!
|
browse all offers | |||

Latest news about housing in Millersburg, IN collected exclusively by city-data.com from local newspapers, TV, and radio stations

 | Where to park my travel Trailer (3 replies) |
| In need of a rental house in Elkhart County (1 reply) |
| Possible Evansville Relocation (42 replies) |

Median year apartment built: 1975
Household type by relationship:
Households: 675- Male householders: 129 (24 living alone), Female householders: 85 (26 living alone)
118 spouses (118 opposite-sex spouses), 24 unmarried partners, (24 opposite-sex unmarried partners), 289 children (266 natural, 12 adopted, 11 stepchildren), 8 grandchildren, 6 brothers or sisters, 2 parents, 0 foster children, 6 other relatives, 8 non-relatives
Size of family households: 58 2-persons, 23 3-persons, 22 4-persons, 32 5-persons, 5 6-persons, 2 7-or-more-persons.
Size of nonfamily households: 55 1-person, 24 2-persons.
204 married couples with children.
51 single-parent households (19 men, 32 women).
78.7% of residents of Millersburg speak English at home.
10.6% of residents speak Spanish at home (97% speak English very well, 3% speak English not well).
10.1% of residents speak other Indo-European language at home (94% speak English very well, 6% speak English well).
Foreign born population: 4 (0.6%)
(50.0% of them are naturalized citizens)
| Here: | 6.9 |
| State: | 6.6 |
| Here: | 5.0 |
| State: | 4.3 |

- Bedrooms in owner-occupied houses and condos in Millersburg, Indiana
- 0no bedroom
- 11 bedroom
- 252 bedrooms
- 743 bedrooms
- 314 bedrooms
- 195+ bedrooms

- Bedrooms in renter-occupied apartments in Millersburg, Indiana
- 0no bedroom
- 11 bedroom
- 422 bedrooms
- 293 bedrooms
- 04 bedrooms
- 05+ bedrooms

- Cars and other vehicles available in Millersburg in owner-occupied houses/condos
- 3no vehicle
- 391 vehicle
- 642 vehicles
- 293 vehicles
- 64 vehicles
- 75+ vehicles

- Cars and other vehicles available in Millersburg in renter-occupied apartments
- 4no vehicle
- 251 vehicle
- 402 vehicles
- 33 vehicles
- 04 vehicles
- 05+ vehicles

- Rooms in owner-occupied houses in Millersburg, Indiana
- 01 room
- 02 rooms
- 13 rooms
- 64 rooms
- 315 rooms
- 286 rooms
- 247 rooms
- 258 rooms
- 349+ rooms

- Rooms in renter-occupied apartments in Millersburg, Indiana
- 01 room
- 02 rooms
- 43 rooms
- 154 rooms
- 345 rooms
- 206 rooms
- 07 rooms
- 08 rooms
- 09+ rooms


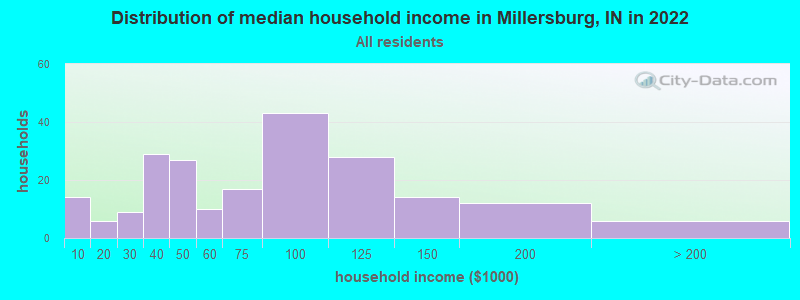
Millersburg, IN household income distribution

- 14Less than $10,000
- 6$10,000 to $19,999
- 9$20,000 to $29,999
- 29$30,000 to $39,999
- 27$40,000 to $49,999
- 10$50,000 to $59,999
- 17$60,000 to $74,999
- 43$75,000 to $99,999
- 28$100,000 to $124,999
- 14$125,000 to $149,999
- 12$150,000 to $199,999
- 6$200,000 or more
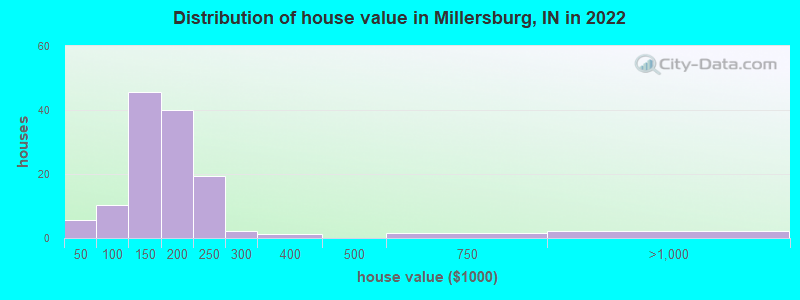
Home value of owner - occupied houses in 2022 in Millersburg, IN
-
- 4$15,000 to $19,999
- 1$40,000 to $49,999
- 1$50,000 to $59,999
- 1$60,000 to $69,999
- 0$70,000 to $79,999
- 2$80,000 to $89,999
- 2$90,000 to $99,999
- 27$100,000 to $124,999
- 18$125,000 to $149,999
- 25$150,000 to $174,999
- 14$175,000 to $199,999
- 19$200,000 to $249,999
- 2$250,000 to $299,999
- 1$300,000 to $399,999
- 1$500,000 to $749,999
- 2$750,000 to $999,999
Rent paid by renters in 2022 in Millersburg, IN
-
- 3$200 to $249
- 18$500 to $549
- 7$650 to $699
- 24$700 to $749
- 2$750 to $799
- 9$800 to $899
- 6$900 to $999
- 10$1,250 to $1,499


Percentage of workers working in this county: 91.5%
Number of people working at home: 1 (0.3% of all workers)
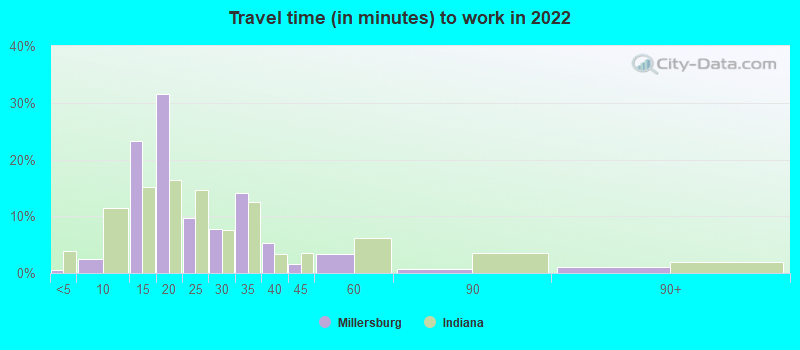
Travel time to work (commute)
- Less than 5 minutes: 9
- 5 to 9 minutes: 33
- 10 to 14 minutes: 56
- 15 to 19 minutes: 77
- 20 to 24 minutes: 48
- 25 to 29 minutes: 10
- 30 to 34 minutes: 22
- 35 to 39 minutes: 17
- 40 to 44 minutes: 5
- 45 to 59 minutes: 2
- 60 to 89 minutes: 6
- 90 or more minutes: 2
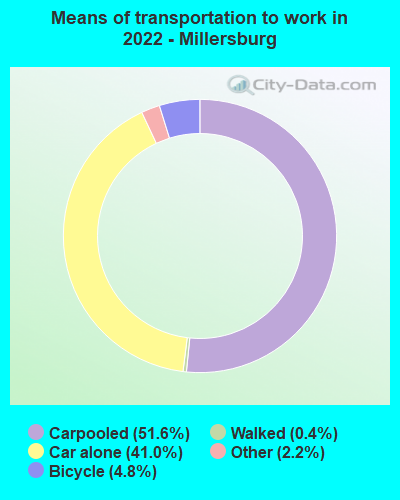
Means of transportation to work:
- Drove a car alone: 485 (39.7%)
- Carpooled: 688 (56.3%)
- Taxi: 34 (2.8%)
- Bicycle: 69 (5.6%)
- Walked: 5 (0.4%)
- Worked at home: 1 (0.1%)

- Unemployment by race in 2022
- Unemployment rate for White non-Hispanic residents
- 2.5%Males
- 0.4%Females
- Unemployment rate for two or more race residents
- 27.6%Males
- Unemployment rate for Hispanic or Latino residents
- 8.3%Males

- Year of entry for the foreign-born population in Millersburg, Indiana
- 02010 or later
- 12000 to 2009
- 31990 to 1999
- 31980 to 1989
- 01970 to 1979
- 5Before 1970

First ancestries reported:
- English: 67 (28.9%)
- American: 50 (21.5%)
- German: 50 (21.5%)
- European: 14 (6.0%)
- Pennsylvania German: 13 (5.6%)
- Swiss: 10 (4.3%)
- Irish: 8 (3.4%)
- Italian: 3 (1.3%)
- Scottish: 3 (1.3%)
- Dutch: 2 (0.9%)
- French: 1 (0.4%)
Most common places of birth for foreign-born residents (%):
| Millersburg: | 100.0% (4) |
| Indiana: | 27.0% (101,996) |
Place of birth for U.S.-born residents:
- This state: 558
- Other state: 105
- Northeast: 3
- Midwest: 70
- South: 15
- West: 16
90.9% of Millersburg residents lived in the same house 1 years ago.
Out of people who lived in different houses, 30.5% lived in this county.
Out of people who lived in different counties, 80.0% lived in Indiana.
| Millersburg: | 90.9% |
| State average: | 87.1% |
Education attainment for males 25 years and older:
- No schooling: 13
- Nursery to 4th grade: 0
- 5th and 6th grade: 0
- 7th and 8th grade: 32
- 9th grade: 2
- 10th grade: 5
- 11th grade: 0
- 12th grade, no diploma: 4
- High school graduate (or equivalency): 64
- Less than 1 year of college: 9
- Some college more than 1 year, no degree: 14
- Associate degree: 8
- Bachelor's degree: 17
- Master's degree: 2
- Professional school degree: 0
- Doctorate degree: 0

Education attainment for females 25 years and older:
- No schooling: 1
- Nursery to 4th grade: 0
- 5th and 6th grade: 2
- 7th and 8th grade: 49
- 9th grade: 1
- 10th grade: 1
- 11th grade: 0
- 12th grade, no diploma: 1
- High school graduate (or equivalency): 62
- Less than 1 year of college: 15
- Some college more than 1 year, no degree: 10
- Associate degree: 14
- Bachelor's degree: 25
- Master's degree: 5
- Professional school degree: 0
- Doctorate degree: 0


Housing units in structures:
- One, detached: 199
- Two: 11
- 3 or 4: 19
- 5 to 9: 3
- Mobile homes: 3
- Boats, RVs, vans, etc.: 1
House/condo owner moved in on average 11 years ago
Renter moved in on average 1 years ago

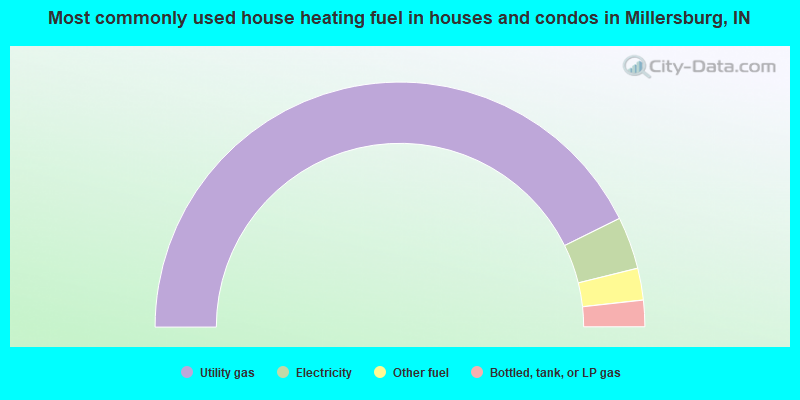
- 85.4%Utility gas
- 6.9%Electricity
- 4.2%Other fuel
- 3.5%Bottled, tank, or LP gas
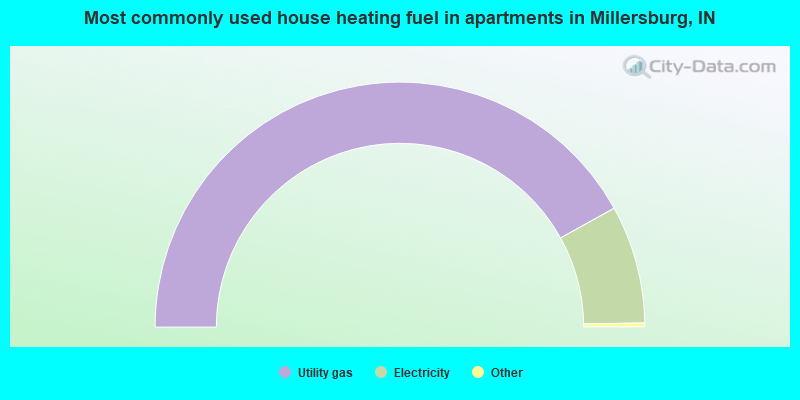
- 84.3%Utility gas
- 15.7%Electricity
Private vs. public school enrollment:
| Here: | 15.5% |
| Indiana: | 14.9% |
| Here: | 0.0% |
| Indiana: | 11.4% |
| Here: | 0.0% |
| Indiana: | 22.3% |


