Milltown, IN (Indiana) Houses and Residents
| Milltown: | $134,359 |
| Indiana: | $208,700 |
Mean price in 2022:
Detached houses: $158,951
Here: $158,951 State: $257,916 Mobile homes: $69,517
Here: $69,517 State: $67,116
Total population: 807 (Urban population: 0, Rural population: 925 (10 farm, 915 nonfarm))
Houses: 449 (353 occupied: 238 owner occupied, 119 renter occupied)
| % of renters here: | 33% |
| State: | 29% |
Housing density: 319 houses/condos per square mile
Median price asked for vacant for-sale houses and condos in 2022: $112,726.
Median contract rent in 2022: $461 (lower quartile is $230, upper quartile is $542)
Median rent asked for vacant for-rent units in 2022: $2,064
Median gross rent in Milltown, IN in 2022: $600
Housing units in Milltown with a mortgage: 123 (13 second mortgage, 0 home equity loan, 13 both second mortgage and home equity loan)
Houses without a mortgage: 9
Median household income for houses/condos with a mortgage: $66,387
Median household income for apartments without a mortgage: $80,708
Median monthly housing costs: $612
Compare current foreclosures near Milltown, IN:
| Photo | Address | Area | Beds / Baths | Price | Details |
|---|---|---|---|---|---|

|
#1
N Milltown Rd
Milltown, IN 47145
|
1,554 sq. feet
|
1 baths 3 beds |
show details | |

|
#2
S Whiskey Run Ranch Rd
Milltown, IN 47145
|
1,344 sq. feet
|
1 baths 3 beds |
show details | |

|
#3
N State Road 66
Milltown, IN 47145
|
1,628 sq. feet
|
2 baths 3 beds |
show details | |

|
#4
N State Road 66
Milltown, IN 47145
|
- sq. feet
|
- baths - beds |
show details | |

|
#5
Indiana Ave
Milltown, IN 47145
|
- sq. feet
|
- baths - beds |
show details | |

|
#6
N State Road 66
Milltown, IN 47145
|
- sq. feet
|
- baths - beds |
show details | |

|
#7
Indiana Ave
Milltown, IN 47145
|
- sq. feet
|
- baths - beds |
show details | |

|
#8
S Trestle Rd
Taswell, IN 47175
|
- sq. feet
|
4 baths 4 beds |
show details | |

|
#9
Highway 150 NE
Palmyra, IN 47164
|
1,528 sq. feet
|
1 baths 2 beds |
show details | |

|
#10
Coen Tush Rd
Greenville, IN 47124
|
1,536 sq. feet
|
2 baths 3 beds |
show details |
| Photo | Address | Area | Beds / Baths | Price | Details |
|---|---|---|---|---|---|

|
#11
Snyders Chapel Rd NE
Palmyra, IN 47164
|
1,025 sq. feet
|
1 baths 3 beds |
show details | |

|
#12
Cross Creek Dr NE
Greenville, IN 47124
|
1,632 sq. feet
|
2 baths 3 beds |
show details | |

|
#13
W Poplar St
Corydon, IN 47112
|
1,477 sq. feet
|
1 baths 2 beds |
show details | |

|
#14
S West Washington School Rd
Salem, IN 47167
|
1,860 sq. feet
|
1 baths 3 beds |
show details | |

|
#15
Dale Ave
Corydon, IN 47112
|
1,278 sq. feet
|
1 baths 3 beds |
show details | |

|
#16
Brigetta Dr NE
Corydon, IN 47112
|
1,260 sq. feet
|
2 baths 3 beds |
show details | |

|
#17
N Bradford Rd NE
Palmyra, IN 47164
|
974 sq. feet
|
1 baths 2 beds |
show details | |

|
#18
Grange Hall Rd NE
Corydon, IN 47112
|
1,860 sq. feet
|
2 baths 4 beds |
show details | |

|
#19
School Ln NE
Palmyra, IN 47164
|
1,188 sq. feet
|
1 baths 3 beds |
show details | |

|
#20
Old Forest Rd NW
Corydon, IN 47112
|
1,040 sq. feet
|
1 baths 3 beds |
show details |
| Photo | Address | Area | Beds / Baths | Price | Details |
|---|---|---|---|---|---|

|
#21
S Townsend Dr
Leavenworth, IN 47137
|
1,584 sq. feet
|
2 baths 3 beds |
show details | |

|
#22
Old Forest Rd SW
Corydon, IN 47112
|
1,700 sq. feet
|
2 baths 4 beds |
show details | |

|
#23
W Cole Hollow Rd
Campbellsburg, IN 47108
|
568 sq. feet
|
1 baths 3 beds |
show details | |

|
#24
S Arlay Brown Rd
Salem, IN 47167
|
1,056 sq. feet
|
1 baths 2 beds |
show details | |

|
#25
Seneca Dr NE
Georgetown, IN 47122
|
1,488 sq. feet
|
2 baths 3 beds |
show details | |

|
#26
Corydon Ridge Rd NE
Lanesville, IN 47136
|
1,530 sq. feet
|
2 baths 3 beds |
show details | |

|
#27
Dixie Rd SW
Mauckport, IN 47142
|
1,312 sq. feet
|
1 baths 3 beds |
show details | |

|
#28
S Wild Southview Dr
Paoli, IN 47454
|
1,674 sq. feet
|
2 baths 4 beds |
show details | |

|
#29
S Wild Bluegrass Dr
Paoli, IN 47454
|
2,688 sq. feet
|
2 baths 3 beds |
show details | |

|
#30
Tom Evans Rd
Greenville, IN 47124
|
996 sq. feet
|
1 baths 3 beds |
show details |
| Photo | Address | Area | Beds / Baths | Price | Details |
|---|---|---|---|---|---|

|
#31
Georgetown Lanesville Rd
Georgetown, IN 47122
|
2,562 sq. feet
|
3 baths 5 beds |
show details | |

|
#32
High St
Georgetown, IN 47122
|
1,518 sq. feet
|
1 baths 2 beds |
show details | |

|
#33
Fogel Rd SE
Corydon, IN 47112
|
1,152 sq. feet
|
2 baths 3 beds |
show details | |

|
#34
Smith Hill Rd SE
Corydon, IN 47112
|
1,200 sq. feet
|
1 baths 3 beds |
show details | |

|
#35
Country Ln NE
Lanesville, IN 47136
|
1,794 sq. feet
|
2 baths 4 beds |
show details | |

|
#36
N Red Hill Rd
Taswell, IN 47175
|
1,176 sq. feet
|
1 baths 3 beds |
show details | |

|
#37
Harrison St
Greenville, IN 47124
|
1,044 sq. feet
|
1 baths 2 beds |
show details | |

|
#38
W State Road 56
Campbellsburg, IN 47108
|
2,524 sq. feet
|
2 baths 5 beds |
show details | |

|
#39
S Beechwood Rd
Leavenworth, IN 47137
|
2,020 sq. feet
|
2 baths 3 beds |
show details | |

|
#40
Dogwood Dr NE
New Salisbury, IN 47161
|
1,092 sq. feet
|
1 baths 3 beds |
show details |
| Photo | Address | Area | Beds / Baths | Price | Details |
|---|---|---|---|---|---|

|
#41
S Possum Hollow Rd
Campbellsburg, IN 47108
|
1,384 sq. feet
|
2 baths 3 beds |
show details | |

|
#42
Lenrose Ln NW
Corydon, IN 47112
|
2,072 sq. feet
|
2 baths 3 beds |
show details | |

|
#43
W Posey Chapel Rd
Salem, IN 47167
|
1,008 sq. feet
|
1 baths 3 beds |
show details | |

|
#44
Borden Rd
Greenville, IN 47124
|
1,056 sq. feet
|
1 baths 3 beds |
show details | |

|
#45
S White Oak Cir
Marengo, IN 47140
|
1,050 sq. feet
|
1 baths 3 beds |
show details | |

|
#46
Burgess Circle Rd NW
Depauw, IN 47115
|
992 sq. feet
|
1 baths 2 beds |
show details | |

|
#47
Highway 64 NW
Ramsey, IN 47166
|
3,215 sq. feet
|
2 baths 4 beds |
show details | |

|
#48
Cross Rd NW
Fredericksburg, IN 47120
|
1,634 sq. feet
|
1 baths 5 beds |
show details | |

|
#49
E State Road 64
English, IN 47118
|
1,024 sq. feet
|
1 baths 2 beds |
show details | |

|
Check over 1 million property listings on Foreclosure.com!
|
browse all offers | |||

Latest news about housing in Milltown, IN collected exclusively by city-data.com from local newspapers, TV, and radio stations

 | 1 Hour from Louisville-all points North! :D (10 replies) |

Median year apartment built: 1970
Household type by relationship:
Households: 889- Male householders: 167 (46 living alone), Female householders: 183 (54 living alone)
166 spouses (159 opposite-sex spouses), 15 unmarried partners, (15 opposite-sex unmarried partners), 285 children (213 natural, 5 adopted, 66 stepchildren), 19 grandchildren, 3 brothers or sisters, 6 parents, 0 foster children, 9 other relatives, 35 non-relatives
Size of family households: 113 2-persons, 39 3-persons, 42 4-persons, 19 5-persons, 6 6-persons, 6 7-or-more-persons.
Size of nonfamily households: 103 1-person, 24 2-persons, 1 3-persons.
113 married couples with children.
42 single-parent households (21 men, 21 women).
98.7% of residents of Milltown speak English at home.
0.2% of residents speak other Indo-European language at home (100% speak English well).
| Here: | 6.1 |
| State: | 6.6 |
| Here: | 4.2 |
| State: | 4.3 |

- Bedrooms in owner-occupied houses and condos in Milltown, Indiana
- 0no bedroom
- 31 bedroom
- 422 bedrooms
- 1563 bedrooms
- 374 bedrooms
- 05+ bedrooms

- Bedrooms in renter-occupied apartments in Milltown, Indiana
- 0no bedroom
- 421 bedroom
- 272 bedrooms
- 453 bedrooms
- 54 bedrooms
- 05+ bedrooms

- Cars and other vehicles available in Milltown in owner-occupied houses/condos
- 9no vehicle
- 421 vehicle
- 842 vehicles
- 613 vehicles
- 314 vehicles
- 115+ vehicles

- Cars and other vehicles available in Milltown in renter-occupied apartments
- 35no vehicle
- 281 vehicle
- 402 vehicles
- 163 vehicles
- 04 vehicles
- 05+ vehicles

- Rooms in owner-occupied houses in Milltown, Indiana
- 01 room
- 02 rooms
- 03 rooms
- 164 rooms
- 715 rooms
- 506 rooms
- 287 rooms
- 278 rooms
- 469+ rooms

- Rooms in renter-occupied apartments in Milltown, Indiana
- 01 room
- 12 rooms
- 253 rooms
- 404 rooms
- 255 rooms
- 126 rooms
- 47 rooms
- 128 rooms
- 09+ rooms


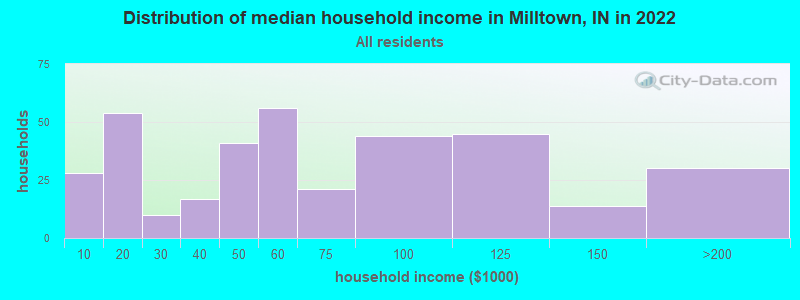
Milltown, IN household income distribution

- 28Less than $10,000
- 54$10,000 to $19,999
- 10$20,000 to $29,999
- 17$30,000 to $39,999
- 41$40,000 to $49,999
- 56$50,000 to $59,999
- 21$60,000 to $74,999
- 44$75,000 to $99,999
- 45$100,000 to $124,999
- 14$125,000 to $149,999
- 29$150,000 to $199,999
- 1$200,000 or more
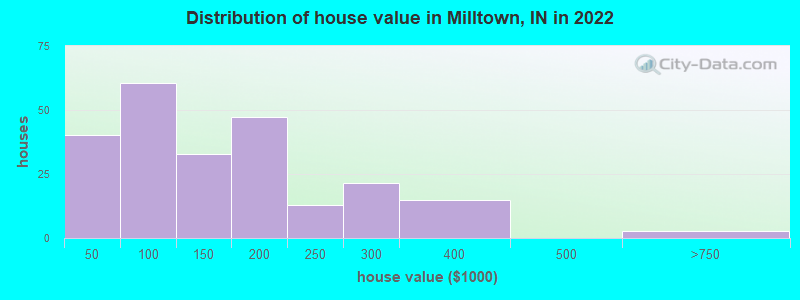
Home value of owner - occupied houses in 2022 in Milltown, IN
-
- 9Less than $10,000
- 4$10,000 to $14,999
- 3$15,000 to $19,999
- 3$20,000 to $24,999
- 5$30,000 to $34,999
- 14$40,000 to $49,999
- 5$50,000 to $59,999
- 8$60,000 to $69,999
- 21$80,000 to $89,999
- 11$90,000 to $99,999
- 19$100,000 to $124,999
- 13$125,000 to $149,999
- 24$150,000 to $174,999
- 22$175,000 to $199,999
- 12$200,000 to $249,999
- 21$250,000 to $299,999
- 14$300,000 to $399,999
- 2$500,000 to $749,999
Rent paid by renters in 2022 in Milltown, IN
-
- 18$150 to $199
- 20$200 to $249
- 9$300 to $349
- 9$400 to $449
- 14$450 to $499
- 34$500 to $549
- 2$550 to $599
- 0$700 to $749
- 2$750 to $799
- 2$900 to $999
- 5No cash rent


Percentage of workers working in this county: 37.8%
Number of people working at home: 22 (5.2% of all workers)
Travel time to work (commute)
- Less than 5 minutes: 2
- 5 to 9 minutes: 7
- 10 to 14 minutes: 13
- 15 to 19 minutes: 25
- 20 to 24 minutes: 55
- 25 to 29 minutes: 40
- 30 to 34 minutes: 54
- 35 to 39 minutes: 2
- 40 to 44 minutes: 18
- 45 to 59 minutes: 78
- 60 to 89 minutes: 81
- 90 or more minutes: 12
Means of transportation to work:
- Drove a car alone: 352 (81.3%)
- Carpooled: 70 (16.2%)
- Walked: 3 (0.7%)
- Worked at home: 8 (1.8%)

- Unemployment by race in 2022
- Unemployment rate for White non-Hispanic residents
- 2.9%Males
- 12.6%Females

- Year of entry for the foreign-born population in Milltown, Indiana
- 01995 to March 2000
- 01990 to 1994
- 01985 to 1989
- 01980 to 1984
- 01975 to 1979
- 01970 to 1974
- 01965 to 1969
- 2Before 1965

First ancestries reported:
- American: 93 (29.2%)
- German: 65 (20.4%)
- English: 39 (12.2%)
- Irish: 31 (9.7%)
- Italian: 9 (2.8%)
- Dutch: 4 (1.3%)
- Scottish: 3 (0.9%)
- French: 1 (0.3%)
Most common places of birth for foreign-born residents (%):
| Milltown: | 100.0% (2) |
| Indiana: | 3.8% (7,083) |
Place of birth for U.S.-born residents:
- This state: 625
- Other state: 258
- Northeast: 24
- Midwest: 34
- South: 178
- West: 16
94.2% of Milltown residents lived in the same house 1 years ago.
Out of people who lived in different houses, 9.8% lived in this county.
Out of people who lived in different counties, 98.0% lived in Indiana.
| Milltown: | 94.2% |
| State average: | 87.1% |
Education attainment for males 25 years and older:
- No schooling: 2
- Nursery to 4th grade: 0
- 5th and 6th grade: 0
- 7th and 8th grade: 2
- 9th grade: 11
- 10th grade: 4
- 11th grade: 0
- 12th grade, no diploma: 0
- High school graduate (or equivalency): 148
- Less than 1 year of college: 12
- Some college more than 1 year, no degree: 29
- Associate degree: 40
- Bachelor's degree: 5
- Master's degree: 5
- Professional school degree: 3
- Doctorate degree: 0

Education attainment for females 25 years and older:
- No schooling: 0
- Nursery to 4th grade: 0
- 5th and 6th grade: 3
- 7th and 8th grade: 6
- 9th grade: 5
- 10th grade: 3
- 11th grade: 1
- 12th grade, no diploma: 11
- High school graduate (or equivalency): 123
- Less than 1 year of college: 53
- Some college more than 1 year, no degree: 27
- Associate degree: 40
- Bachelor's degree: 22
- Master's degree: 6
- Professional school degree: 0
- Doctorate degree: 8


Housing units in structures:
- One, detached: 353
- One, attached: 14
- 3 or 4: 1
- 5 to 9: 14
- 20 to 49: 11
- Mobile homes: 55
Median worth of mobile homes: $111,294
Housing units lacking complete kitchen facilities in 2022: 14.0%
House/condo owner moved in on average 16 years ago
Renter moved in on average 4 years ago

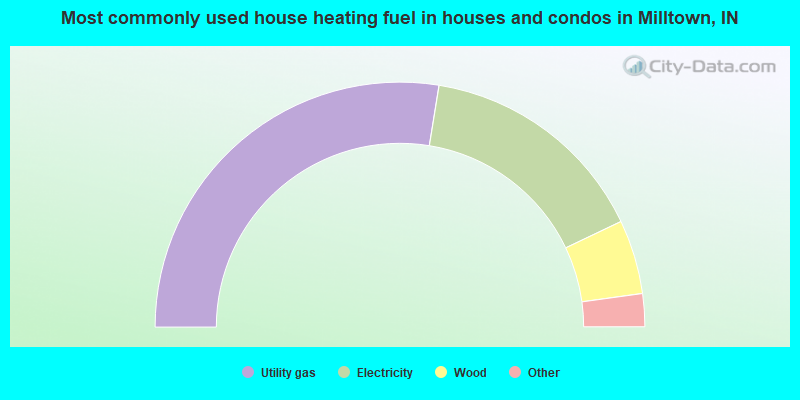
- 55.6%Utility gas
- 31.0%Electricity
- 9.9%Wood
- 2.2%Bottled, tank, or LP gas
- 0.9%Fuel oil, kerosene, etc.
- 0.4%No fuel used
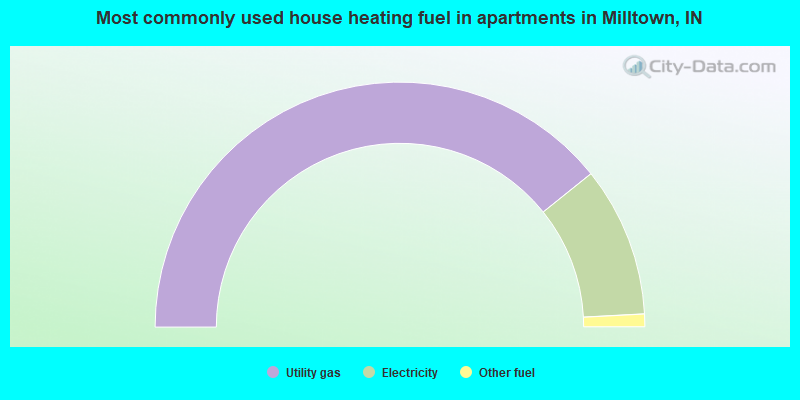
- 78.4%Utility gas
- 19.8%Electricity
- 1.7%Other fuel
Private vs. public school enrollment:
| Here: | 11.1% |
| Indiana: | 14.9% |
| Here: | 2.3% |
| Indiana: | 11.4% |
| Here: | 12.5% |
| Indiana: | 22.3% |


