Millville, CA (California) Houses and Residents
| Millville: | $383,833 |
| California: | $715,900 |
Mean price in 2022:
Detached houses: $768,879
Here: $768,879 State: $988,808
Total population: 727 (Urban population: 0, Rural population: 592 (30 farm, 562 nonfarm))
Houses: 343 (311 occupied: 264 owner occupied, 46 renter occupied)
| % of renters here: | 15% |
| State: | 44% |
Housing density: 41 houses/condos per square mile
Median price asked for vacant for-sale houses and condos in 2022 in this county: $232,775.
Median contract rent in 2022: $996 (lower quartile is $712, upper quartile is $1,136)
Median rent asked for vacant for-rent units in 2022: $784
Median gross rent in Millville, CA in 2022: $1,270
Housing units in Millville with a mortgage: 142 (19 second mortgage, 0 home equity loan, 19 both second mortgage and home equity loan)
Houses without a mortgage: 0
Median household income for houses/condos with a mortgage: $173,686
Median household income for apartments without a mortgage: $46,909
Median monthly housing costs: $1,409
Compare current foreclosures near Millville, CA:
| Photo | Address | Area | Beds / Baths | Price | Details |
|---|---|---|---|---|---|

|
#1
Oasis Rd
Redding, CA 96003
|
1,233 sq. feet
|
2 baths 3 beds |
$109,900
|
show details |

|
#2
Leonard Dr
Redding, CA 96001
|
1,550 sq. feet
|
2 baths 3 beds |
show details | |

|
#3
Hartnell Ave
Redding, CA 96002
|
- sq. feet
|
1 baths 3 beds |
show details | |

|
#4
Lloyd Ln
Anderson, CA 96007
|
800 sq. feet
|
1 baths 2 beds |
show details | |

|
#5
Regal Ave
Redding, CA 96002
|
1,305 sq. feet
|
1 baths 3 beds |
show details | |

|
#6
Franklin St
Anderson, CA 96007
|
1,086 sq. feet
|
2 baths 3 beds |
show details | |

|
#7
Big Horn Dr
Redding, CA 96002
|
2,539 sq. feet
|
3 baths 4 beds |
show details | |

|
#8
Mccann Rd
Cottonwood, CA 96022
|
1,482 sq. feet
|
2 baths 3 beds |
show details | |

|
#9
Deer Creek Rd
Shasta Lake, CA 96019
|
- sq. feet
|
2 baths 2 beds |
show details | |

|
#10
Sharon Ave
Anderson, CA 96007
|
1,162 sq. feet
|
2 baths 3 beds |
show details |
| Photo | Address | Area | Beds / Baths | Price | Details |
|---|---|---|---|---|---|

|
#11
Hunting Club Rd
Palo Cedro, CA 96073
|
- sq. feet
|
3 baths 3 beds |
show details | |

|
#12
Bowman Rd
Cottonwood, CA 96022
|
1,500 sq. feet
|
2 baths 3 beds |
show details | |

|
#13
Jaxon Way
Redding, CA 96003
|
1,400 sq. feet
|
2 baths 3 beds |
show details | |

|
#14
Newport Dr
Redding, CA 96001
|
- sq. feet
|
2 baths 3 beds |
show details | |

|
#15
Chico St
Shasta Lake, CA 96019
|
- sq. feet
|
2 baths 3 beds |
show details | |

|
#16
Melody Ln
Redding, CA 96001
|
- sq. feet
|
2 baths 3 beds |
show details | |

|
#17
Antler Way
Cottonwood, CA 96022
|
1,516 sq. feet
|
2 baths 3 beds |
show details | |

|
#18
La Mesa Ave
Shasta Lake, CA 96019
|
- sq. feet
|
2 baths 3 beds |
show details | |

|
#19
Bowman Rd
Cottonwood, CA 96022
|
1,943 sq. feet
|
1 baths 2 beds |
show details | |

|
#20
Zapatero Ln
Cottonwood, CA 96022
|
2,050 sq. feet
|
2 baths 3 beds |
show details |
| Photo | Address | Area | Beds / Baths | Price | Details |
|---|---|---|---|---|---|

|
#21
Lodgepole Ave
Anderson, CA 96007
|
- sq. feet
|
2 baths 3 beds |
show details | |

|
#22
Broadhurst Rd
Cottonwood, CA 96022
|
1,196 sq. feet
|
2 baths 3 beds |
show details | |

|
#23
Ironwood Ln
Redding, CA 96003
|
- sq. feet
|
2 baths 3 beds |
show details | |

|
#24
Eagle Nest Rd
Redding, CA 96003
|
- sq. feet
|
4 baths 4 beds |
show details | |

|
#25
Pinon Ave
Anderson, CA 96007
|
- sq. feet
|
2 baths 3 beds |
show details | |

|
#26
Maynard Rd
Palo Cedro, CA 96073
|
- sq. feet
|
2 baths 3 beds |
show details | |

|
#27
Riviera Dr
Redding, CA 96001
|
- sq. feet
|
2 baths 3 beds |
show details | |

|
#28
Ridge Rd
Redding, CA 96003
|
- sq. feet
|
2 baths 3 beds |
show details | |

|
#29
Spanish Bay Dr
Redding, CA 96003
|
- sq. feet
|
2 baths 3 beds |
show details | |

|
#30
Canyon Rd
Redding, CA 96001
|
- sq. feet
|
2 baths 3 beds |
show details |
| Photo | Address | Area | Beds / Baths | Price | Details |
|---|---|---|---|---|---|

|
#31
Del Mar Ave
Redding, CA 96003
|
- sq. feet
|
2 baths 2 beds |
show details | |

|
#32
Branstetter Ln
Redding, CA 96001
|
- sq. feet
|
2 baths 3 beds |
show details | |

|
#33
Vandiver Ln
Redding, CA 96001
|
- sq. feet
|
1 baths 2 beds |
show details | |

|
#34
Lookout Ct
Redding, CA 96001
|
- sq. feet
|
2 baths 3 beds |
show details | |

|
#35
Merle Dr
Redding, CA 96001
|
- sq. feet
|
2 baths 3 beds |
show details | |

|
#36
Memory Ln
Redding, CA 96001
|
- sq. feet
|
2 baths 3 beds |
show details | |

|
#37
Howard Dr
Redding, CA 96001
|
- sq. feet
|
2 baths 3 beds |
show details | |

|
#38
Shasta Way
Shasta Lake, CA 96019
|
- sq. feet
|
1 baths 2 beds |
show details | |

|
#39
Winding Way
Redding, CA 96003
|
- sq. feet
|
2 baths 3 beds |
show details | |

|
#40
Ranchera Rd
Shasta Lake, CA 96019
|
- sq. feet
|
3 baths 4 beds |
show details |
| Photo | Address | Area | Beds / Baths | Price | Details |
|---|---|---|---|---|---|

|
#41
California St
Redding, CA 96001
|
- sq. feet
|
2 baths 3 beds |
show details | |

|
#42
Dogwood Dr
Shingletown, CA 96088
|
- sq. feet
|
2 baths 3 beds |
show details | |

|
#43
Clarabelle Ln
Shingletown, CA 96088
|
- sq. feet
|
1 baths 2 beds |
show details | |

|
#44
Oak Ln
Cottonwood, CA 96022
|
- sq. feet
|
2 baths 3 beds |
show details | |

|
#45
Dennis Ct
Redding, CA 96001
|
- sq. feet
|
1 baths 2 beds |
show details | |

|
#46
Glendive Ln
Redding, CA 96001
|
- sq. feet
|
3 baths 3 beds |
show details | |

|
#47
Yellow Pine Ave
Shasta Lake, CA 96019
|
- sq. feet
|
3 baths 3 beds |
show details | |

|
#48
La Shelle Ln
Redding, CA 96003
|
- sq. feet
|
2 baths 4 beds |
show details | |

|
#49
Ouray St
Shasta Lake, CA 96019
|
- sq. feet
|
2 baths 3 beds |
show details | |

|
Check over 1 million property listings on Foreclosure.com!
|
browse all offers | |||

Latest news about housing in Millville, CA collected exclusively by city-data.com from local newspapers, TV, and radio stations


Median year apartment built: 1980
Household type by relationship:
Households: 789- Male householders: 116 (13 living alone), Female householders: 192 (67 living alone)
233 spouses (233 opposite-sex spouses), 5 unmarried partners, (5 opposite-sex unmarried partners), 210 children (195 natural, 9 adopted, 5 stepchildren), 4 grandchildren, 0 brothers or sisters, 9 parents, 0 foster children, 0 other relatives, 15 non-relatives
Size of family households: 100 2-persons, 57 3-persons, 27 4-persons, 10 5-persons.
Size of nonfamily households: 90 1-person, 17 2-persons.
68 married couples with children.
0 single-parent households (0 men, 0 women).
98.1% of residents of Millville speak English at home.
0.4% of residents speak Spanish at home (100% speak English very well).
0.6% of residents speak other Indo-European language at home (100% speak English very well).
0.4% of residents speak other language at home (100% speak English very well).
Foreign born population: 7 (0.9%)
(57.1% of them are naturalized citizens)
| Here: | 6.1 |
| State: | 6.0 |
| Here: | 6.0 |
| State: | 3.9 |

- Bedrooms in owner-occupied houses and condos in Millville, California
- 0no bedroom
- 141 bedroom
- 132 bedrooms
- 1993 bedrooms
- 384 bedrooms
- 05+ bedrooms

- Bedrooms in renter-occupied apartments in Millville, California
- 0no bedroom
- 01 bedroom
- 02 bedrooms
- 463 bedrooms
- 04 bedrooms
- 05+ bedrooms

- Cars and other vehicles available in Millville in owner-occupied houses/condos
- 5no vehicle
- 511 vehicle
- 452 vehicles
- 833 vehicles
- 584 vehicles
- 225+ vehicles

- Cars and other vehicles available in Millville in renter-occupied apartments
- 0no vehicle
- 131 vehicle
- 82 vehicles
- 223 vehicles
- 04 vehicles
- 35+ vehicles

- Rooms in owner-occupied houses in Millville, California
- 01 room
- 02 rooms
- 203 rooms
- 54 rooms
- 275 rooms
- 1366 rooms
- 377 rooms
- 118 rooms
- 289+ rooms

- Rooms in renter-occupied apartments in Millville, California
- 01 room
- 02 rooms
- 03 rooms
- 44 rooms
- 115 rooms
- 136 rooms
- 187 rooms
- 08 rooms
- 09+ rooms


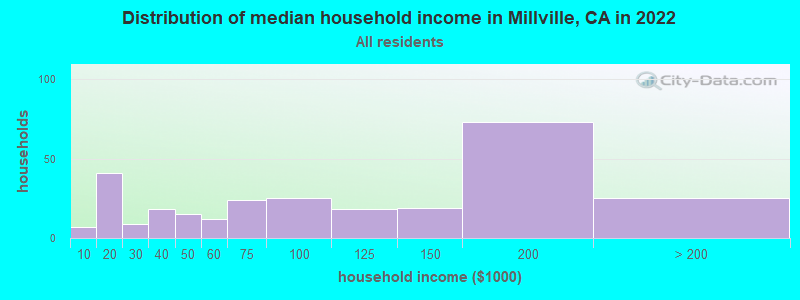
Millville, CA household income distribution

- 7Less than $10,000
- 41$10,000 to $19,999
- 9$20,000 to $29,999
- 18$30,000 to $39,999
- 15$40,000 to $49,999
- 12$50,000 to $59,999
- 24$60,000 to $74,999
- 25$75,000 to $99,999
- 18$100,000 to $124,999
- 19$125,000 to $149,999
- 73$150,000 to $199,999
- 25$200,000 or more
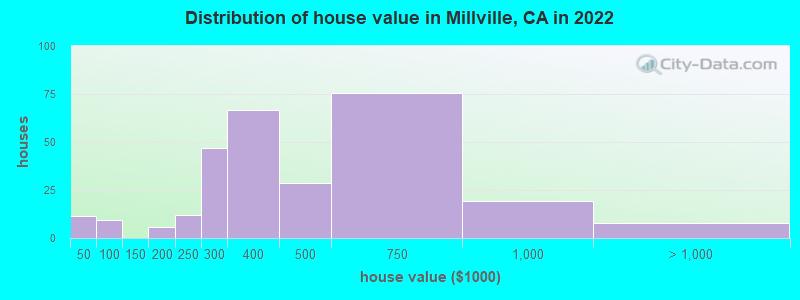
Home value of owner - occupied houses in 2022 in Millville, CA
-
- 8Less than $10,000
- 3$40,000 to $49,999
- 3$50,000 to $59,999
- 3$90,000 to $99,999
- 5$175,000 to $199,999
- 11$200,000 to $249,999
- 47$250,000 to $299,999
- 66$300,000 to $399,999
- 28$400,000 to $499,999
- 75$500,000 to $749,999
- 19$750,000 to $999,999
- 5$1,000,000 to $1,499,999
- 2$2,000,000 or more
Rent paid by renters in 2022 in Millville, CA
-
- 17$700 to $749
- 12$1,000 to $1,249
- 7$1,250 to $1,499
- 17No cash rent


Percentage of workers working in this county: 95.8%
Number of people working at home: 54 (12.6% of all workers)
Travel time to work (commute)
- Less than 5 minutes: 0
- 5 to 9 minutes: 46
- 10 to 14 minutes: 3
- 15 to 19 minutes: 37
- 20 to 24 minutes: 177
- 25 to 29 minutes: 89
- 30 to 34 minutes: 24
- 35 to 39 minutes: 0
- 40 to 44 minutes: 0
- 45 to 59 minutes: 7
- 60 to 89 minutes: 6
- 90 or more minutes: 0
Means of transportation to work:
- Drove a car alone: 237 (82.3%)
- Carpooled: 25 (8.7%)
- Worked at home: 26 (9.0%)

- Unemployment by race in 2022
- Unemployment rate for White non-Hispanic residents
- 2.5%Males
- 4.2%Females
- Unemployment rate for two or more race residents
- 39.3%Females

- Year of entry for the foreign-born population in Millville, California
- 02010 or later
- 02000 to 2009
- 31990 to 1999
- 01980 to 1989
- 21970 to 1979
- 10Before 1970

First ancestries reported:
- American: 42 (18.1%)
- Irish: 39 (16.8%)
- German: 37 (15.9%)
- European: 18 (7.7%)
- English: 13 (5.6%)
- Northern European: 7 (3.0%)
- Danish: 6 (2.6%)
- Italian: 6 (2.6%)
- Basque: 4 (1.7%)
- Czech: 4 (1.7%)
- Scottish: 4 (1.7%)
- Swiss: 4 (1.7%)
- Portuguese: 3 (1.3%)
- Swedish: 2 (0.9%)
Most common places of birth for foreign-born residents (%):
| Millville: | 57.1% (4) |
| California: | 0.1% (9,159) |
| Millville: | 42.9% (3) |
| California: | 0.5% (55,249) |
Place of birth for U.S.-born residents:
- This state: 650
- Other state: 125
- Northeast: 12
- Midwest: 41
- South: 56
- West: 17
100.6% of Millville residents lived in the same house 1 years ago.
Out of people who lived in different houses, 42.9% lived in this county.
Out of people who lived in different counties, 0.0% lived in California.
| Millville: | 100.6% |
| State average: | 88.9% |
Education attainment for males 25 years and older:
- No schooling: 0
- Nursery to 4th grade: 0
- 5th and 6th grade: 0
- 7th and 8th grade: 0
- 9th grade: 0
- 10th grade: 0
- 11th grade: 0
- 12th grade, no diploma: 0
- High school graduate (or equivalency): 71
- Less than 1 year of college: 77
- Some college more than 1 year, no degree: 40
- Associate degree: 19
- Bachelor's degree: 37
- Master's degree: 18
- Professional school degree: 0
- Doctorate degree: 3

Education attainment for females 25 years and older:
- No schooling: 0
- Nursery to 4th grade: 0
- 5th and 6th grade: 0
- 7th and 8th grade: 0
- 9th grade: 0
- 10th grade: 0
- 11th grade: 0
- 12th grade, no diploma: 20
- High school graduate (or equivalency): 58
- Less than 1 year of college: 64
- Some college more than 1 year, no degree: 45
- Associate degree: 28
- Bachelor's degree: 92
- Master's degree: 16
- Professional school degree: 3
- Doctorate degree: 2


Housing units in structures:
- One, detached: 323
- One, attached: 7
- Mobile homes: 12
Housing units lacking complete kitchen facilities in 2022: 3.8%
House/condo owner moved in on average 20 years ago
Renter moved in on average 12 years ago

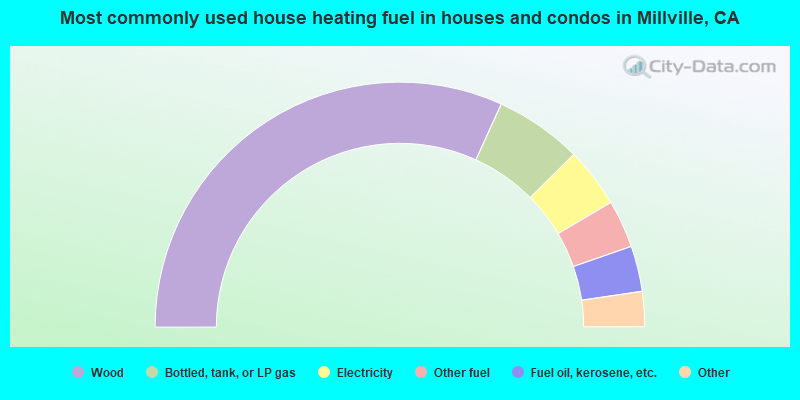
- 64.4%Wood
- 11.7%Bottled, tank, or LP gas
- 8.0%Electricity
- 6.4%Other fuel
- 6.1%Fuel oil, kerosene, etc.
- 2.7%Solar energy
- 0.8%Utility gas
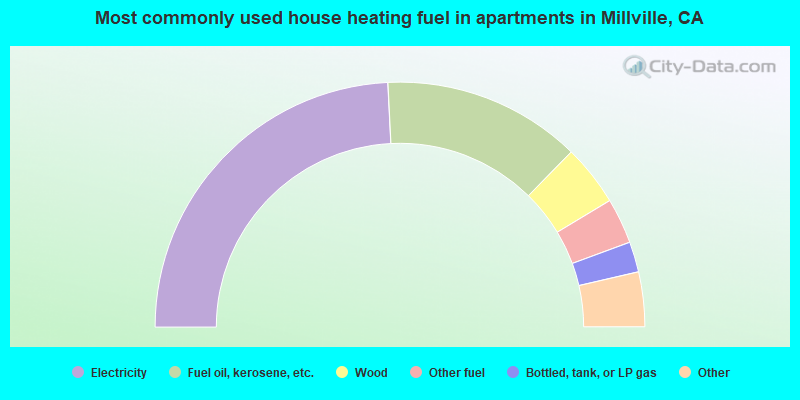
- 52.2%Electricity
- 28.3%Fuel oil, kerosene, etc.
- 8.7%Wood
- 6.5%Other fuel
- 4.3%Bottled, tank, or LP gas
Private vs. public school enrollment:
| Here: | 35.5% |
| California: | 10.5% |
| Here: | 1.9% |
| California: | 8.5% |
| Here: | 18.2% |
| California: | 15.9% |


