Millville, PA (Pennsylvania) Houses and Residents
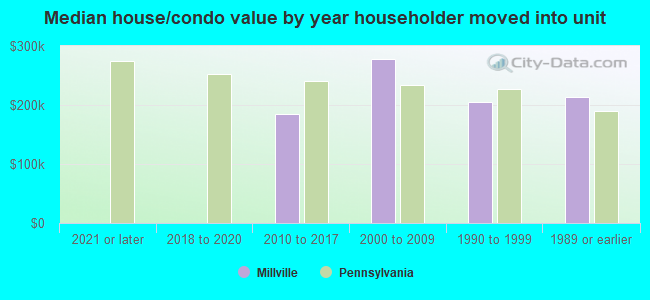
| Millville: | $208,490 |
| Pennsylvania: | $245,500 |
Total population: 957 (Urban population: 0, Rural population: 991 (all nonfarm))
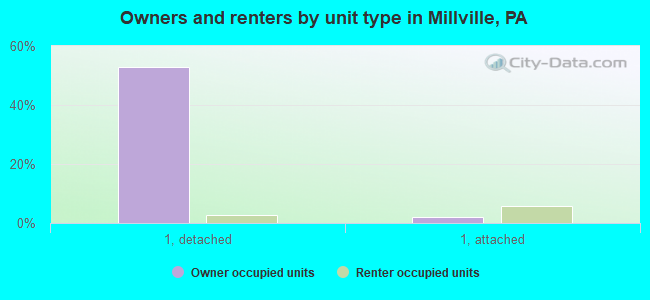
Houses: 418 (375 occupied: 210 owner occupied, 168 renter occupied)
| % of renters here: | 44% |
| State: | 31% |
Housing density: 439 houses/condos per square mile
Median price asked for vacant for-sale houses and condos in 2022 in this county: $112,898.
Median contract rent in 2022: $621 (lower quartile is $517, upper quartile is $704)
Median rent asked for vacant for-rent units in 2022: $627
Median gross rent in Millville, PA in 2022: $706
Housing units in Millville with a mortgage: 135 (2 second mortgage, 0 home equity loan, 2 both second mortgage and home equity loan)
Houses without a mortgage: 6
Median household income for houses/condos with a mortgage: $95,827
Median monthly housing costs: $837
Compare current foreclosures near Millville, PA:
| Photo | Address | Area | Beds / Baths | Price | Details |
|---|---|---|---|---|---|

|
#1
Walnut Ln
Millville, PA 17846
|
3,025 sq. feet
|
1 baths 3 beds |
show details | |

|
#2
Boudman Rd
Millville, PA 17846
|
2,928 sq. feet
|
- baths - beds |
show details | |

|
#3
Avenue F
Danville, PA 17821
|
1,600 sq. feet
|
2 baths 3 beds |
$279,500
|
show details |

|
#4
Old Berwick Rd
Bloomsburg, PA 17815
|
1,264 sq. feet
|
1 baths 2 beds |
$205,000
|
show details |

|
#5
Cherry St
Bloomsburg, PA 17815
|
1,488 sq. feet
|
1 baths 3 beds |
show details | |

|
#6
Martzville Rd
Berwick, PA 18603
|
1,865 sq. feet
|
1 baths 2 beds |
show details | |

|
#7
W Library Ave
Danville, PA 17821
|
1,191 sq. feet
|
1 baths 2 beds |
show details | |

|
#8
5th St
Nescopeck, PA 18635
|
- sq. feet
|
1 baths 3 beds |
show details | |

|
#9
Main St
Orangeville, PA 17859
|
- sq. feet
|
2 baths 4 beds |
show details | |

|
#10
Route 442 Hwy
Muncy, PA 17756
|
2,664 sq. feet
|
1 baths 3 beds |
show details |
| Photo | Address | Area | Beds / Baths | Price | Details |
|---|---|---|---|---|---|

|
#11
Green St
Muncy, PA 17756
|
1,330 sq. feet
|
1 baths 3 beds |
show details | |

|
#12
Hedge Row
Bloomsburg, PA 17815
|
1,974 sq. feet
|
2 baths 3 beds |
show details | |

|
#13
Pine Run Rd
Hughesville, PA 17737
|
1,848 sq. feet
|
2 baths 3 beds |
show details | |

|
#14
Muncy Exchange Rd
Muncy, PA 17756
|
1,372 sq. feet
|
1 baths 3 beds |
show details | |

|
#15
Muncy Exchange Rd
Muncy, PA 17756
|
1,372 sq. feet
|
1 baths 3 beds |
show details | |

|
#16
Peach Ln
Berwick, PA 18603
|
- sq. feet
|
5 baths 3 beds |
show details | |

|
#17
Martzville Rd
Berwick, PA 18603
|
970 sq. feet
|
- baths - beds |
show details | |

|
#18
Vandermark Rd
Shickshinny, PA 18655
|
- sq. feet
|
- baths - beds |
show details | |

|
#19
Hilltop Rd
Berwick, PA 18603
|
1,473 sq. feet
|
- baths - beds |
show details | |

|
#20
Sunbury Rd
Danville, PA 17821
|
- sq. feet
|
- baths - beds |
show details |
| Photo | Address | Area | Beds / Baths | Price | Details |
|---|---|---|---|---|---|

|
#21
Maple Rd
Berwick, PA 18603
|
1,472 sq. feet
|
- baths - beds |
show details | |

|
#22
White Hall Rd
Bloomsburg, PA 17815
|
1,512 sq. feet
|
- baths - beds |
show details | |

|
#23
Summerhill Rd
Berwick, PA 18603
|
1,840 sq. feet
|
- baths - beds |
show details | |

|
#24
Kellys Dam Rd # 312
Danville, PA 17821
|
- sq. feet
|
- baths - beds |
show details | |

|
#25
Keller Rd
Benton, PA 17814
|
- sq. feet
|
- baths - beds |
show details | |

|
#26
Race St
Nescopeck, PA 18635
|
1,694 sq. feet
|
- baths - beds |
show details | |

|
#27
S 2nd St
Hughesville, PA 17737
|
- sq. feet
|
- baths - beds |
show details | |

|
#28
Upper Raven Creek Rd # C
Benton, PA 17814
|
1,680 sq. feet
|
- baths - beds |
show details | |

|
#29
Mill St
Catawissa, PA 17820
|
1,308 sq. feet
|
- baths - beds |
show details | |

|
#30
Fairview Ave
Berwick, PA 18603
|
1,605 sq. feet
|
- baths - beds |
show details |
| Photo | Address | Area | Beds / Baths | Price | Details |
|---|---|---|---|---|---|

|
#31
Dahl Rd
Bloomsburg, PA 17815
|
538 sq. feet
|
- baths - beds |
show details | |

|
#32
Brittain St
Berwick, PA 18603
|
714 sq. feet
|
- baths - beds |
show details | |

|
#33
N Vine St
Berwick, PA 18603
|
- sq. feet
|
- baths - beds |
show details | |

|
#34
Pine St
Berwick, PA 18603
|
- sq. feet
|
- baths - beds |
show details | |

|
#35
Walnut St
Berwick, PA 18603
|
2,472 sq. feet
|
- baths - beds |
show details | |

|
#36
W Front St
Berwick, PA 18603
|
- sq. feet
|
- baths - beds |
show details | |

|
#37
Martin Dr
Catawissa, PA 17820
|
1,776 sq. feet
|
- baths - beds |
show details | |

|
#38
Grant St
Berwick, PA 18603
|
1,380 sq. feet
|
- baths - beds |
show details | |

|
#39
N Vine St
Berwick, PA 18603
|
1,929 sq. feet
|
- baths - beds |
show details | |

|
#40
N Vine St # A
Berwick, PA 18603
|
- sq. feet
|
- baths - beds |
show details |
| Photo | Address | Area | Beds / Baths | Price | Details |
|---|---|---|---|---|---|

|
#41
E 14th St
Berwick, PA 18603
|
1,787 sq. feet
|
- baths - beds |
show details | |

|
#42
Broad St
Nescopeck, PA 18635
|
- sq. feet
|
- baths - beds |
show details | |

|
#43
Smith Hollow Rd
Nescopeck, PA 18635
|
1,120 sq. feet
|
- baths - beds |
show details | |

|
#44
Orange St Apt E
Berwick, PA 18603
|
- sq. feet
|
- baths - beds |
show details | |

|
#45
Spring Garden Ave
Berwick, PA 18603
|
1,326 sq. feet
|
- baths - beds |
show details | |

|
#46
Spring Garden Ave
Berwick, PA 18603
|
1,056 sq. feet
|
- baths - beds |
show details | |

|
#47
3rd Ave
Berwick, PA 18603
|
1,719 sq. feet
|
- baths - beds |
show details | |

|
#48
5th Ave
Berwick, PA 18603
|
1,873 sq. feet
|
- baths - beds |
show details | |

|
#49
1st Ave
Berwick, PA 18603
|
- sq. feet
|
- baths - beds |
show details | |

|
Check over 1 million property listings on Foreclosure.com!
|
browse all offers | |||

Latest news about housing in Millville, PA collected exclusively by city-data.com from local newspapers, TV, and radio stations

 | Philadelphia 2035 (9298 replies) |
| Retirement Move from Newton, MA to PA (Philly Suburbs) (73 replies) |
| Moving to Pitt - Couple Questions (179 replies) |
| Not so shy about their leanings these days (17 replies) |
| Favorite breakfast spot (17 replies) |
| Philly suburbs with sizable numbers of blacks & Puerto ricans (48 replies) |

Median year apartment built: 1966
Household type by relationship:
Households: 998- Male householders: 172 (48 living alone), Female householders: 198 (73 living alone)
162 spouses (162 opposite-sex spouses), 61 unmarried partners, (61 opposite-sex unmarried partners), 259 children (229 natural, 7 adopted, 21 stepchildren), 8 grandchildren, 0 brothers or sisters, 3 parents, 0 foster children, 0 other relatives, 18 non-relatives
- In group quarters: 110
Size of family households: 64 2-persons, 65 3-persons, 49 4-persons, 20 5-persons.
Size of nonfamily households: 126 1-person, 53 2-persons.
83 married couples with children.
47 single-parent households (0 men, 47 women).
92.7% of residents of Millville speak English at home.
1.3% of residents speak Spanish at home (100% speak English very well).
4.2% of residents speak other Indo-European language at home (37% speak English very well, 63% speak English well).
1.0% of residents speak Asian or Pacific Island language at home (50% speak English very well, 50% speak English well).
0.2% of residents speak other language at home (100% speak English very well).
Foreign born population: 83 (8.3%)
(42.2% of them are naturalized citizens)
| Here: | 7.1 |
| State: | 6.8 |
| Here: | 3.8 |
| State: | 4.3 |
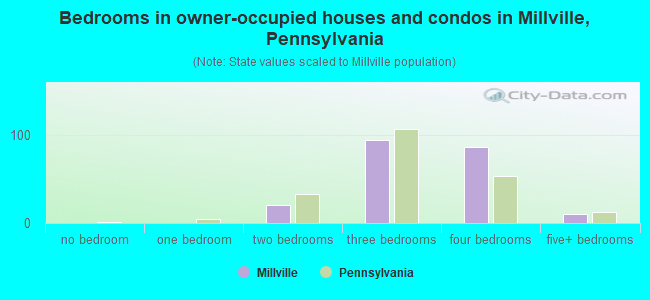
- Bedrooms in owner-occupied houses and condos in Millville, Pennsylvania
- 0no bedroom
- 01 bedroom
- 212 bedrooms
- 943 bedrooms
- 864 bedrooms
- 105+ bedrooms
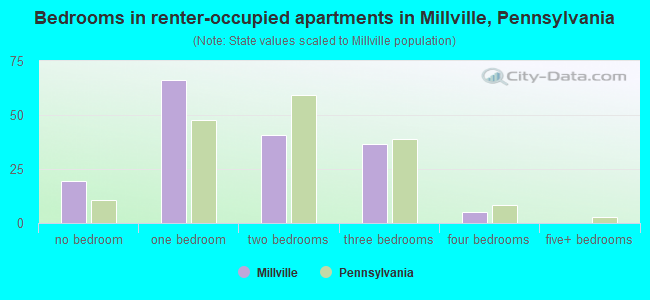
- Bedrooms in renter-occupied apartments in Millville, Pennsylvania
- 19no bedroom
- 661 bedroom
- 412 bedrooms
- 373 bedrooms
- 54 bedrooms
- 05+ bedrooms
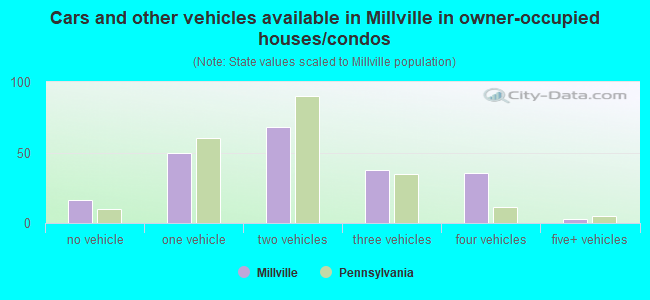
- Cars and other vehicles available in Millville in owner-occupied houses/condos
- 16no vehicle
- 501 vehicle
- 682 vehicles
- 383 vehicles
- 364 vehicles
- 35+ vehicles
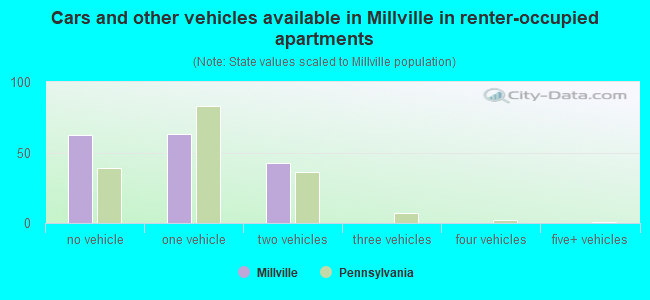
- Cars and other vehicles available in Millville in renter-occupied apartments
- 62no vehicle
- 631 vehicle
- 432 vehicles
- 03 vehicles
- 04 vehicles
- 05+ vehicles
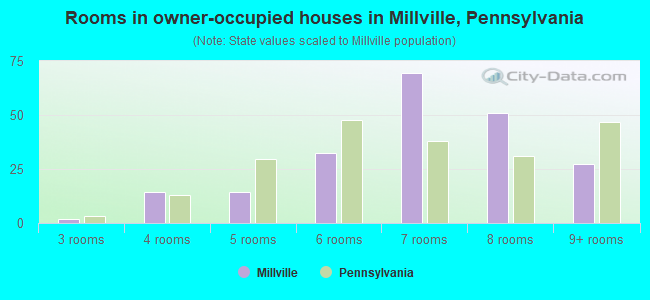
- Rooms in owner-occupied houses in Millville, Pennsylvania
- 01 room
- 02 rooms
- 23 rooms
- 144 rooms
- 145 rooms
- 336 rooms
- 697 rooms
- 518 rooms
- 289+ rooms
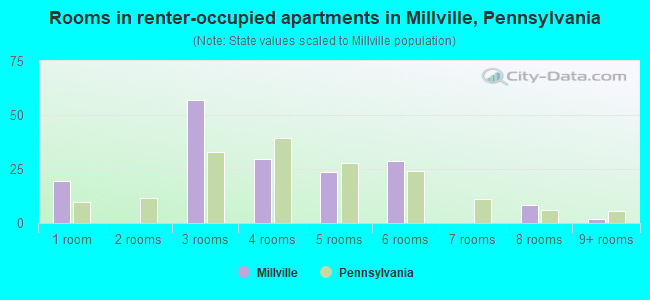
- Rooms in renter-occupied apartments in Millville, Pennsylvania
- 191 room
- 02 rooms
- 573 rooms
- 304 rooms
- 235 rooms
- 296 rooms
- 07 rooms
- 88 rooms
- 29+ rooms
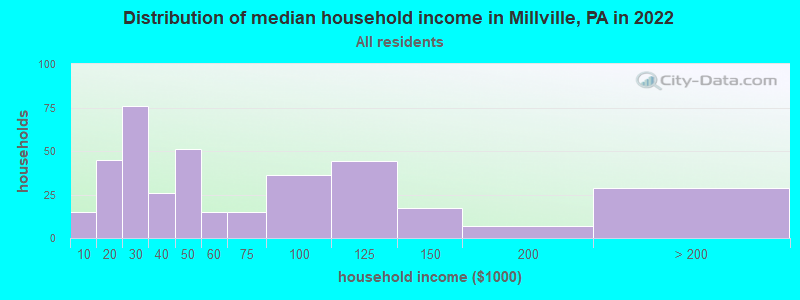
Millville, PA household income distribution

- 15Less than $10,000
- 45$10,000 to $19,999
- 76$20,000 to $29,999
- 26$30,000 to $39,999
- 51$40,000 to $49,999
- 15$50,000 to $59,999
- 15$60,000 to $74,999
- 36$75,000 to $99,999
- 44$100,000 to $124,999
- 17$125,000 to $149,999
- 7$150,000 to $199,999
- 29$200,000 or more
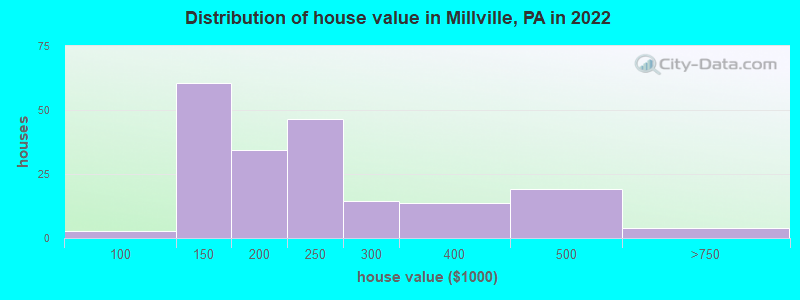
Home value of owner - occupied houses in 2022 in Millville, PA
-
- 2$80,000 to $89,999
- 35$100,000 to $124,999
- 25$125,000 to $149,999
- 10$150,000 to $174,999
- 24$175,000 to $199,999
- 46$200,000 to $249,999
- 14$250,000 to $299,999
- 13$300,000 to $399,999
- 19$400,000 to $499,999
- 3$500,000 to $749,999
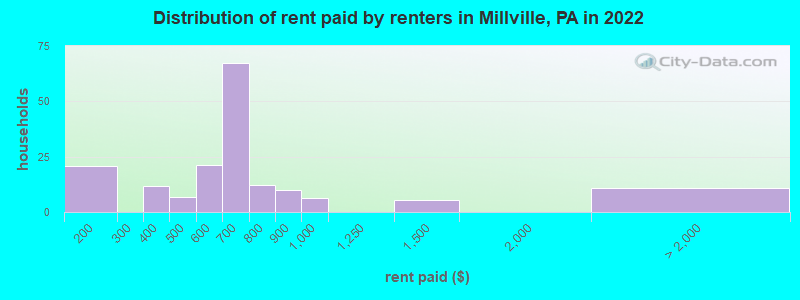
Rent paid by renters in 2022 in Millville, PA
-
- 20$150 to $199
- 11$300 to $349
- 6$450 to $499
- 6$500 to $549
- 15$550 to $599
- 54$600 to $649
- 12$650 to $699
- 7$700 to $749
- 4$750 to $799
- 9$800 to $899
- 6$900 to $999
- 5$1,250 to $1,499
- 10No cash rent
Percentage of workers working in this county: 61.1%
Number of people working at home: 49 (10.1% of all workers)
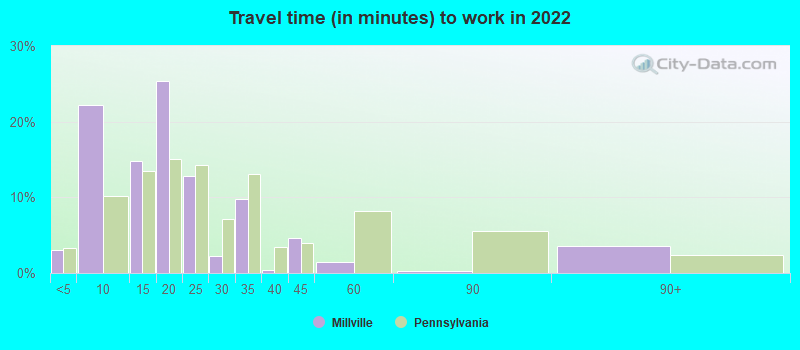
Travel time to work (commute)
- Less than 5 minutes: 7
- 5 to 9 minutes: 108
- 10 to 14 minutes: 34
- 15 to 19 minutes: 26
- 20 to 24 minutes: 136
- 25 to 29 minutes: 30
- 30 to 34 minutes: 48
- 35 to 39 minutes: 6
- 40 to 44 minutes: 18
- 45 to 59 minutes: 11
- 60 to 89 minutes: 0
- 90 or more minutes: 2
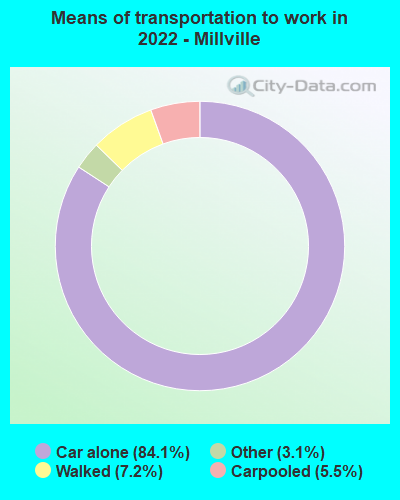
Means of transportation to work:
- Drove a car alone: 549 (76.9%)
- Carpooled: 36 (5.0%)
- Taxi: 24 (3.4%)
- Walked: 47 (6.6%)
- Worked at home: 49 (6.9%)
- Unemployment by race in 2022
- Unemployment rate for White non-Hispanic residents
- 3.3%Males
- 2.9%Females
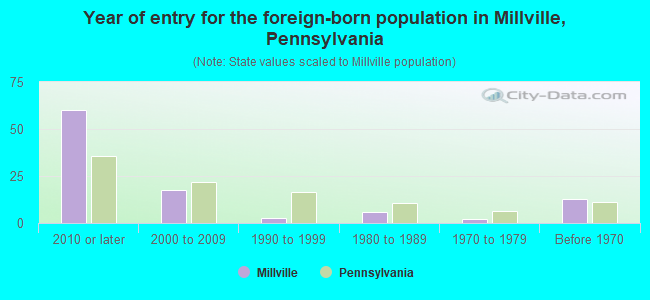
- Year of entry for the foreign-born population in Millville, Pennsylvania
- 602010 or later
- 182000 to 2009
- 31990 to 1999
- 61980 to 1989
- 21970 to 1979
- 13Before 1970
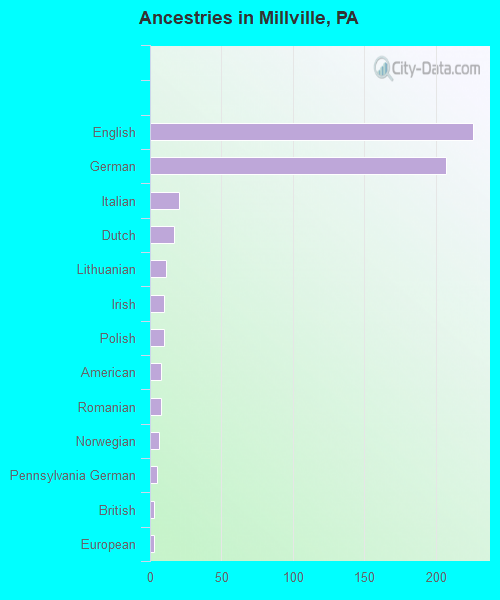
First ancestries reported:
- English: 226 (37.0%)
- German: 207 (33.9%)
- Italian: 20 (3.3%)
- Dutch: 17 (2.8%)
- Lithuanian: 11 (1.8%)
- Irish: 10 (1.6%)
- Polish: 10 (1.6%)
- American: 8 (1.3%)
- Romanian: 8 (1.3%)
- Norwegian: 6 (1.0%)
- Pennsylvania German: 5 (0.8%)
- British: 3 (0.5%)
- European: 3 (0.5%)
- Scottish: 2 (0.3%)
- Eastern European: 1 (0.2%)
- Slovak: 1 (0.2%)
Most common places of birth for foreign-born residents (%):
| Millville: | 53.0% (44) |
| Pennsylvania: | 10.7% (100,596) |
| Millville: | 12.0% (10) |
| Pennsylvania: | 0.6% (5,598) |
| Millville: | 8.4% (7) |
| Pennsylvania: | 0.1% (1,033) |
| Millville: | 6.0% (5) |
| Pennsylvania: | 3.3% (31,542) |
| Millville: | 6.0% (5) |
| Pennsylvania: | 2.2% (21,039) |
| Millville: | 3.6% (3) |
| Pennsylvania: | 1.9% (18,065) |
Place of birth for U.S.-born residents:
- This state: 762
- Other state: 137
- Northeast: 39
- Midwest: 49
- South: 38
- West: 9
90.4% of Millville residents lived in the same house 1 years ago.
Out of people who lived in different houses, 42.1% lived in this county.
Out of people who lived in different counties, 100.0% lived in Pennsylvania.
| Millville: | 90.4% |
| State average: | 89.3% |
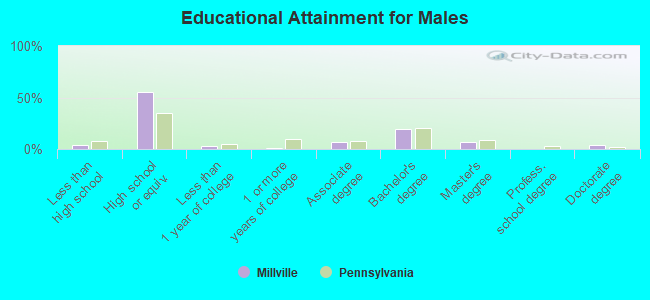
Education attainment for males 25 years and older:
- No schooling: 3
- Nursery to 4th grade: 0
- 5th and 6th grade: 0
- 7th and 8th grade: 3
- 9th grade: 0
- 10th grade: 8
- 11th grade: 0
- 12th grade, no diploma: 0
- High school graduate (or equivalency): 187
- Less than 1 year of college: 9
- Some college more than 1 year, no degree: 4
- Associate degree: 22
- Bachelor's degree: 65
- Master's degree: 22
- Professional school degree: 0
- Doctorate degree: 14
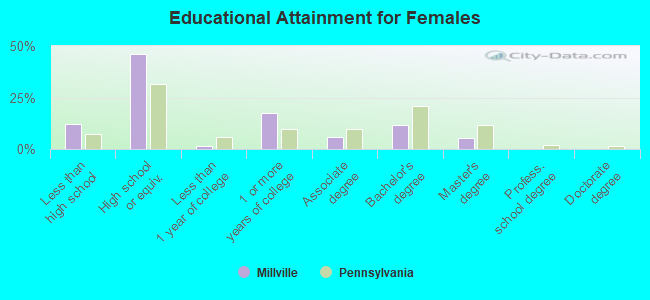
Education attainment for females 25 years and older:
- No schooling: 0
- Nursery to 4th grade: 0
- 5th and 6th grade: 0
- 7th and 8th grade: 4
- 9th grade: 5
- 10th grade: 30
- 11th grade: 0
- 12th grade, no diploma: 6
- High school graduate (or equivalency): 172
- Less than 1 year of college: 5
- Some college more than 1 year, no degree: 65
- Associate degree: 21
- Bachelor's degree: 44
- Master's degree: 20
- Professional school degree: 0
- Doctorate degree: 0


Housing units in structures:
- One, detached: 234
- One, attached: 39
- Two: 34
- 3 or 4: 36
- 5 to 9: 59
- 10 to 19: 14
Housing units lacking complete kitchen facilities in 2022: 2.2%
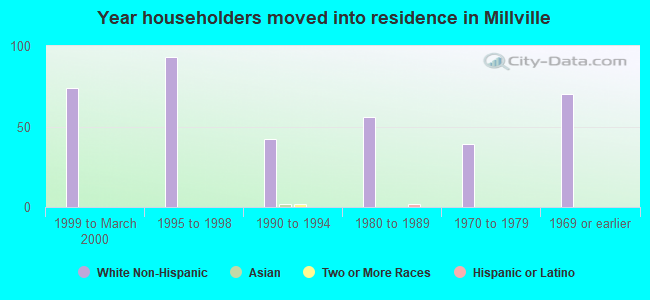
House/condo owner moved in on average 22 years ago
Renter moved in on average 1 years ago
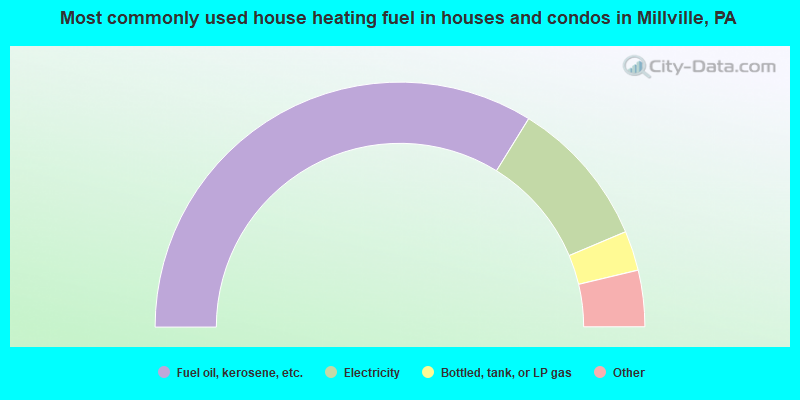
- 68.1%Fuel oil, kerosene, etc.
- 19.8%Electricity
- 5.3%Bottled, tank, or LP gas
- 3.4%Wood
- 2.4%Coal or coke
- 1.0%Other fuel
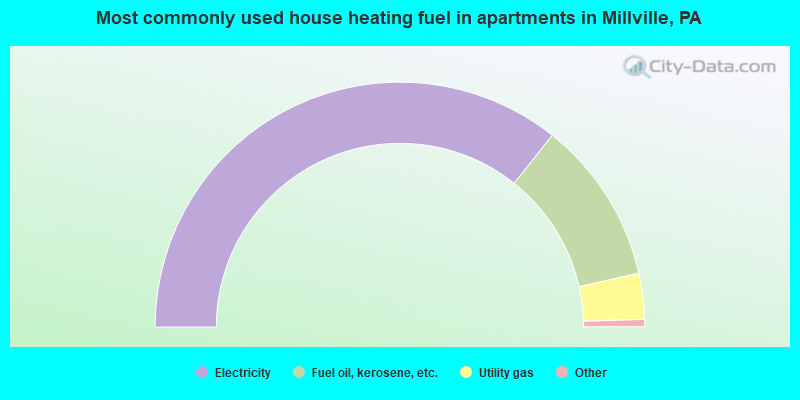
- 72.1%Electricity
- 21.8%Fuel oil, kerosene, etc.
- 6.1%Utility gas
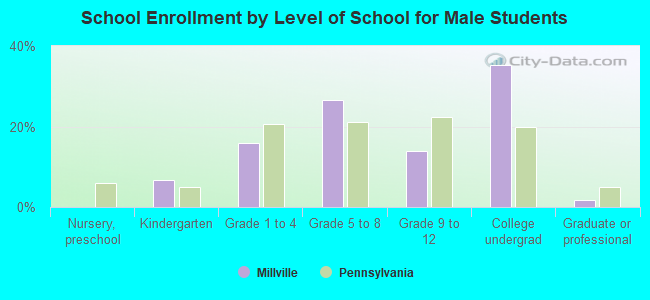
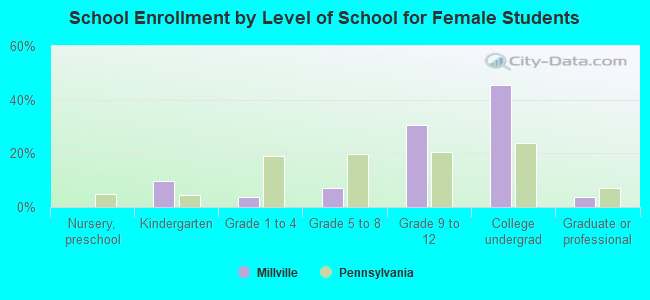
Private vs. public school enrollment:
| Here: | 0.0% |
| Pennsylvania: | 15.7% |
| Here: | 0.0% |
| Pennsylvania: | 13.4% |
| Here: | 12.7% |
| Pennsylvania: | 39.8% |