Millwood, SC (South Carolina) Houses and Residents
| Millwood: | $187,988 |
| South Carolina: | $254,600 |
Total population: 881 (All urban)
Houses: 311 (311 occupied: 269 owner occupied, 42 renter occupied)
| % of renters here: | 14% |
| State: | 28% |
Housing density: 391 houses/condos per square mile
Median price asked for vacant for-sale houses and condos in 2022 in this county: $138,322.
Median contract rent in 2022: $1,391 (lower quartile is $1,169, upper quartile is $1,431)
Median gross rent in Millwood, SC in 2022: $1,557
Housing units in Millwood with a mortgage: 186 (37 second mortgage, 16 home equity loan, 9 both second mortgage and home equity loan)
Houses without a mortgage: 54


Latest news about housing in Millwood, SC collected exclusively by city-data.com from local newspapers, TV, and radio stations

 | Columbia - general (5183 replies) |
| Columbia Common (2253 replies) |
| Off campus apartments (4 replies) |
| Vsion condos- good or bad idea? (20 replies) |
| Which areas of Columbia to avoid? (35 replies) |
| The Vista and 5 Points (3452 replies) |

Household type by relationship:
Households: 104,682- In family households: 90,414 (16,844 male householders, 11,467 female householders)
18,030 spouses, 32,519 children (29,860 natural, 850 adopted, 1,809 stepchildren), 4,372 grandchildren, 1,400 brothers or sisters, 984 parents, foster children, 1,881 other relatives, 2,446 non-relatives
- In nonfamily households: 14,268 (5,735 male householders (4,775 living alone)), 6,352 female householders (5,667 living alone)), 2,181 nonrelatives
- In group quarters: 2,774 (1,325 institutionalized population)
16,509 married couples with children.
8,512 single-parent households (1,371 men, 7,141 women).
96.3% of residents of Millwood speak English at home.
2.4% of residents speak Spanish at home (71% speak English very well, 29% speak English well).
1.3% of residents speak other Indo-European language at home (100% speak English very well).
Foreign born population: 9 (1.0%)
(0.0% of them are naturalized citizens)
| Here: | 6.6 |
| State: | 6.4 |
| Here: | 7.8 |
| State: | 4.5 |

- Bedrooms in owner-occupied houses and condos in Millwood, South Carolina
- 0no bedroom
- 01 bedroom
- 192 bedrooms
- 1963 bedrooms
- 444 bedrooms
- 105+ bedrooms

- Bedrooms in renter-occupied apartments in Millwood, South Carolina
- 0no bedroom
- 01 bedroom
- 92 bedrooms
- 263 bedrooms
- 74 bedrooms
- 05+ bedrooms

- Cars and other vehicles available in Millwood in owner-occupied houses/condos
- 11no vehicle
- 341 vehicle
- 1392 vehicles
- 573 vehicles
- 94 vehicles
- 195+ vehicles

- Cars and other vehicles available in Millwood in renter-occupied apartments
- 0no vehicle
- 71 vehicle
- 282 vehicles
- 73 vehicles
- 04 vehicles
- 05+ vehicles

- Rooms in owner-occupied houses in Millwood, South Carolina
- 01 room
- 02 rooms
- 03 rooms
- 204 rooms
- 455 rooms
- 1046 rooms
- 347 rooms
- 468 rooms
- 209+ rooms

- Rooms in renter-occupied apartments in Millwood, South Carolina
- 01 room
- 02 rooms
- 03 rooms
- 44 rooms
- 05 rooms
- 266 rooms
- 127 rooms
- 08 rooms
- 09+ rooms


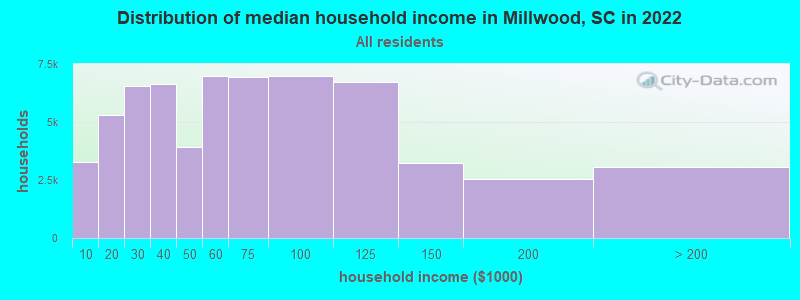
Millwood, SC household income distribution

- 3,259Less than $10,000
- 5,310$10,000 to $19,999
- 6,545$20,000 to $29,999
- 6,657$30,000 to $39,999
- 3,933$40,000 to $49,999
- 6,980$50,000 to $59,999
- 6,941$60,000 to $74,999
- 7,000$75,000 to $99,999
- 6,745$100,000 to $124,999
- 3,253$125,000 to $149,999
- 2,533$150,000 to $199,999
- 3,043$200,000 or more
Percentage of workers working in this county: 85.1%
Number of people working at home: 100 (13.1% of all workers)
Travel time to work (commute)
- Less than 5 minutes: 16
- 5 to 9 minutes: 91
- 10 to 14 minutes: 156
- 15 to 19 minutes: 98
- 20 to 24 minutes: 58
- 25 to 29 minutes: 6
- 30 to 34 minutes: 9
- 35 to 39 minutes: 0
- 40 to 44 minutes: 13
- 45 to 59 minutes: 27
- 60 to 89 minutes: 0
- 90 or more minutes: 15
Means of transportation to work:
- Drove a car alone: 454 (91.3%)
- Carpooled: 35 (7.0%)
- Worked at home: 8 (1.6%)


- Year of entry for the foreign-born population in Millwood, South Carolina
- 01995 to March 2000
- 91990 to 1994
- 01985 to 1989
- 01980 to 1984
- 01975 to 1979
- 01970 to 1974
- 01965 to 1969
- 0Before 1965

First ancestries reported:
- United States: 294 (31.1%)
- Other: 188 (19.9%)
- English: 112 (11.8%)
- German: 104 (11.0%)
- Italian: 80 (8.5%)
- Subsaharan African: 70 (7.4%)
- Irish: 27 (2.9%)
- Polish: 21 (2.2%)
- Scottish: 16 (1.7%)
- Scotch-Irish: 12 (1.3%)
- Swedish: 8 (0.8%)
- Danish: 7 (0.7%)
- Norwegian: 7 (0.7%)
Most common places of birth for foreign-born residents (%):
| Millwood: | 100.0% (9) |
| South Carolina: | 1.4% (1,599) |
Place of birth for U.S.-born residents:
- This state: 592
- Other state: 286
- Northeast: 105
- Midwest: 35
- South: 124
- West: 22
79% of Millwood residents lived in the same house 5 years ago.
Out of people who lived in different houses, 58% lived in this county.
Out of people who lived in different counties, 13% lived in South Carolina.
Education attainment for males 25 years and older:
- No schooling: 3
- Nursery to 4th grade: 0
- 5th and 6th grade: 0
- 7th and 8th grade: 28
- 9th grade: 0
- 10th grade: 20
- 11th grade: 0
- 12th grade, no diploma: 33
- High school graduate (or equivalency): 93
- Less than 1 year of college: 16
- Some college more than 1 year, no degree: 43
- Associate degree: 16
- Bachelor's degree: 61
- Master's degree: 35
- Professional school degree: 0
- Doctorate degree: 10

Education attainment for females 25 years and older:
- No schooling: 2
- Nursery to 4th grade: 0
- 5th and 6th grade: 9
- 7th and 8th grade: 0
- 9th grade: 0
- 10th grade: 14
- 11th grade: 0
- 12th grade, no diploma: 0
- High school graduate (or equivalency): 142
- Less than 1 year of college: 35
- Some college more than 1 year, no degree: 40
- Associate degree: 0
- Bachelor's degree: 44
- Master's degree: 20
- Professional school degree: 0
- Doctorate degree: 0


Housing units in structures:
- One, detached: 280
- One, attached: 10
- Mobile homes: 21
Median worth of mobile homes: $29,264

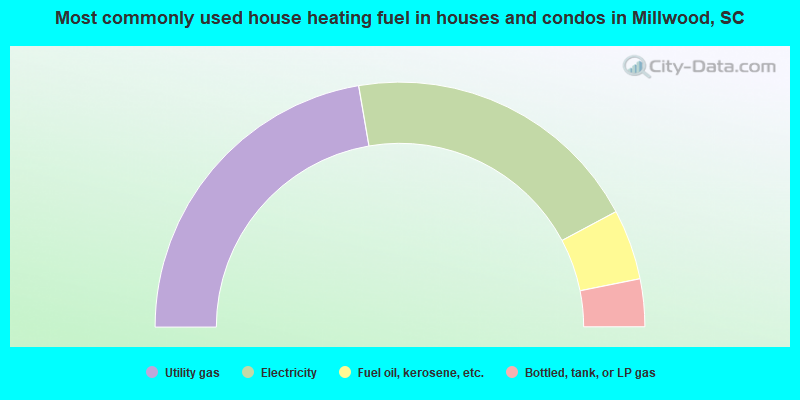
- 44.6%Utility gas
- 39.8%Electricity
- 9.3%Fuel oil, kerosene, etc.
- 6.3%Bottled, tank, or LP gas
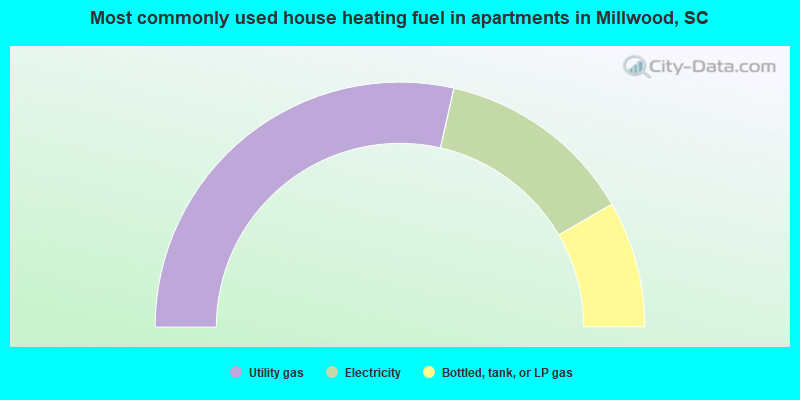
- 57.1%Utility gas
- 26.2%Electricity
- 16.7%Bottled, tank, or LP gas
Private vs. public school enrollment:
| Here: | 15.6% |
| South Carolina: | 9.2% |
| Here: | 16.3% |
| South Carolina: | 8.1% |
| Here: | 0.0% |
| South Carolina: | 20.3% |


