Milton, MA (Massachusetts) Houses and Residents
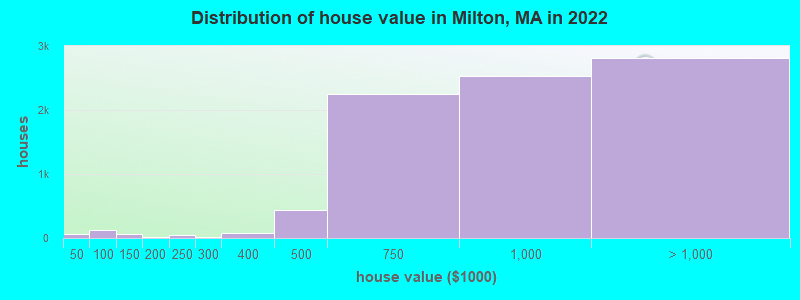
Estimated median house or condo value in 2022: $891,363 (it was $282,100 in 2000 )
Milton:
$891,363Massachusetts:
$534,700
Lower value quartile - upper value quartile: $656,524 - $1,181,247Mean price in 2022: Detached houses: $1,133,764 Here:
$1,133,764State:
$651,570
Townhouses or other attached units: $711,792 Here:
$711,792State:
$617,749
In 2-unit structures: $588,039 Here:
$588,039State:
$594,808
In 3-to-4-unit structures: $1,412,635 Here:
$1,412,635State:
$601,912
In 5-or-more-unit structures: $566,981 Here:
$566,981State:
$555,768
Total population: 27,003 (Urban population: 25,765, Rural population: 297 (all nonfarm) )
Houses: 9,605 (9,277 occupied: 7,778 owner occupied, 1,450 renter occupied )
% of renters here:
16%State:
38%
Housing density: 737 houses/condos per square mile
Median price asked for vacant for-sale houses and condos in 2022: $3,227,728.
Median contract rent in 2022: $1,318 (lower quartile is $768, upper quartile is $1,935)
Median rent asked for vacant for-rent units in 2022: $4,138
Median gross rent in Milton, MA in 2022: $1,472
Housing units in Milton with a mortgage: 5,695 (1,242 second mortgage, 107 home equity loan, 1,021 both second mortgage and home equity loan )Houses without a mortgage: 93
Median household income for houses/condos with a mortgage: $231,654
Median household income for apartments without a mortgage: $88,033
Median monthly housing costs: $2,747
Data:
Median house or condo value ($)
Median house or condo value ($ change since 2000)
Median house or condo value ($) - White
Median house or condo value ($) - Black or African American
Median house or condo value ($) - Asian
Median house or condo value ($) - Hispanic or Latino
Median house or condo value ($) - American Indian and Alaska Native
Median house or condo value ($) - Multirace
Median house or condo value ($) - Other Race
Median price asked for mobile homes ($)
Household density (households per square mile)
Mean house or condo value by units in structure - 1, detached ($)
Mean house or condo value by units in structure - 1, attached ($)
Mean house or condo value by units in structure - 2 ($)
Mean house or condo value by units in structure by units in structure - 3 or 4 ($)
Mean house or condo value by units in structure - 5 or more ($)
Mean house or condo value by units in structure - Boat, RV, van, etc. ($)
Mean house or condo value by units in structure - Mobile home ($)
Median contract rent ($)
Median contract rent - Lower quartile ($)
Median contract rent - Upper quartile ($)
Median gross rent ($)
Urban houses (%)
Rural houses (%)
Houses occupied (%)
Houses occupied (% change since 2000)
Houses owner occupied (%)
Houses owner occupied (% change since 2000)
Houses renter occupied (%)
Houses renter occupied (% change since 2000)
Vacant housing units - For rent (%)
Vacant housing units - For rent (% change since 2000)
Vacant housing units - For sale only (%)
Vacant housing units - For sale only (% change since 2000)
Vacant housing units - Rented or sold, not occupied (%)
Vacant housing units - Rented or sold, not occupied (% change since 2000)
Vacant housing units - For seasonal, recreational, or occasional use (%)
Vacant housing units - For seasonal, recreational, or occasional use (% change since 2000)
Vacant housing units - For migrant workers (%)
Vacant housing units - For migrant workers (% change since 2000)
Vacant housing units - Other vacant (%)
Vacant housing units - Other vacant (% change since 2000)
Median monthly housing costs ($)
Median household income for houses/condos with a mortgage ($)
Median household income for houses/condos without a mortgage ($)
Median household income ($)
Median household income ($) - White
Median household income ($) - Black or African American
Median household income ($) - Asian
Median household income ($) - Hispanic or Latino
Median household income ($) - American Indian and Alaska Native
Median household income ($) - Multirace
Median household income ($) - Other Race
Mortgage status - with mortgage (%)
Mortgage status - with second mortgage (%)
Mortgage status - with home equity loan (%)
Mortgage status - with both second mortgage and home equity loan (%)
Mortgage status - without a mortgage (%)
Median year house/condo built
Median year apartment built
Household type by relationship - Male householder living alone (%)
Household type by relationship - Male householder not living alone (%)
Household type by relationship - Female householder living alone (%)
Household type by relationship - Female householder not living alone (%)
Household type by relationship - Opposite-Sex spouse (%)
Household type by relationship - Same-Sex spouse (%)
Household type by relationship - Opposite-Sex unmarried partner (%)
Household type by relationship - Same-Sex unmarried partner (%)
Household type by relationship - In group quarters (%)
Size of family households - 2-person household (%)
Size of family households - 3-person household (%)
Size of family households - 4-person household (%)
Size of family households - 5-person household (%)
Size of family households - 6-person household (%)
Size of family households - 7-or-more-person household (%)
Size of nonfamily households - 1-person household (%)
Size of nonfamily households - 2-person household (%)
Size of nonfamily households - 3-person household (%)
Size of nonfamily households - 4-person household (%)
Size of nonfamily households - 5-person household (%)
Size of nonfamily households - 6-person household (%)
Size of nonfamily households - 7-or-moreperson household (%)
Year house built - Built 2010 or later (%)
Year house built - Built 2000 to 2009 (%)
Year house built - Built 1990 to 1999 (%)
Year house built - Built 1980 to 1989 (%)
Year house built - Built 1970 to 1979 (%)
Year house built - Built 1960 to 1969 (%)
Year house built - Built 1950 to 1959 (%)
Year house built - Built 1940 to 1949 (%)
Year house built - Built 1939 or earlier (%)
Median number of rooms in houses and condos
Median number of rooms in apartments
Median number of bedrooms in owner occupied houses
Mean number of bedrooms in owner occupied houses
Median number of bedrooms in renter occupied houses
Mean number of bedrooms in renter occupied houses
Median number of vehichles in owner occupied houses
Mean number of vehichles in owner occupied houses
Median number of vehichles in renter occupied houses
Mean number of vehichles in renter occupied houses
Rooms in owner-occupied houses - 1 room (%)
Rooms in owner-occupied houses - 2 rooms (%)
Rooms in owner-occupied houses - 3 rooms (%)
Rooms in owner-occupied houses - 4 rooms (%)
Rooms in owner-occupied houses - 5 rooms (%)
Rooms in owner-occupied houses - 6 rooms (%)
Rooms in owner-occupied houses - 7 rooms (%)
Rooms in owner-occupied houses - 8 rooms (%)
Rooms in owner-occupied houses - 9+ rooms (%)
Rooms in renter-occupied houses - 1 room (%)
Rooms in renter-occupied houses - 2 rooms (%)
Rooms in renter-occupied houses - 3 rooms (%)
Rooms in renter-occupied houses - 4 rooms (%)
Rooms in renter-occupied houses - 5 rooms (%)
Rooms in renter-occupied houses - 6 rooms (%)
Rooms in renter-occupied houses - 7 rooms (%)
Rooms in renter-occupied houses - 8 rooms (%)
Rooms in renter-occupied houses - 9+ rooms (%)
Bedrooms in owner-occupied houses - no bedrooms (%)
Bedrooms in owner-occupied houses - 1 bedroom (%)
Bedrooms in owner-occupied houses - 2 bedrooms (%)
Bedrooms in owner-occupied houses - 3 bedrooms (%)
Bedrooms in owner-occupied houses - 4 bedrooms (%)
Bedrooms in owner-occupied houses - 5+ bedrooms (%)
Bedrooms in renter-occupied houses - no bedrooms (%)
Bedrooms in renter-occupied houses - 1 bedroom (%)
Bedrooms in renter-occupied houses - 2 bedrooms (%)
Bedrooms in renter-occupied houses - 3 bedrooms (%)
Bedrooms in renter-occupied houses - 4 bedrooms (%)
Bedrooms in renter-occupied houses - 5+ bedrooms (%)
Vehicles available in owner-occupied houses - no vehicle available (%)
Vehicles available in owner-occupied houses - 1 vehicle available(%)
Vehicles available in owner-occupied houses - 2 Vehicles available (%)
Vehicles available in owner-occupied houses - 3 Vehicles available (%)
Vehicles available in owner-occupied houses - 4 Vehicles available (%)
Vehicles available in owner-occupied houses - 5+ Vehicles available (%)
Vehicles available in renter-occupied houses - no vehicle available (%)
Vehicles available in renter-occupied houses - 1 vehicle available (%)
Vehicles available in renter-occupied houses - 2 Vehicles available (%)
Vehicles available in renter-occupied houses - 3 Vehicles available (%)
Vehicles available in renter-occupied houses - 4 Vehicles available (%)
Vehicles available in renter-occupied houses - 5+ Vehicles available (%)
Housing units in structures - 1, detached (%)
Housing units in structures - 1, attached (%)
Housing units in structures - 2 (%)
Housing units in structures - 3 or 4 (%)
Housing units in structures - 5 to 9 (%)
Housing units in structures - 10 to 19 (%)
Housing units in structures - 20 to 49 (%)
Housing units in structures - 50 or more (%)
Housing units in structures - Mobile home (%)
Housing units in structures - Boat, RV, van, etc. (%)
Housing units in structures - Owners - 1, detached (%)
Housing units in structures - Owners - 1, attached (%)
Housing units in structures - Owners - 2 (%)
Housing units in structures - Owners - 3 or 4 (%)
Housing units in structures - Owners - 5 to 9 (%)
Housing units in structures - Owners - 10 to 19 (%)
Housing units in structures - Owners - 20 to 49 (%)
Housing units in structures - Owners - 50 or more (%)
Housing units in structures - Owners - Mobile home (%)
Housing units in structures - Owners - Boat, RV, van, etc. (%)
Housing units in structures - Renters - 1, detached (%)
Housing units in structures - Renters - 1, attached (%)
Housing units in structures - Renters - 2 (%)
Housing units in structures - Renters - 3 or 4 (%)
Housing units in structures - Renters - 5 to 9 (%)
Housing units in structures - Renters - 10 to 19 (%)
Housing units in structures - Renters - 20 to 49 (%)
Housing units in structures - Renters - 50 or more (%)
Housing units in structures - Renters - Mobile home (%)
Housing units in structures - Renters - Boat, RV, van, etc. (%)
House/condo owner moved in on average (years ago)
Renter moved in on average (years ago)
Year householder moved into unit - Moved in 1999 to March 2000 (%)
Year householder moved into unit - Moved in 1999 to March 2000 (%) - White
Year householder moved into unit - Moved in 1999 to March 2000 (%) - Black or African American
Year householder moved into unit - Moved in 1999 to March 2000 (%) - Asian
Year householder moved into unit - Moved in 1999 to March 2000 (%) - Hispanic or Latino
Year householder moved into unit - Moved in 1999 to March 2000 (%) - American Indian and Alaska Native
Year householder moved into unit - Moved in 1999 to March 2000 (%) - Multirace
Year householder moved into unit - Moved in 1999 to March 2000 (%) - Other Race
Year householder moved into unit - Moved in 1995 to 1998 (%)
Year householder moved into unit - Moved in 1995 to 1998 (%) - White
Year householder moved into unit - Moved in 1995 to 1998 (%) - Black or African American
Year householder moved into unit - Moved in 1995 to 1998 (%) - Asian
Year householder moved into unit - Moved in 1995 to 1998 (%) - Hispanic or Latino
Year householder moved into unit - Moved in 1995 to 1998 (%) - American Indian and Alaska Native
Year householder moved into unit - Moved in 1995 to 1998 (%) - Multirace
Year householder moved into unit - Moved in 1995 to 1998 (%) - Other Race
Year householder moved into unit - Moved in 1990 to 1994 (%)
Year householder moved into unit - Moved in 1990 to 1994 (%) - White
Year householder moved into unit - Moved in 1990 to 1994 (%) - Black or African American
Year householder moved into unit - Moved in 1990 to 1994 (%) - Asian
Year householder moved into unit - Moved in 1990 to 1994 (%) - Hispanic or Latino
Year householder moved into unit - Moved in 1990 to 1994 (%) - American Indian and Alaska Native
Year householder moved into unit - Moved in 1990 to 1994 (%) - Multirace
Year householder moved into unit - Moved in 1990 to 1994 (%) - Other Race
Year householder moved into unit - Moved in 1980 to 1989 (%)
Year householder moved into unit - Moved in 1980 to 1989 (%) - White
Year householder moved into unit - Moved in 1980 to 1989 (%) - Black or African American
Year householder moved into unit - Moved in 1980 to 1989 (%) - Asian
Year householder moved into unit - Moved in 1980 to 1989 (%) - Hispanic or Latino
Year householder moved into unit - Moved in 1980 to 1989 (%) - American Indian and Alaska Native
Year householder moved into unit - Moved in 1980 to 1989 (%) - Multirace
Year householder moved into unit - Moved in 1980 to 1989 (%) - Other Race
Year householder moved into unit - Moved in 1970 to 1979 (%)
Year householder moved into unit - Moved in 1970 to 1979 (%) - White
Year householder moved into unit - Moved in 1970 to 1979 (%) - Black or African American
Year householder moved into unit - Moved in 1970 to 1979 (%) - Asian
Year householder moved into unit - Moved in 1970 to 1979 (%) - Hispanic or Latino
Year householder moved into unit - Moved in 1970 to 1979 (%) - American Indian and Alaska Native
Year householder moved into unit - Moved in 1970 to 1979 (%) - Multirace
Year householder moved into unit - Moved in 1970 to 1979 (%) - Other Race
Year householder moved into unit - Moved in 1969 or earlier (%)
Year householder moved into unit - Moved in 1969 or earlier (%) - White
Year householder moved into unit - Moved in 1969 or earlier (%) - Black or African American
Year householder moved into unit - Moved in 1969 or earlier (%) - Asian
Year householder moved into unit - Moved in 1969 or earlier (%) - Hispanic or Latino
Year householder moved into unit - Moved in 1969 or earlier (%) - American Indian and Alaska Native
Year householder moved into unit - Moved in 1969 or earlier (%) - Multirace
Year householder moved into unit - Moved in 1969 or earlier (%) - Other Race
Housing units lacking complete plumbing facilities (%)
Housing units lacking complete kitchen facilities (%)
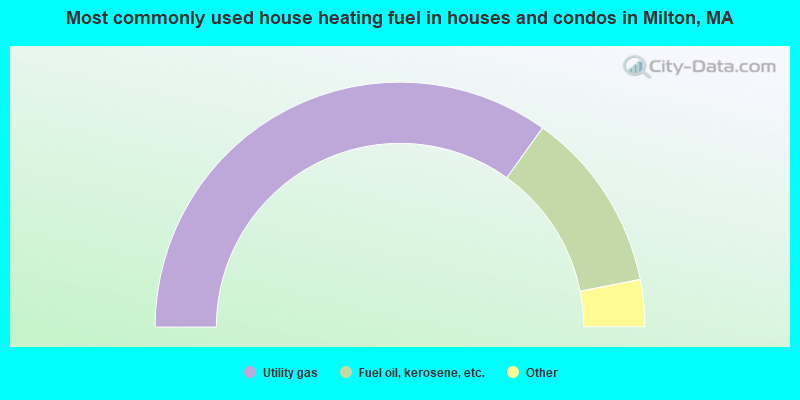
House heating fuel used in houses and condos - Utility gas (%)
House heating fuel used in houses and condos - Bottled, tank, or LP gas (%)
House heating fuel used in houses and condos - Electricity (%)
House heating fuel used in houses and condos - Fuel oil, kerosene, etc. (%)
House heating fuel used in houses and condos - Coal or coke (%)
House heating fuel used in houses and condos - Wood (%)
House heating fuel used in houses and condos - Solar energy (%)
House heating fuel used in houses and condos - Other fuel (%)
House heating fuel used in houses and condos - No fuel used (%)
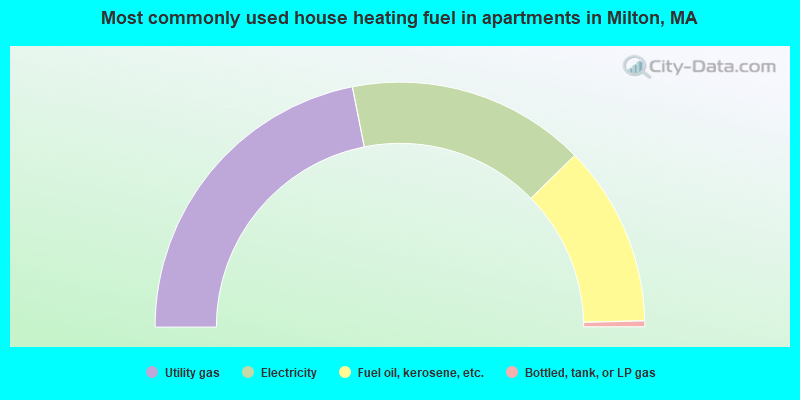
House heating fuel used in apartments - Utility gas (%)
House heating fuel used in apartments - Bottled, tank, or LP gas (%)
House heating fuel used in apartments - Electricity (%)
House heating fuel used in apartments - Fuel oil, kerosene, etc. (%)
House heating fuel used in apartments - Coal or coke (%)
House heating fuel used in apartments - Wood (%)
House heating fuel used in apartments - Solar energy (%)
House heating fuel used in apartments - Other fuel (%)
House heating fuel used in apartments - No fuel used (%)
Latest news about housing in Milton, MA collected exclusively by city-data.com from local newspapers, TV, and radio stations
Median year house/condo built: 1941Median year apartment built: 1981Household type by relationship:
Households: 28,584
Male householders: 4,529 (578 living alone ), Female householders: 4,652 (1,099 living alone )5,942 spouses (5,889 opposite-sex spouses ), 492 unmarried partners , (481 opposite-sex unmarried partners ), 9,218 children (8,544 natural , 334 adopted , 339 stepchildren ), 360 grandchildren , 116 brothers or sisters , 427 parents , 0 foster children , 343 other relatives , 875 non-relatives In group quarters: 1,626
Size of family households: 2,010 2-persons , 1,759 3-persons , 2,110 4-persons , 847 5-persons , 189 6-persons , 72 7-or-more-persons .
Size of nonfamily households: 1,751 1-person , 423 2-persons , 5 3-persons , 6 4-persons .
5,650 married couples with children. single-parent households (180 men , 820 women ).
79.9% of residents of Milton speak English at home. of residents speak Spanish at home (83% speak English very well , 17% speak English well ).of residents speak other Indo-European language at home (77% speak English very well , 17% speak English well , 5% speak English not well , 1% don't speak English at all ).of residents speak Asian or Pacific Island language at home (71% speak English very well , 19% speak English well , 7% speak English not well , 3% don't speak English at all ).of residents speak other language at home (91% speak English very well , 6% speak English well , 3% don't speak English at all ).
Foreign born population: 4,594 (16.1%)of them are naturalized citizens )
Median number of rooms in houses and condos:
Median number of rooms in apartments
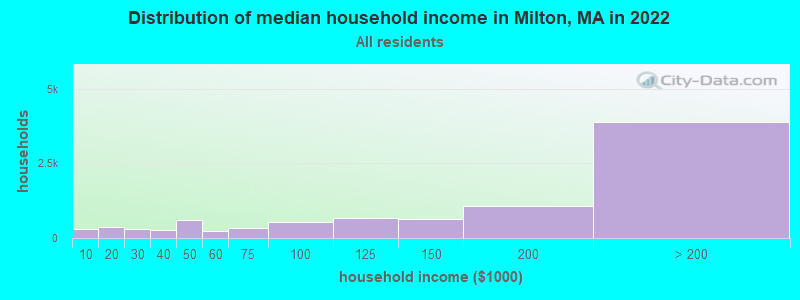
Milton, MA household income distribution 294 Less than $10,000370 $10,000 to $19,999302 $20,000 to $29,999256 $30,000 to $39,999593 $40,000 to $49,999246 $50,000 to $59,999332 $60,000 to $74,999544 $75,000 to $99,999659 $100,000 to $124,999632 $125,000 to $149,9991,082 $150,000 to $199,9993,891 $200,000 or more
Home value of owner - occupied houses in 2022 in Milton, MA 58 Less than $10,00011 $40,000 to $49,9995 $50,000 to $59,99955 $60,000 to $69,99925 $70,000 to $79,99925 $80,000 to $89,9994 $90,000 to $99,99938 $100,000 to $124,99927 $125,000 to $149,9994 $150,000 to $174,9999 $175,000 to $199,99942 $200,000 to $249,99920 $250,000 to $299,99973 $300,000 to $399,999435 $400,000 to $499,9992,251 $500,000 to $749,9992,525 $750,000 to $999,9991,666 $1,000,000 to $1,499,999606 $1,500,000 to $1,999,999546 $2,000,000 or moreRent paid by renters in 2022 in Milton, MA 75 Less than $10036 $200 to $24933 $250 to $29913 $300 to $34919 $450 to $49918 $500 to $54929 $550 to $59931 $700 to $74985 $750 to $79946 $900 to $99992 $1,000 to $1,249152 $1,250 to $1,499235 $1,500 to $1,999186 $2,000 to $2,49976 $2,500 to $2,99926 $3,000 to $3,4998 $3,500 or more59 No cash rent
Percentage of workers working in this county: 54.9%Number of people working at home: 3,983 (26.9% of all workers )
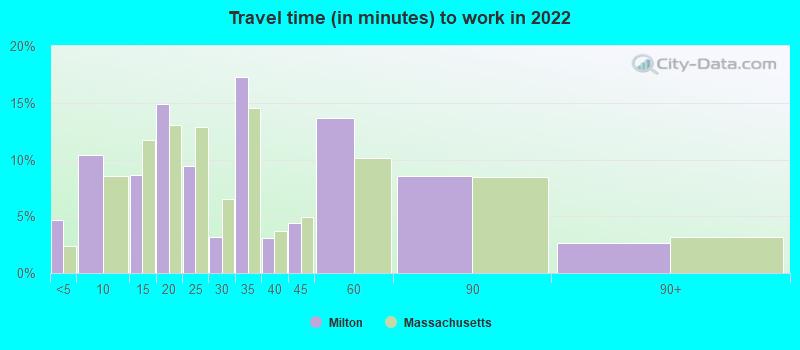
Travel time to work (commute)
Less than 5 minutes: 2615 to 9 minutes: 58310 to 14 minutes: 66415 to 19 minutes: 1,54020 to 24 minutes: 1,32125 to 29 minutes: 53530 to 34 minutes: 1,76835 to 39 minutes: 30940 to 44 minutes: 47245 to 59 minutes: 1,80860 to 89 minutes: 1,18490 or more minutes: 544
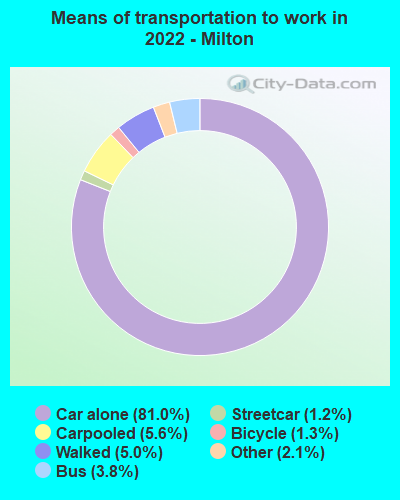
Means of transportation to work:
Drove a car alone: 5,633 (53.6%)Carpooled: 380 (3.6%)Bus : 202 (1.9%)Subway or elevated rail : 81 (0.8%)Taxi: 154 (1.5%)Bicycle: 57 (0.5%)Walked: 329 (3.1%)Worked at home: 3,983 (37.9%)
Unemployment by race in 2022
Unemployment rate for White non-Hispanic residents 4.6% Males2.8% FemalesUnemployment rate for Black residents 2.2% Males2.5% FemalesUnemployment rate for Asian residents 2.3% MalesUnemployment rate for other race residents 9.4% Males2.0% FemalesUnemployment rate for two or more race residents 5.8% Males1.3% FemalesUnemployment rate for Hispanic or Latino residents 2.1% Males
Year of entry for the foreign-born population in Milton, Massachusetts
1,562 2010 or later 931 2000 to 2009 627 1990 to 1999 680 1980 to 1989 431 1970 to 1979 932 Before 1970
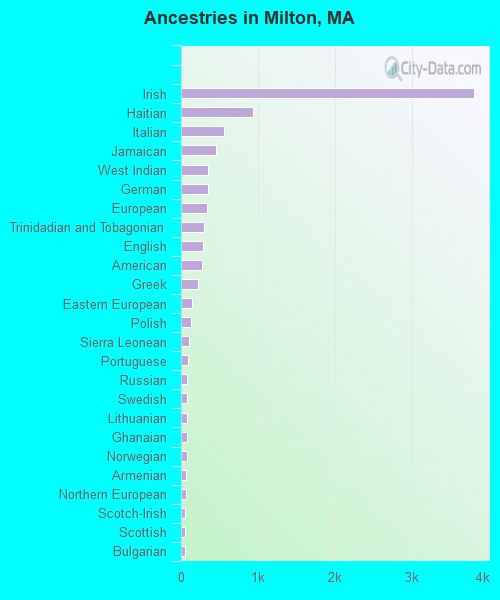
First ancestries reported:
Irish: 3,810 (29.3%)
Haitian: 940 (7.2%)
Italian: 559 (4.3%)
Jamaican: 459 (3.5%)
West Indian: 357 (2.7%)
German: 349 (2.7%)
European: 341 (2.6%)
Trinidadian and Tobagonian: 302 (2.3%)
English: 280 (2.2%)
American: 277 (2.1%)
Greek: 216 (1.7%)
Eastern European: 147 (1.1%)
Polish: 126 (1.0%)
Sierra Leonean: 104 (0.8%)
Portuguese: 92 (0.7%)
Russian: 84 (0.6%)
Swedish: 81 (0.6%)
Lithuanian: 79 (0.6%)
Ghanaian: 75 (0.6%)
Norwegian: 73 (0.6%)
Armenian: 66 (0.5%)
Northern European: 64 (0.5%)
Scotch-Irish: 54 (0.4%)
Scottish: 54 (0.4%)
Bulgarian: 49 (0.4%)
Somali: 49 (0.4%)
Moroccan: 48 (0.4%)
French: 43 (0.3%)
South African: 40 (0.3%)
U.S. Virgin Islander: 36 (0.3%)
French Canadian: 35 (0.3%)
Iranian: 25 (0.2%)
Ukrainian: 25 (0.2%)
Canadian: 21 (0.2%)
Croatian: 19 (0.1%)
Ethiopian: 18 (0.1%)
Lebanese: 12 (0.09%)
Syrian: 12 (0.09%)
Romanian: 12 (0.09%)
Dutch: 12 (0.09%)
Belizean: 12 (0.09%)
Czechoslovakian: 11 (0.08%)
British: 11 (0.08%)
Nigerian: 10 (0.08%)
Czech: 10 (0.08%)
Celtic: 9 (0.07%)
Welsh: 7 (0.05%)
Cajun: 5 (0.04%)
Turkish: 5 (0.04%)
Brazilian: 4 (0.03%)
Cape Verdean: 3 (0.02%)
Most common places of birth for foreign-born residents (%): Haiti Milton:
33.8% (1,542)Massachusetts:
4.9% (60,432)
Jamaica Milton:
10.4% (475)Massachusetts:
1.7% (21,468)
Trinidad and Tobago Milton:
6.4% (292)Massachusetts:
0.6% (6,999)
China, excluding Hong Kong and Taiwan Milton:
6.0% (275)Massachusetts:
8.4% (103,233)
Ireland Milton:
3.2% (146)Massachusetts:
1.1% (13,446)
Hong Kong Milton:
2.8% (127)Massachusetts:
0.7% (8,536)
Vietnam Milton:
2.7% (123)Massachusetts:
3.0% (37,197)
Germany Milton:
1.9% (89)Massachusetts:
1.0% (12,529)
Sierra Leone Milton:
1.9% (89)Massachusetts:
0.1% (1,538)
Colombia Milton:
1.8% (82)Massachusetts:
2.3% (27,810)
Greece Milton:
1.8% (82)Massachusetts:
0.8% (10,043)
Taiwan Milton:
1.8% (82)Massachusetts:
0.7% (8,270)
India Milton:
1.7% (76)Massachusetts:
6.8% (82,934)
Place of birth for U.S.-born residents:
This state: 17,142Other state: 6,288Northeast: 3,243Midwest: 1,183South: 1,093West: 779 91.8% of Milton residents lived in the same house 1 years ago.
Out of people who lived in different houses, 24.3% lived in this county.
Out of people who lived in different counties, 62.1% lived in Massachusetts.
Milton:
91.8%State average:
87.7%
Education attainment for males 25 years and older:
No schooling: 82Nursery to 4th grade: 05th and 6th grade: 87th and 8th grade: 99th grade: 1410th grade: 1211th grade: 1612th grade, no diploma: 90High school graduate (or equivalency): 1,149Less than 1 year of college: 189Some college more than 1 year, no degree: 605Associate degree: 470Bachelor's degree: 2,788Master's degree: 1,983Professional school degree: 864Doctorate degree: 364
Education attainment for females 25 years and older:
No schooling: 263Nursery to 4th grade: 355th and 6th grade: 607th and 8th grade: 249th grade: 2910th grade: 3111th grade: 4812th grade, no diploma: 98High school graduate (or equivalency): 1,503Less than 1 year of college: 161Some college more than 1 year, no degree: 404Associate degree: 601Bachelor's degree: 3,097Master's degree: 2,600Professional school degree: 602Doctorate degree: 394
Housing units in structures:
One, detached: 6,982One, attached: 397Two: 1,2713 or 4: 2005 to 9: 3410 to 19: 17320 to 49: 26150 or more: 282House/condo owner moved in on average 10 years ago
Renter moved in on average 8 years ago
Private vs. public school enrollment:
Students in private schools in grades 1 to 8 (elementary and middle school): 297 Here:
8.5%Massachusetts:
10.3%
Students in private schools in grades 9 to 12 (high school): 567 Here:
33.9%Massachusetts:
12.3%
Students in private undergraduate colleges: 1,860 Here:
73.7%Massachusetts:
51.2%