Milton, WA (Washington) Houses and Residents
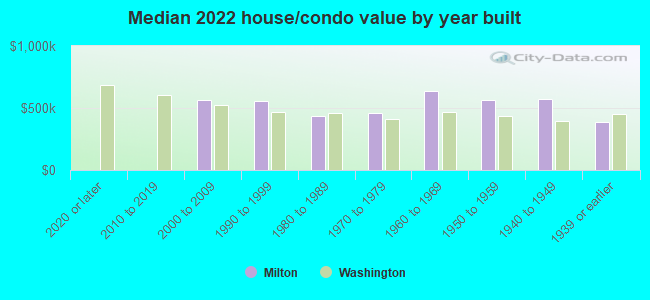
| Milton: | $531,960 |
| Washington: | $569,500 |
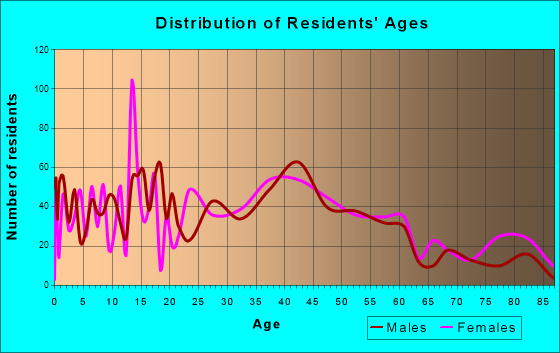
Total population: 7,360 (Urban population: 5,831, Rural population: 0)
Houses: 3,331 (3,238 occupied: 1,833 owner occupied, 1,405 renter occupied)
| % of renters here: | 43% |
| State: | 36% |
Housing density: 1,317 houses/condos per square mile
Median price asked for vacant for-sale houses and condos in 2022: $423,651.
Median contract rent in 2022: $1,795 (lower quartile is $1,404, upper quartile is over $2,000)
Median rent asked for vacant for-rent units in 2022: $1,047
Median gross rent in Milton, WA in 2022: $1,935
Housing units in Milton with a mortgage: 1,196 (53 second mortgage, 0 home equity loan, 47 both second mortgage and home equity loan)
Houses without a mortgage: 16
Median household income for houses/condos with a mortgage: $119,150
Median household income for apartments without a mortgage: $90,451
Median monthly housing costs: $1,826
Compare current foreclosures near Milton, WA:
| Photo | Address | Area | Beds / Baths | Price | Details |
|---|---|---|---|---|---|

|
#1
17th Ave
Milton, WA 98354
|
1,656 sq. feet
|
2 baths 3 beds |
show details | |

|
#2
Thea Ct
Milton, WA 98354
|
1,450 sq. feet
|
2 baths 3 beds |
show details | |

|
#3
Vine St
Milton, WA 98354
|
1,758 sq. feet
|
2 baths 3 beds |
show details | |

|
#4
Laurel St
Milton, WA 98354
|
1,008 sq. feet
|
1 baths 3 beds |
show details | |

|
#5
Laurel St
Milton, WA 98354
|
2,375 sq. feet
|
5 baths 6 beds |
show details | |

|
#6
Fife Way
Milton, WA 98354
|
2,392 sq. feet
|
4 baths 3 beds |
show details | |

|
#7
23rd Ave
Milton, WA 98354
|
2,112 sq. feet
|
2 baths 3 beds |
show details | |

|
#8
Milton Way Apt 2
Milton, WA 98354
|
- sq. feet
|
- baths - beds |
show details | |

|
#9
Milton Way Unit D
Milton, WA 98354
|
- sq. feet
|
- baths - beds |
show details | |

|
#10
11th Ave
Milton, WA 98354
|
- sq. feet
|
- baths - beds |
show details |
| Photo | Address | Area | Beds / Baths | Price | Details |
|---|---|---|---|---|---|

|
#11
6th Ave Apt 1a
Milton, WA 98354
|
- sq. feet
|
- baths - beds |
show details | |

|
#12
Queens Way Apt 1d
Milton, WA 98354
|
- sq. feet
|
- baths - beds |
show details | |

|
#13
5th Ave Apt 5-103
Milton, WA 98354
|
- sq. feet
|
- baths - beds |
show details | |

|
#14
57th Ave S Unit B104
Seattle, WA 98178
|
572 sq. feet
|
1 baths 1 beds |
show details | |

|
#15
42nd Ave S Apt 101
Kent, WA 98032
|
995 sq. feet
|
2 baths 2 beds |
show details | |

|
#16
Veterans Dr SW
Lakewood, WA 98498
|
1,495 sq. feet
|
1 baths 2 beds |
show details | |

|
#17
81st Ave SW
Vashon, WA 98070
|
1,270 sq. feet
|
1 baths 1 beds |
show details | |

|
#18
S 56th St
Tacoma, WA 98408
|
990 sq. feet
|
1 baths 2 beds |
show details | |

|
#19
Browns Point Blvd
Tacoma, WA 98422
|
2,847 sq. feet
|
3 baths 4 beds |
show details | |

|
#20
SE 383rd St
Auburn, WA 98092
|
3,800 sq. feet
|
3 baths 5 beds |
show details |
| Photo | Address | Area | Beds / Baths | Price | Details |
|---|---|---|---|---|---|

|
#21
14th St SW
Puyallup, WA 98371
|
1,920 sq. feet
|
1 baths 3 beds |
show details | |

|
#22
Cypress Point Ave
Tacoma, WA 98466
|
3,056 sq. feet
|
3 baths 4 beds |
show details | |

|
#23
11th Avenue Ct E
Spanaway, WA 98387
|
- sq. feet
|
2 baths 4 beds |
show details | |

|
#24
82nd Avenue Ct E
Spanaway, WA 98387
|
1,974 sq. feet
|
3 baths 3 beds |
show details | |

|
#25
S 239th St
Kent, WA 98032
|
2,210 sq. feet
|
1 baths 4 beds |
show details | |

|
#26
S 182nd St
Seattle, WA 98188
|
1,168 sq. feet
|
2 baths 3 beds |
show details | |

|
#27
Paradise Pkwy
Tacoma, WA 98466
|
1,692 sq. feet
|
1 baths 3 beds |
show details | |

|
#28
SE 217th Pl
Kent, WA 98031
|
1,260 sq. feet
|
1 baths 3 beds |
show details | |

|
#29
9th Avenue Ct SE
Puyallup, WA 98372
|
1,262 sq. feet
|
1 baths 3 beds |
show details | |

|
#30
203rd Ave E
Bonney Lake, WA 98391
|
2,884 sq. feet
|
2 baths 4 beds |
show details |
| Photo | Address | Area | Beds / Baths | Price | Details |
|---|---|---|---|---|---|

|
#31
19th Avenue Ct E
Tacoma, WA 98445
|
1,108 sq. feet
|
1 baths 3 beds |
show details | |

|
#32
136th St E
Tacoma, WA 98445
|
1,312 sq. feet
|
2 baths 3 beds |
show details | |

|
#33
Leschi Drive Fi
Fox Island, WA 98333
|
1,034 sq. feet
|
1 baths 3 beds |
show details | |

|
#34
E D St
Tacoma, WA 98404
|
1,618 sq. feet
|
2 baths 4 beds |
show details | |

|
#35
93rd St E
Bonney Lake, WA 98391
|
1,700 sq. feet
|
2 baths 3 beds |
show details | |

|
#36
37th St NE
Tacoma, WA 98422
|
1,368 sq. feet
|
1 baths 3 beds |
show details | |

|
#37
S 36th Pl
Renton, WA 98055
|
- sq. feet
|
2 baths 4 beds |
show details | |

|
#38
145th Ave E
Graham, WA 98338
|
1,352 sq. feet
|
2 baths 3 beds |
show details | |

|
#39
Violet Meadow St S
Tacoma, WA 98444
|
804 sq. feet
|
1 baths 2 beds |
show details | |

|
#40
S 170th St
Seattle, WA 98188
|
2,650 sq. feet
|
2 baths 5 beds |
show details |
| Photo | Address | Area | Beds / Baths | Price | Details |
|---|---|---|---|---|---|

|
#41
185th Pl SE
Kent, WA 98042
|
2,550 sq. feet
|
2 baths 3 beds |
show details | |

|
#42
28th Pl SW
Federal Way, WA 98023
|
1,620 sq. feet
|
1 baths 3 beds |
show details | |

|
#43
S Trafton St
Tacoma, WA 98405
|
1,160 sq. feet
|
2 baths 3 beds |
show details | |

|
#44
77th St E
Puyallup, WA 98371
|
2,140 sq. feet
|
2 baths 3 beds |
show details | |

|
#45
105th Avenue Ct SW
Lakewood, WA 98498
|
1,148 sq. feet
|
1 baths 3 beds |
show details | |

|
#46
Hallstrom Dr NW
Gig Harbor, WA 98332
|
- sq. feet
|
1 baths 2 beds |
show details | |

|
#47
119th Ave E
Puyallup, WA 98374
|
1,512 sq. feet
|
2 baths 3 beds |
show details | |

|
#48
102nd St SW
Lakewood, WA 98498
|
1,414 sq. feet
|
1 baths 3 beds |
show details | |

|
#49
S M St
Tacoma, WA 98408
|
1,040 sq. feet
|
2 baths 2 beds |
show details | |

|
Check over 1 million property listings on Foreclosure.com!
|
browse all offers | |||

Latest news about housing in Milton, WA collected exclusively by city-data.com from local newspapers, TV, and radio stations


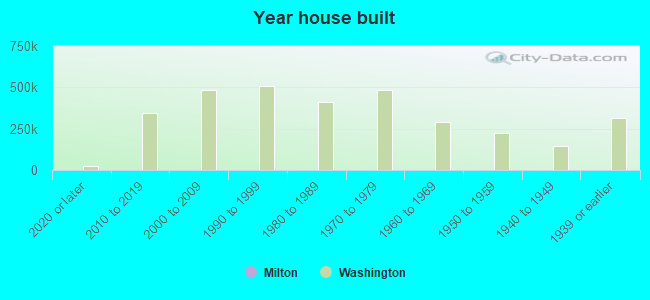
Median year apartment built: 1993
Household type by relationship:
Households: 8,620- Male householders: 1,578 (376 living alone), Female householders: 1,598 (519 living alone)
1,344 spouses (1,335 opposite-sex spouses), 520 unmarried partners, (487 opposite-sex unmarried partners), 2,372 children (2,209 natural, 16 adopted, 146 stepchildren), 61 grandchildren, 245 brothers or sisters, 122 parents, 43 foster children, 156 other relatives, 556 non-relatives
- In group quarters: 22
Size of family households: 814 2-persons, 373 3-persons, 435 4-persons, 134 5-persons, 147 6-persons, 98 7-or-more-persons.
Size of nonfamily households: 912 1-person, 256 2-persons, 63 3-persons.
1,080 married couples with children.
668 single-parent households (286 men, 382 women).
79.0% of residents of Milton speak English at home.
7.3% of residents speak Spanish at home (59% speak English very well, 13% speak English well, 23% speak English not well, 5% don't speak English at all).
7.3% of residents speak other Indo-European language at home (75% speak English very well, 25% speak English well).
5.4% of residents speak Asian or Pacific Island language at home (60% speak English very well, 25% speak English well, 15% speak English not well, 1% don't speak English at all).
0.6% of residents speak other language at home (2% speak English very well, 74% speak English well, 24% speak English not well).
Foreign born population: 1,203 (14.0%)
(63.3% of them are naturalized citizens)
| Here: | 6.1 |
| State: | 6.5 |
| Here: | 3.9 |
| State: | 3.9 |
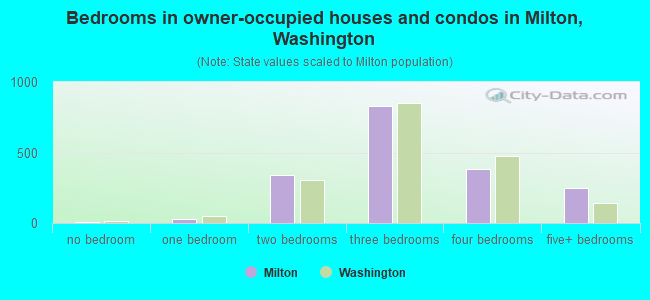
- Bedrooms in owner-occupied houses and condos in Milton, Washington
- 8no bedroom
- 271 bedroom
- 3422 bedrooms
- 8323 bedrooms
- 3804 bedrooms
- 2455+ bedrooms
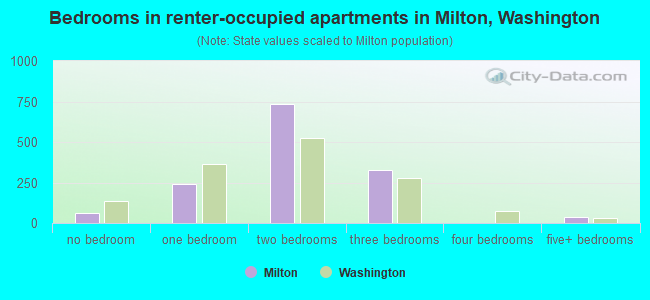
- Bedrooms in renter-occupied apartments in Milton, Washington
- 64no bedroom
- 2401 bedroom
- 7362 bedrooms
- 3293 bedrooms
- 04 bedrooms
- 375+ bedrooms
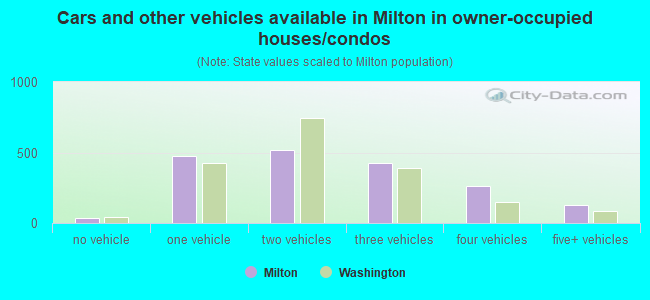
- Cars and other vehicles available in Milton in owner-occupied houses/condos
- 32no vehicle
- 4721 vehicle
- 5192 vehicles
- 4223 vehicles
- 2604 vehicles
- 1295+ vehicles
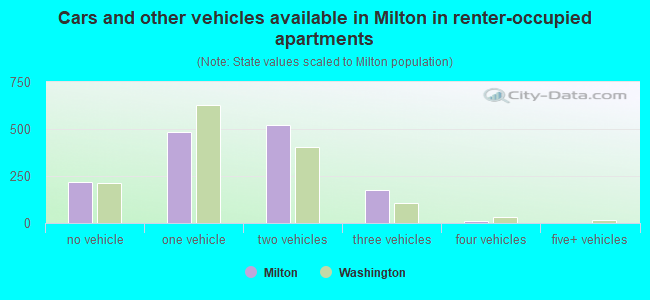
- Cars and other vehicles available in Milton in renter-occupied apartments
- 216no vehicle
- 4831 vehicle
- 5212 vehicles
- 1773 vehicles
- 94 vehicles
- 05+ vehicles
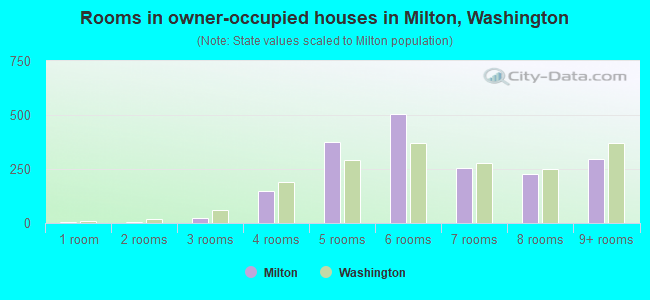
- Rooms in owner-occupied houses in Milton, Washington
- 51 room
- 32 rooms
- 223 rooms
- 1474 rooms
- 3765 rooms
- 5046 rooms
- 2567 rooms
- 2258 rooms
- 2959+ rooms
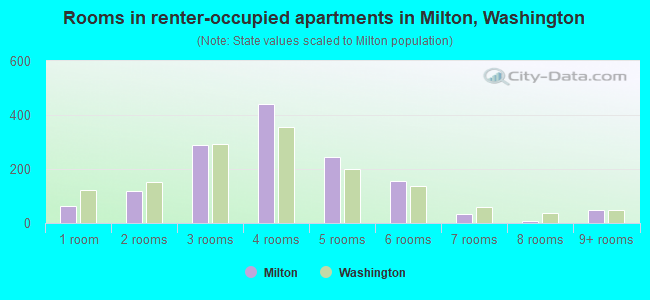
- Rooms in renter-occupied apartments in Milton, Washington
- 641 room
- 1202 rooms
- 2903 rooms
- 4424 rooms
- 2435 rooms
- 1566 rooms
- 327 rooms
- 98 rooms
- 489+ rooms
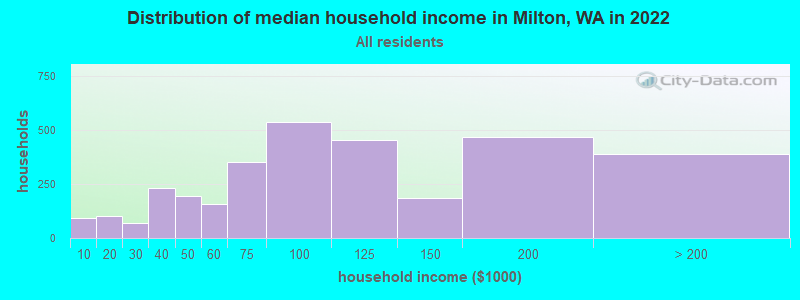
Milton, WA household income distribution

- 94Less than $10,000
- 104$10,000 to $19,999
- 68$20,000 to $29,999
- 231$30,000 to $39,999
- 196$40,000 to $49,999
- 156$50,000 to $59,999
- 351$60,000 to $74,999
- 538$75,000 to $99,999
- 453$100,000 to $124,999
- 185$125,000 to $149,999
- 470$150,000 to $199,999
- 390$200,000 or more
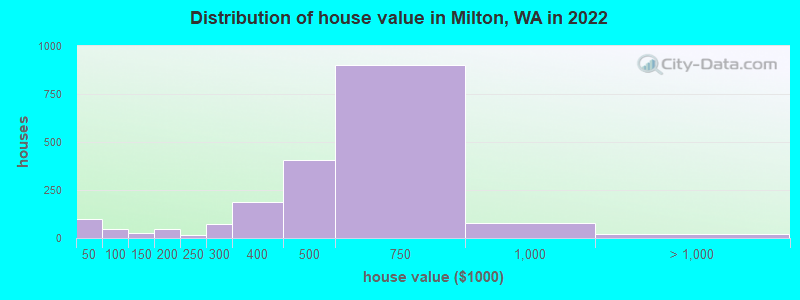
Home value of owner - occupied houses in 2022 in Milton, WA
-
- 33Less than $10,000
- 6$10,000 to $14,999
- 10$25,000 to $29,999
- 45$30,000 to $34,999
- 3$40,000 to $49,999
- 7$50,000 to $59,999
- 16$60,000 to $69,999
- 9$70,000 to $79,999
- 7$90,000 to $99,999
- 21$100,000 to $124,999
- 5$125,000 to $149,999
- 2$150,000 to $174,999
- 41$175,000 to $199,999
- 15$200,000 to $249,999
- 74$250,000 to $299,999
- 188$300,000 to $399,999
- 406$400,000 to $499,999
- 902$500,000 to $749,999
- 77$750,000 to $999,999
- 19$1,000,000 to $1,499,999
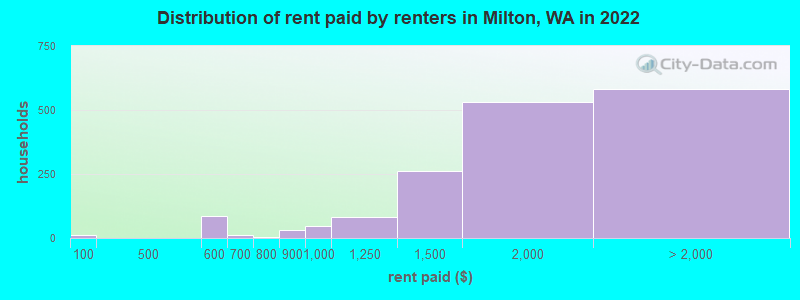
Rent paid by renters in 2022 in Milton, WA
-
- 13Less than $100
- 85$500 to $549
- 13$600 to $649
- 2$750 to $799
- 31$800 to $899
- 45$900 to $999
- 81$1,000 to $1,249
- 260$1,250 to $1,499
- 531$1,500 to $1,999
- 183$2,000 to $2,499
- 296$2,500 to $2,999
- 42$3,000 to $3,499
- 59$3,500 or more
Percentage of workers working in this county: 58.9%
Number of people working at home: 504 (11.3% of all workers)
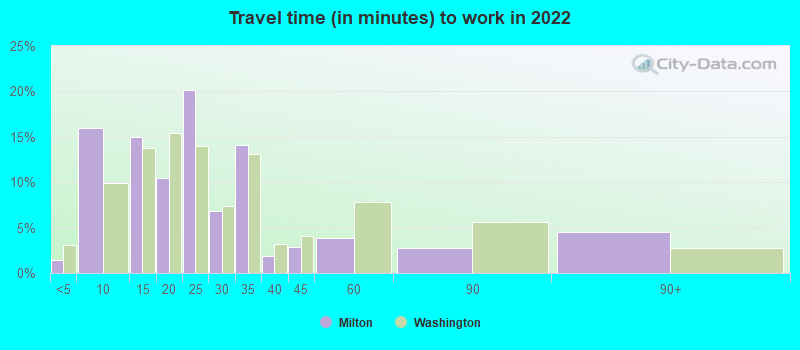
Travel time to work (commute)
- Less than 5 minutes: 50
- 5 to 9 minutes: 521
- 10 to 14 minutes: 271
- 15 to 19 minutes: 581
- 20 to 24 minutes: 641
- 25 to 29 minutes: 484
- 30 to 34 minutes: 483
- 35 to 39 minutes: 164
- 40 to 44 minutes: 213
- 45 to 59 minutes: 219
- 60 to 89 minutes: 217
- 90 or more minutes: 100
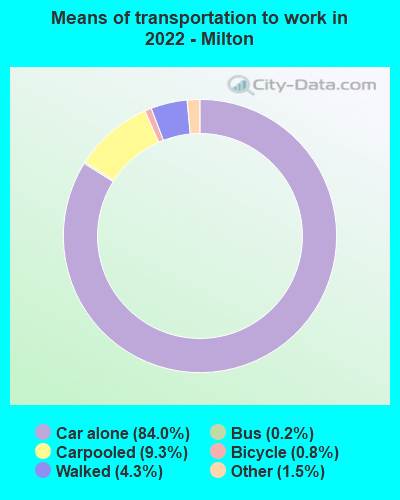
Means of transportation to work:
- Drove a car alone: 2,110 (69.2%)
- Carpooled: 241 (7.9%)
- Bus: 5 (0.2%)
- Taxi: 35 (1.1%)
- Bicycle: 28 (0.9%)
- Walked: 137 (4.5%)
- Worked at home: 504 (16.5%)
- Unemployment by race in 2022
- Unemployment rate for White non-Hispanic residents
- 10.1%Males
- 3.7%Females
- Unemployment rate for American Indian and Alaska Native residents
- 53.2%Females
- Unemployment rate for Asian residents
- 2.9%Females
- Unemployment rate for two or more race residents
- 1.9%Females
- Unemployment rate for Hispanic or Latino residents
- 3.1%Females
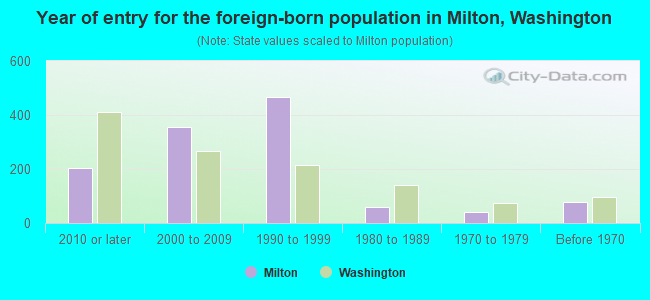
- Year of entry for the foreign-born population in Milton, Washington
- 2052010 or later
- 3542000 to 2009
- 4681990 to 1999
- 591980 to 1989
- 401970 to 1979
- 77Before 1970
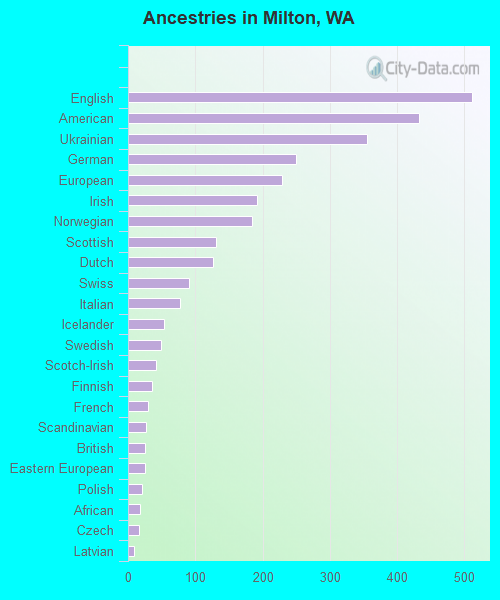
First ancestries reported:
- English: 511 (12.1%)
- American: 433 (10.3%)
- Ukrainian: 355 (8.4%)
- German: 250 (5.9%)
- European: 229 (5.4%)
- Irish: 191 (4.5%)
- Norwegian: 185 (4.4%)
- Scottish: 131 (3.1%)
- Dutch: 127 (3.0%)
- Swiss: 90 (2.1%)
- Italian: 77 (1.8%)
- Icelander: 53 (1.3%)
- Swedish: 49 (1.2%)
- Scotch-Irish: 41 (1.0%)
- Finnish: 35 (0.8%)
- French: 29 (0.7%)
- Scandinavian: 27 (0.6%)
- British: 26 (0.6%)
- Eastern European: 26 (0.6%)
- Polish: 21 (0.5%)
- African: 18 (0.4%)
- Czech: 17 (0.4%)
- Latvian: 9 (0.2%)
- Danish: 2 (0.05%)
- Portuguese: 2 (0.05%)
Most common places of birth for foreign-born residents (%):
| Milton: | 27.4% (320) |
| Washington: | 3.1% (35,872) |
| Milton: | 25.9% (303) |
| Washington: | 21.1% (241,655) |
| Milton: | 15.7% (183) |
| Washington: | 6.3% (71,661) |
| Milton: | 8.7% (102) |
| Washington: | 4.3% (48,886) |
| Milton: | 3.5% (41) |
| Washington: | 8.9% (101,353) |
| Milton: | 2.4% (28) |
| Washington: | 5.4% (62,003) |
| Milton: | 2.1% (25) |
| Washington: | 1.0% (10,943) |
| Milton: | 1.9% (22) |
| Washington: | 0.4% (4,499) |
| Milton: | 1.8% (21) |
| Washington: | 1.1% (12,735) |
| Milton: | 1.7% (20) |
| Washington: | 0.9% (9,937) |
| Milton: | 1.7% (20) |
| Washington: | 4.1% (47,238) |
Place of birth for U.S.-born residents:
- This state: 4,734
- Other state: 2,496
- Northeast: 153
- Midwest: 568
- South: 457
- West: 1,297
85.6% of Milton residents lived in the same house 1 years ago.
Out of people who lived in different houses, 39.5% lived in this county.
Out of people who lived in different counties, 76.9% lived in Washington.
| Milton: | 85.6% |
| State average: | 85.2% |
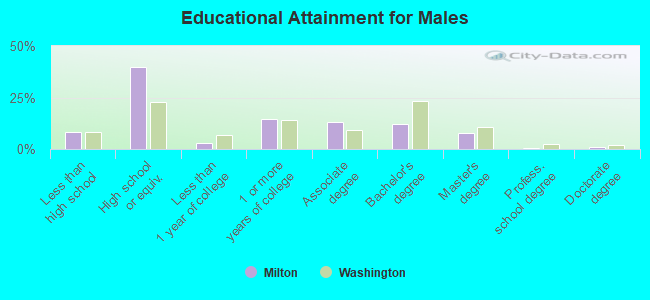
Education attainment for males 25 years and older:
- No schooling: 57
- Nursery to 4th grade: 0
- 5th and 6th grade: 83
- 7th and 8th grade: 0
- 9th grade: 13
- 10th grade: 27
- 11th grade: 26
- 12th grade, no diploma: 42
- High school graduate (or equivalency): 1,193
- Less than 1 year of college: 83
- Some college more than 1 year, no degree: 441
- Associate degree: 388
- Bachelor's degree: 357
- Master's degree: 231
- Professional school degree: 13
- Doctorate degree: 27
Education attainment for females 25 years and older:
- No schooling: 39
- Nursery to 4th grade: 19
- 5th and 6th grade: 34
- 7th and 8th grade: 0
- 9th grade: 9
- 10th grade: 12
- 11th grade: 42
- 12th grade, no diploma: 67
- High school graduate (or equivalency): 1,002
- Less than 1 year of college: 238
- Some college more than 1 year, no degree: 463
- Associate degree: 436
- Bachelor's degree: 464
- Master's degree: 91
- Professional school degree: 12
- Doctorate degree: 0

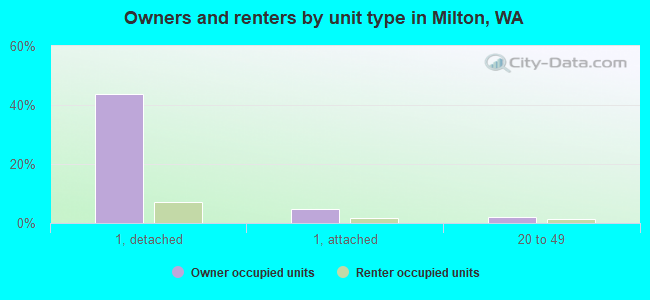
Housing units in structures:
- One, detached: 1,670
- One, attached: 203
- Two: 63
- 3 or 4: 226
- 5 to 9: 270
- 10 to 19: 259
- 20 to 49: 106
- 50 or more: 341
- Mobile homes: 186
- Boats, RVs, vans, etc.: 3
Median worth of mobile homes: $119,685
Housing units lacking complete kitchen facilities in 2022: 2.4%
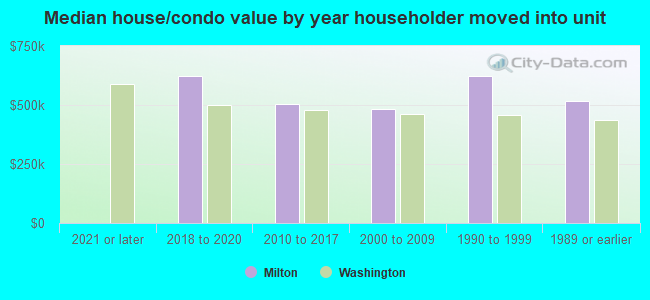
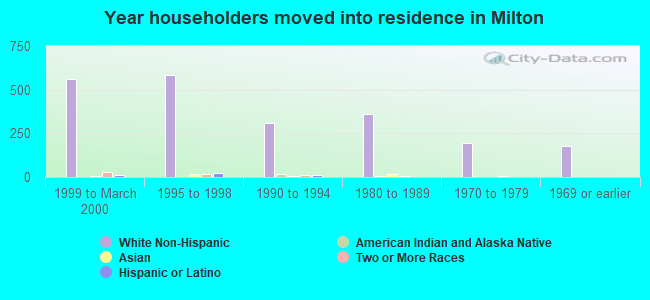
House/condo owner moved in on average 13 years ago
Renter moved in on average 5 years ago
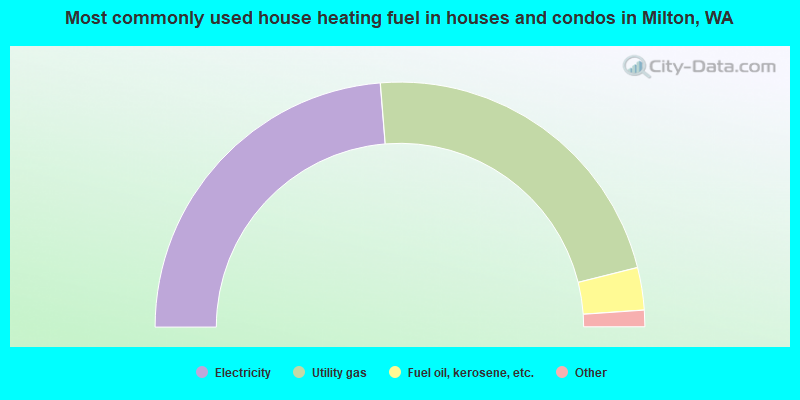
- 47.5%Electricity
- 44.8%Utility gas
- 5.6%Fuel oil, kerosene, etc.
- 1.0%Wood
- 0.7%Bottled, tank, or LP gas
- 0.4%Solar energy
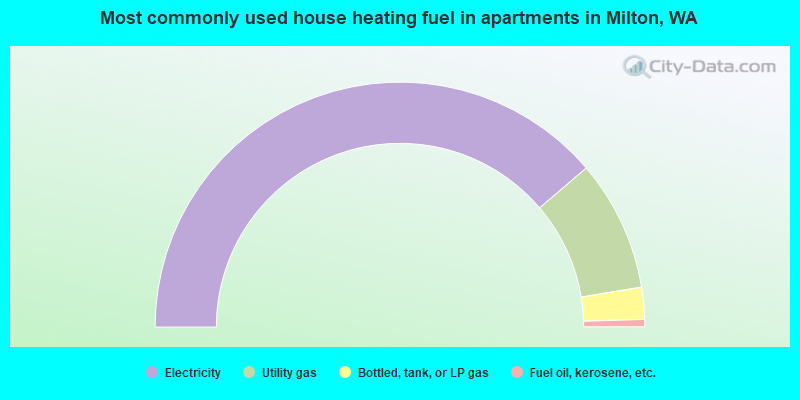
- 77.6%Electricity
- 17.3%Utility gas
- 4.2%Bottled, tank, or LP gas
- 1.0%Fuel oil, kerosene, etc.
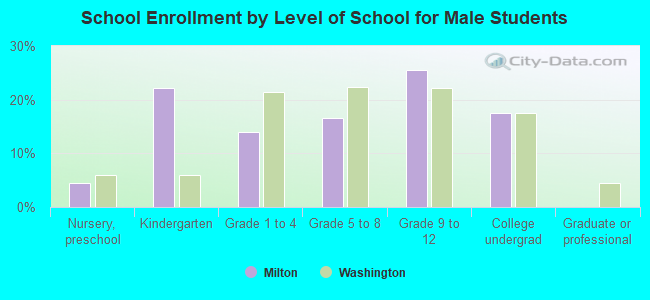
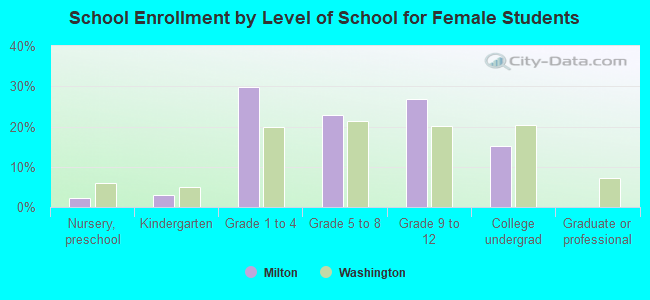
Private vs. public school enrollment:
| Here: | 15.6% |
| Washington: | 12.4% |
| Here: | 0.0% |
| Washington: | 9.2% |
| Here: | 18.7% |
| Washington: | 16.5% |