Mineola, NY (New York) Houses and Residents
Estimated median house or condo value in 2022: $615,043 (it was $241,200 in 2000 )
Mineola:
$615,043New York:
$400,400
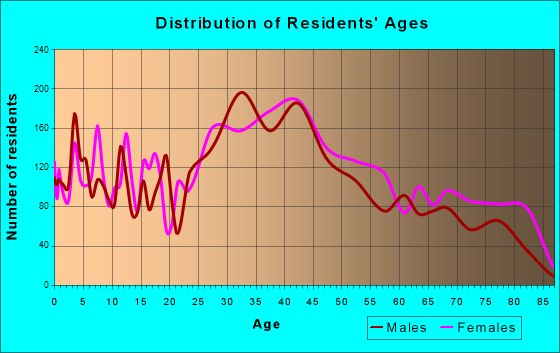
Lower value quartile - upper value quartile: $496,656 - $734,257Total population: 19,028 (All urban)
Houses: 8,901 (8,466 occupied: 5,284 owner occupied, 3,167 renter occupied )
% of renters here:
37%State:
46%
Housing density: 4,784 houses/condos per square mile
Median price asked for vacant for-sale houses and condos in 2022: $3,517,439.
Median contract rent in 2022: over $2,000 (lower quartile is $1,384, upper quartile is over $2,000)
Median rent asked for vacant for-rent units in 2022: $2,363
Median gross rent in Mineola, NY in 2022: over $2,000
Housing units in Mineola with a mortgage: 3,028 (282 second mortgage, 12 home equity loan, 178 both second mortgage and home equity loan )Houses without a mortgage: 84
Median household income for houses/condos with a mortgage: $178,953
Median household income for apartments without a mortgage: $104,870
Median monthly housing costs: $2,062
Data:
Median house or condo value ($)
Median house or condo value ($ change since 2000)
Median house or condo value ($) - White
Median house or condo value ($) - Black or African American
Median house or condo value ($) - Asian
Median house or condo value ($) - Hispanic or Latino
Median house or condo value ($) - American Indian and Alaska Native
Median house or condo value ($) - Multirace
Median house or condo value ($) - Other Race
Median price asked for mobile homes ($)
Household density (households per square mile)
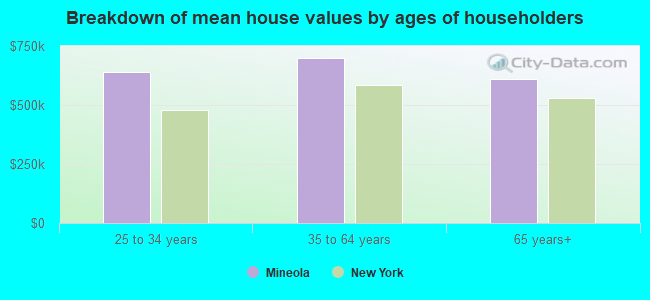
Mean house or condo value by units in structure - 1, detached ($)
Mean house or condo value by units in structure - 1, attached ($)
Mean house or condo value by units in structure - 2 ($)
Mean house or condo value by units in structure by units in structure - 3 or 4 ($)
Mean house or condo value by units in structure - 5 or more ($)
Mean house or condo value by units in structure - Boat, RV, van, etc. ($)
Mean house or condo value by units in structure - Mobile home ($)
Median contract rent ($)
Median contract rent - Lower quartile ($)
Median contract rent - Upper quartile ($)
Median gross rent ($)
Urban houses (%)
Rural houses (%)
Houses occupied (%)
Houses occupied (% change since 2000)
Houses owner occupied (%)
Houses owner occupied (% change since 2000)
Houses renter occupied (%)
Houses renter occupied (% change since 2000)
Vacant housing units - For rent (%)
Vacant housing units - For rent (% change since 2000)
Vacant housing units - For sale only (%)
Vacant housing units - For sale only (% change since 2000)
Vacant housing units - Rented or sold, not occupied (%)
Vacant housing units - Rented or sold, not occupied (% change since 2000)
Vacant housing units - For seasonal, recreational, or occasional use (%)
Vacant housing units - For seasonal, recreational, or occasional use (% change since 2000)
Vacant housing units - For migrant workers (%)
Vacant housing units - For migrant workers (% change since 2000)
Vacant housing units - Other vacant (%)
Vacant housing units - Other vacant (% change since 2000)
Median monthly housing costs ($)
Median household income for houses/condos with a mortgage ($)
Median household income for houses/condos without a mortgage ($)
Median household income ($)
Median household income ($) - White
Median household income ($) - Black or African American
Median household income ($) - Asian
Median household income ($) - Hispanic or Latino
Median household income ($) - American Indian and Alaska Native
Median household income ($) - Multirace
Median household income ($) - Other Race
Mortgage status - with mortgage (%)
Mortgage status - with second mortgage (%)
Mortgage status - with home equity loan (%)
Mortgage status - with both second mortgage and home equity loan (%)
Mortgage status - without a mortgage (%)
Median year house/condo built
Median year apartment built
Household type by relationship - Male householder living alone (%)
Household type by relationship - Male householder not living alone (%)
Household type by relationship - Female householder living alone (%)
Household type by relationship - Female householder not living alone (%)
Household type by relationship - Opposite-Sex spouse (%)
Household type by relationship - Same-Sex spouse (%)
Household type by relationship - Opposite-Sex unmarried partner (%)
Household type by relationship - Same-Sex unmarried partner (%)
Household type by relationship - In group quarters (%)
Size of family households - 2-person household (%)
Size of family households - 3-person household (%)
Size of family households - 4-person household (%)
Size of family households - 5-person household (%)
Size of family households - 6-person household (%)
Size of family households - 7-or-more-person household (%)
Size of nonfamily households - 1-person household (%)
Size of nonfamily households - 2-person household (%)
Size of nonfamily households - 3-person household (%)
Size of nonfamily households - 4-person household (%)
Size of nonfamily households - 5-person household (%)
Size of nonfamily households - 6-person household (%)
Size of nonfamily households - 7-or-moreperson household (%)
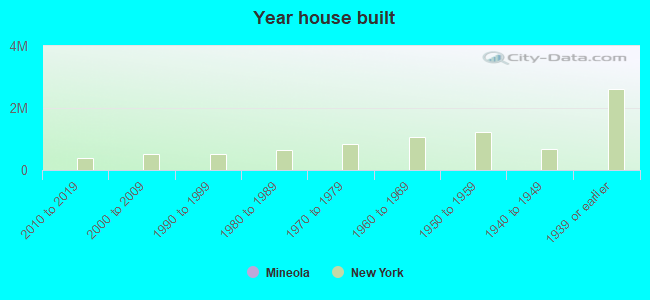
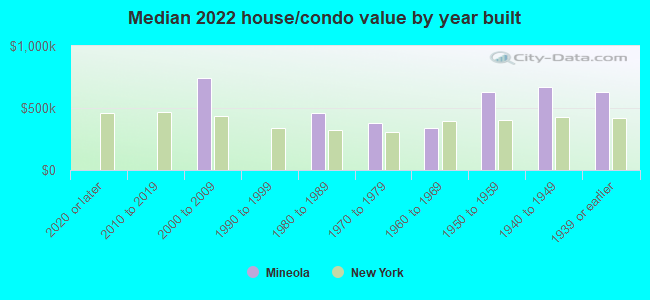
Year house built - Built 2010 or later (%)
Year house built - Built 2000 to 2009 (%)
Year house built - Built 1990 to 1999 (%)
Year house built - Built 1980 to 1989 (%)
Year house built - Built 1970 to 1979 (%)
Year house built - Built 1960 to 1969 (%)
Year house built - Built 1950 to 1959 (%)
Year house built - Built 1940 to 1949 (%)
Year house built - Built 1939 or earlier (%)
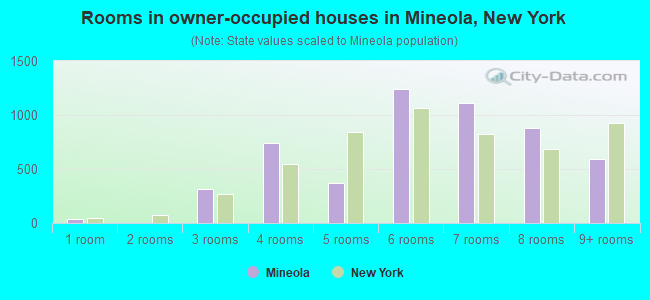
Median number of rooms in houses and condos
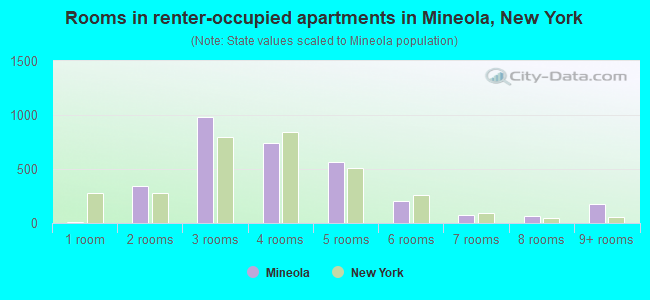
Median number of rooms in apartments
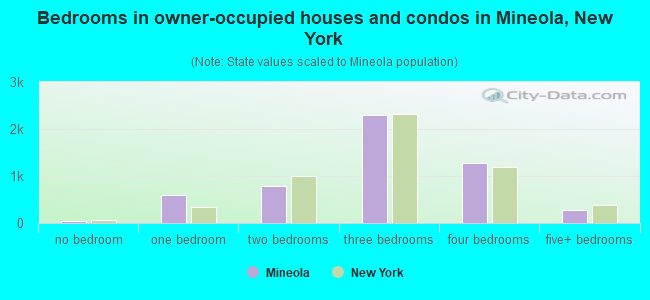
Median number of bedrooms in owner occupied houses
Mean number of bedrooms in owner occupied houses
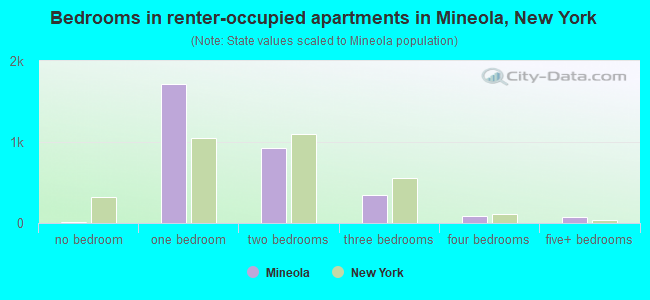
Median number of bedrooms in renter occupied houses
Mean number of bedrooms in renter occupied houses
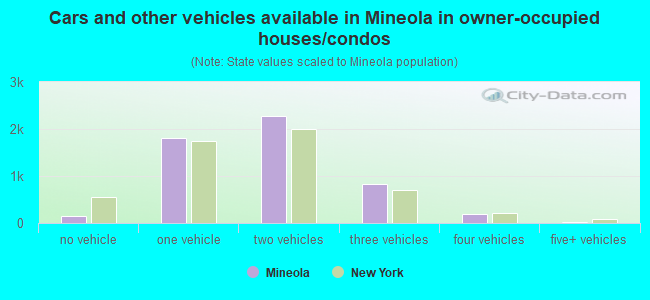
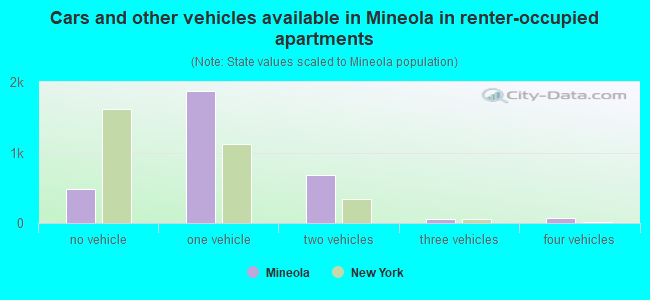
Median number of vehichles in owner occupied houses
Mean number of vehichles in owner occupied houses
Median number of vehichles in renter occupied houses
Mean number of vehichles in renter occupied houses
Rooms in owner-occupied houses - 1 room (%)
Rooms in owner-occupied houses - 2 rooms (%)
Rooms in owner-occupied houses - 3 rooms (%)
Rooms in owner-occupied houses - 4 rooms (%)
Rooms in owner-occupied houses - 5 rooms (%)
Rooms in owner-occupied houses - 6 rooms (%)
Rooms in owner-occupied houses - 7 rooms (%)
Rooms in owner-occupied houses - 8 rooms (%)
Rooms in owner-occupied houses - 9+ rooms (%)
Rooms in renter-occupied houses - 1 room (%)
Rooms in renter-occupied houses - 2 rooms (%)
Rooms in renter-occupied houses - 3 rooms (%)
Rooms in renter-occupied houses - 4 rooms (%)
Rooms in renter-occupied houses - 5 rooms (%)
Rooms in renter-occupied houses - 6 rooms (%)
Rooms in renter-occupied houses - 7 rooms (%)
Rooms in renter-occupied houses - 8 rooms (%)
Rooms in renter-occupied houses - 9+ rooms (%)
Bedrooms in owner-occupied houses - no bedrooms (%)
Bedrooms in owner-occupied houses - 1 bedroom (%)
Bedrooms in owner-occupied houses - 2 bedrooms (%)
Bedrooms in owner-occupied houses - 3 bedrooms (%)
Bedrooms in owner-occupied houses - 4 bedrooms (%)
Bedrooms in owner-occupied houses - 5+ bedrooms (%)
Bedrooms in renter-occupied houses - no bedrooms (%)
Bedrooms in renter-occupied houses - 1 bedroom (%)
Bedrooms in renter-occupied houses - 2 bedrooms (%)
Bedrooms in renter-occupied houses - 3 bedrooms (%)
Bedrooms in renter-occupied houses - 4 bedrooms (%)
Bedrooms in renter-occupied houses - 5+ bedrooms (%)
Vehicles available in owner-occupied houses - no vehicle available (%)
Vehicles available in owner-occupied houses - 1 vehicle available(%)
Vehicles available in owner-occupied houses - 2 Vehicles available (%)
Vehicles available in owner-occupied houses - 3 Vehicles available (%)
Vehicles available in owner-occupied houses - 4 Vehicles available (%)
Vehicles available in owner-occupied houses - 5+ Vehicles available (%)
Vehicles available in renter-occupied houses - no vehicle available (%)
Vehicles available in renter-occupied houses - 1 vehicle available (%)
Vehicles available in renter-occupied houses - 2 Vehicles available (%)
Vehicles available in renter-occupied houses - 3 Vehicles available (%)
Vehicles available in renter-occupied houses - 4 Vehicles available (%)
Vehicles available in renter-occupied houses - 5+ Vehicles available (%)
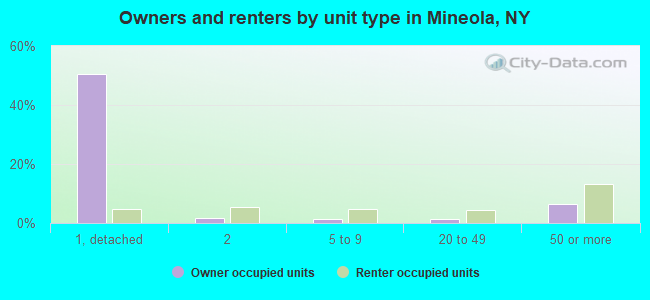
Housing units in structures - 1, detached (%)
Housing units in structures - 1, attached (%)
Housing units in structures - 2 (%)
Housing units in structures - 3 or 4 (%)
Housing units in structures - 5 to 9 (%)
Housing units in structures - 10 to 19 (%)
Housing units in structures - 20 to 49 (%)
Housing units in structures - 50 or more (%)
Housing units in structures - Mobile home (%)
Housing units in structures - Boat, RV, van, etc. (%)
Housing units in structures - Owners - 1, detached (%)
Housing units in structures - Owners - 1, attached (%)
Housing units in structures - Owners - 2 (%)
Housing units in structures - Owners - 3 or 4 (%)
Housing units in structures - Owners - 5 to 9 (%)
Housing units in structures - Owners - 10 to 19 (%)
Housing units in structures - Owners - 20 to 49 (%)
Housing units in structures - Owners - 50 or more (%)
Housing units in structures - Owners - Mobile home (%)
Housing units in structures - Owners - Boat, RV, van, etc. (%)
Housing units in structures - Renters - 1, detached (%)
Housing units in structures - Renters - 1, attached (%)
Housing units in structures - Renters - 2 (%)
Housing units in structures - Renters - 3 or 4 (%)
Housing units in structures - Renters - 5 to 9 (%)
Housing units in structures - Renters - 10 to 19 (%)
Housing units in structures - Renters - 20 to 49 (%)
Housing units in structures - Renters - 50 or more (%)
Housing units in structures - Renters - Mobile home (%)
Housing units in structures - Renters - Boat, RV, van, etc. (%)
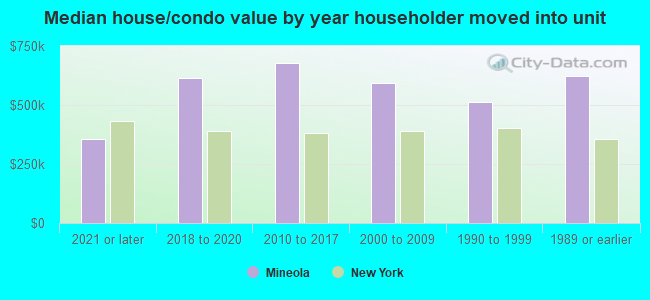
House/condo owner moved in on average (years ago)
Renter moved in on average (years ago)
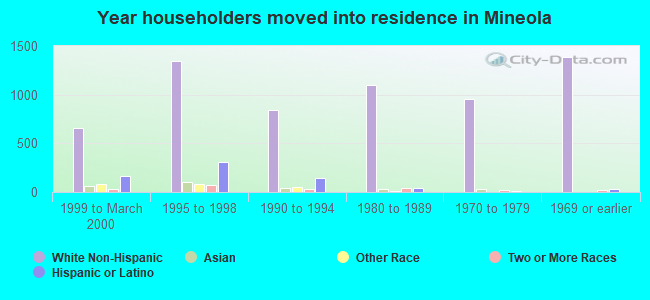
Year householder moved into unit - Moved in 1999 to March 2000 (%)
Year householder moved into unit - Moved in 1999 to March 2000 (%) - White
Year householder moved into unit - Moved in 1999 to March 2000 (%) - Black or African American
Year householder moved into unit - Moved in 1999 to March 2000 (%) - Asian
Year householder moved into unit - Moved in 1999 to March 2000 (%) - Hispanic or Latino
Year householder moved into unit - Moved in 1999 to March 2000 (%) - American Indian and Alaska Native
Year householder moved into unit - Moved in 1999 to March 2000 (%) - Multirace
Year householder moved into unit - Moved in 1999 to March 2000 (%) - Other Race
Year householder moved into unit - Moved in 1995 to 1998 (%)
Year householder moved into unit - Moved in 1995 to 1998 (%) - White
Year householder moved into unit - Moved in 1995 to 1998 (%) - Black or African American
Year householder moved into unit - Moved in 1995 to 1998 (%) - Asian
Year householder moved into unit - Moved in 1995 to 1998 (%) - Hispanic or Latino
Year householder moved into unit - Moved in 1995 to 1998 (%) - American Indian and Alaska Native
Year householder moved into unit - Moved in 1995 to 1998 (%) - Multirace
Year householder moved into unit - Moved in 1995 to 1998 (%) - Other Race
Year householder moved into unit - Moved in 1990 to 1994 (%)
Year householder moved into unit - Moved in 1990 to 1994 (%) - White
Year householder moved into unit - Moved in 1990 to 1994 (%) - Black or African American
Year householder moved into unit - Moved in 1990 to 1994 (%) - Asian
Year householder moved into unit - Moved in 1990 to 1994 (%) - Hispanic or Latino
Year householder moved into unit - Moved in 1990 to 1994 (%) - American Indian and Alaska Native
Year householder moved into unit - Moved in 1990 to 1994 (%) - Multirace
Year householder moved into unit - Moved in 1990 to 1994 (%) - Other Race
Year householder moved into unit - Moved in 1980 to 1989 (%)
Year householder moved into unit - Moved in 1980 to 1989 (%) - White
Year householder moved into unit - Moved in 1980 to 1989 (%) - Black or African American
Year householder moved into unit - Moved in 1980 to 1989 (%) - Asian
Year householder moved into unit - Moved in 1980 to 1989 (%) - Hispanic or Latino
Year householder moved into unit - Moved in 1980 to 1989 (%) - American Indian and Alaska Native
Year householder moved into unit - Moved in 1980 to 1989 (%) - Multirace
Year householder moved into unit - Moved in 1980 to 1989 (%) - Other Race
Year householder moved into unit - Moved in 1970 to 1979 (%)
Year householder moved into unit - Moved in 1970 to 1979 (%) - White
Year householder moved into unit - Moved in 1970 to 1979 (%) - Black or African American
Year householder moved into unit - Moved in 1970 to 1979 (%) - Asian
Year householder moved into unit - Moved in 1970 to 1979 (%) - Hispanic or Latino
Year householder moved into unit - Moved in 1970 to 1979 (%) - American Indian and Alaska Native
Year householder moved into unit - Moved in 1970 to 1979 (%) - Multirace
Year householder moved into unit - Moved in 1970 to 1979 (%) - Other Race
Year householder moved into unit - Moved in 1969 or earlier (%)
Year householder moved into unit - Moved in 1969 or earlier (%) - White
Year householder moved into unit - Moved in 1969 or earlier (%) - Black or African American
Year householder moved into unit - Moved in 1969 or earlier (%) - Asian
Year householder moved into unit - Moved in 1969 or earlier (%) - Hispanic or Latino
Year householder moved into unit - Moved in 1969 or earlier (%) - American Indian and Alaska Native
Year householder moved into unit - Moved in 1969 or earlier (%) - Multirace
Year householder moved into unit - Moved in 1969 or earlier (%) - Other Race
Housing units lacking complete plumbing facilities (%)
Housing units lacking complete kitchen facilities (%)
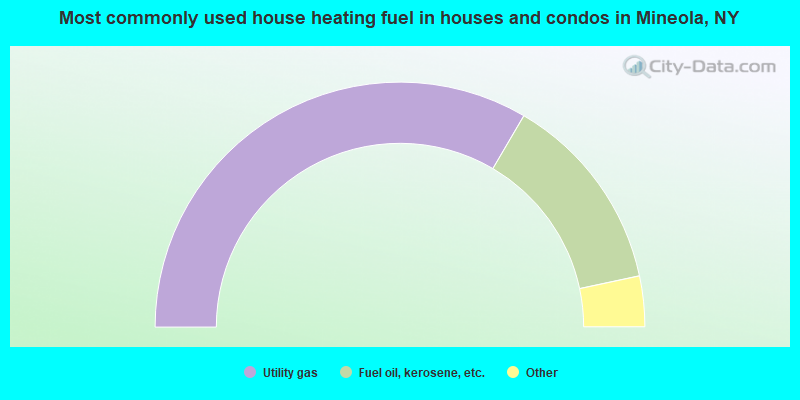
House heating fuel used in houses and condos - Utility gas (%)
House heating fuel used in houses and condos - Bottled, tank, or LP gas (%)
House heating fuel used in houses and condos - Electricity (%)
House heating fuel used in houses and condos - Fuel oil, kerosene, etc. (%)
House heating fuel used in houses and condos - Coal or coke (%)
House heating fuel used in houses and condos - Wood (%)
House heating fuel used in houses and condos - Solar energy (%)
House heating fuel used in houses and condos - Other fuel (%)
House heating fuel used in houses and condos - No fuel used (%)
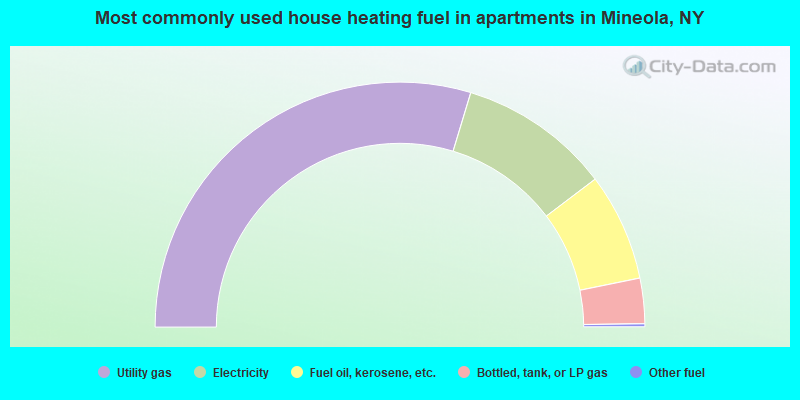
House heating fuel used in apartments - Utility gas (%)
House heating fuel used in apartments - Bottled, tank, or LP gas (%)
House heating fuel used in apartments - Electricity (%)
House heating fuel used in apartments - Fuel oil, kerosene, etc. (%)
House heating fuel used in apartments - Coal or coke (%)
House heating fuel used in apartments - Wood (%)
House heating fuel used in apartments - Solar energy (%)
House heating fuel used in apartments - Other fuel (%)
House heating fuel used in apartments - No fuel used (%)
Latest news about housing in Mineola, NY collected exclusively by city-data.com from local newspapers, TV, and radio stations
Median year house/condo built: 1948Median year apartment built: 1966Household type by relationship:
Households: 20,858
Male householders: 4,753 (1,089 living alone ), Female householders: 3,640 (1,205 living alone )4,126 spouses (4,104 opposite-sex spouses ), 612 unmarried partners , (599 opposite-sex unmarried partners ), 5,462 children (5,167 natural , 125 adopted , 169 stepchildren ), 168 grandchildren , 122 brothers or sisters , 564 parents , 0 foster children , 548 other relatives , 846 non-relatives In group quarters: 10
Size of family households: 2,392 2-persons , 972 3-persons , 1,161 4-persons , 542 5-persons , 191 6-persons , 58 7-or-more-persons .
Size of nonfamily households: 2,392 1-person , 697 2-persons , 66 3-persons , 31 4-persons .
2,661 married couples with children. single-parent households (399 men , 124 women ).
61.9% of residents of Mineola speak English at home. of residents speak Spanish at home (70% speak English very well , 15% speak English well , 9% speak English not well , 6% don't speak English at all ).of residents speak other Indo-European language at home (66% speak English very well , 17% speak English well , 9% speak English not well , 8% don't speak English at all ).of residents speak Asian or Pacific Island language at home (65% speak English very well , 17% speak English well , 12% speak English not well , 6% don't speak English at all ).of residents speak other language at home (88% speak English very well , 9% speak English well , 3% speak English not well ).
Foreign born population: 6,326 (30.3%)of them are naturalized citizens )
Median number of rooms in houses and condos:
Median number of rooms in apartments
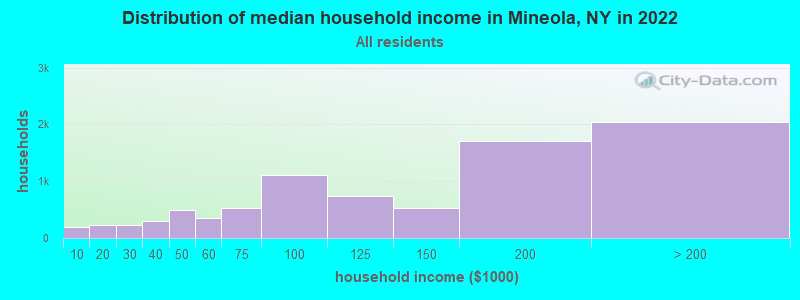
Mineola, NY household income distribution 199 Less than $10,000224 $10,000 to $19,999229 $20,000 to $29,999293 $30,000 to $39,999494 $40,000 to $49,999347 $50,000 to $59,999536 $60,000 to $74,9991,101 $75,000 to $99,999746 $100,000 to $124,999536 $125,000 to $149,9991,715 $150,000 to $199,9992,042 $200,000 or more
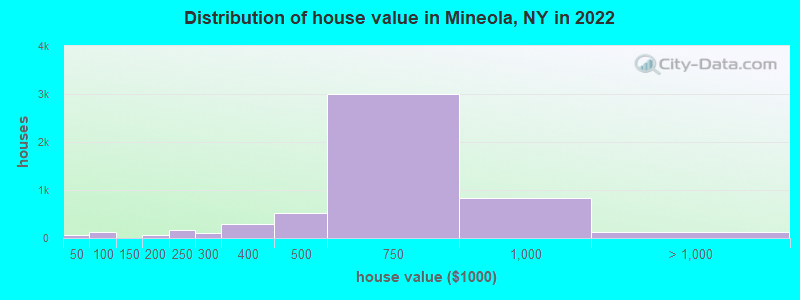
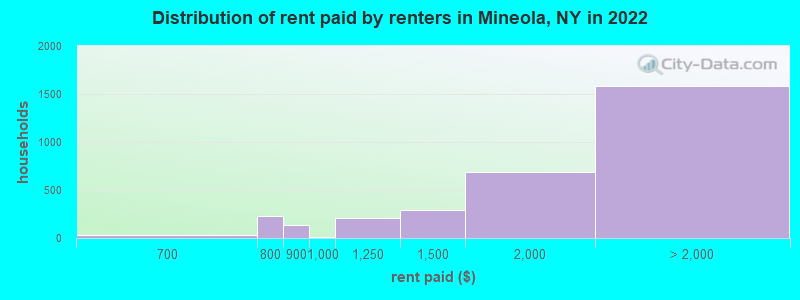
Home value of owner - occupied houses in 2022 in Mineola, NY 4 Less than $10,00022 $10,000 to $14,99937 $30,000 to $34,99989 $60,000 to $69,99920 $70,000 to $79,9997 $80,000 to $89,99957 $175,000 to $199,999161 $200,000 to $249,999111 $250,000 to $299,999285 $300,000 to $399,999517 $400,000 to $499,9993,000 $500,000 to $749,999840 $750,000 to $999,99969 $1,000,000 to $1,499,99946 $2,000,000 or moreRent paid by renters in 2022 in Mineola, NY 9 $600 to $64918 $650 to $69944 $700 to $749186 $750 to $799130 $800 to $89914 $900 to $999212 $1,000 to $1,249292 $1,250 to $1,499685 $1,500 to $1,999445 $2,000 to $2,499457 $2,500 to $2,999263 $3,000 to $3,499379 $3,500 or more35 No cash rent
Percentage of workers working in this county: 64.8%Number of people working at home: 1,807 (14.5% of all workers )
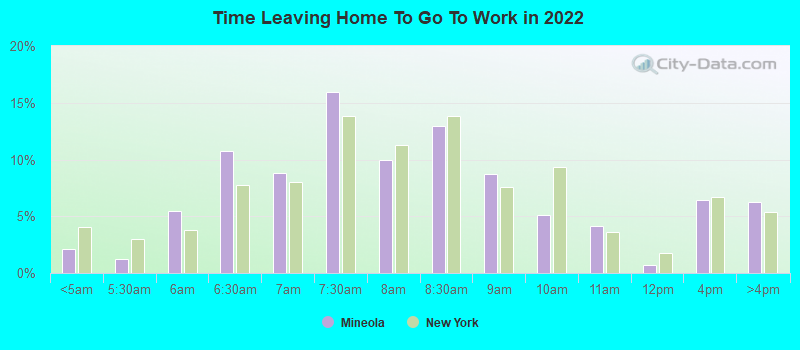
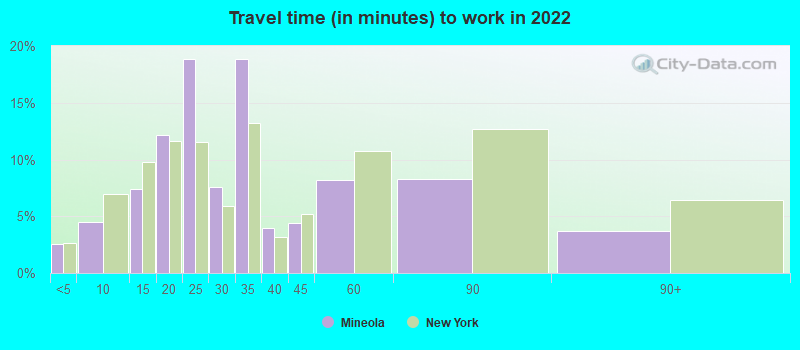
Travel time to work (commute)
Less than 5 minutes: 2095 to 9 minutes: 84610 to 14 minutes: 96615 to 19 minutes: 1,33220 to 24 minutes: 1,53625 to 29 minutes: 52430 to 34 minutes: 1,51635 to 39 minutes: 19640 to 44 minutes: 28745 to 59 minutes: 1,00360 to 89 minutes: 1,71790 or more minutes: 477
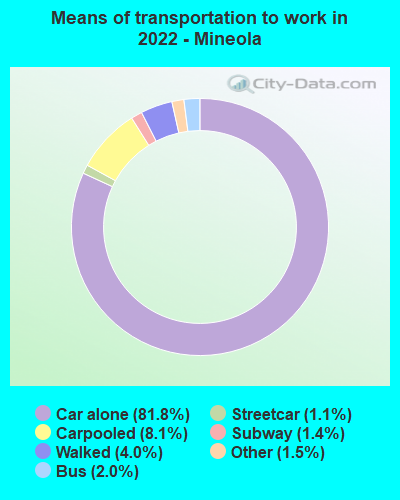
Means of transportation to work:
Drove a car alone: 13,903 (72.7%)Carpooled: 1,340 (7.0%)Bus : 324 (1.7%)Subway or elevated rail : 163 (0.9%)Long-distance train or commuter rail : 207 (1.1%)Light rail, streetcar or trolley : 6 (0.0%)Taxi: 374 (2.0%)Bicycle: 22 (0.1%)Walked: 732 (3.8%)Worked at home: 1,807 (9.4%)
Unemployment by race in 2022
Unemployment rate for White non-Hispanic residents 3.6% Males2.0% FemalesUnemployment rate for Asian residents 2.3% Males7.3% FemalesUnemployment rate for other race residents 5.0% Males1.9% FemalesUnemployment rate for Hispanic or Latino residents 3.8% Males1.4% Females
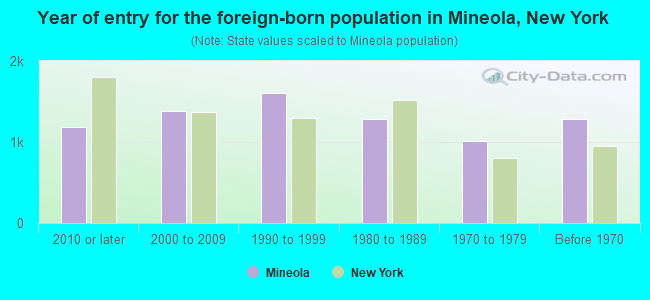
Year of entry for the foreign-born population in Mineola, New York
1,182 2010 or later 1,387 2000 to 2009 1,603 1990 to 1999 1,279 1980 to 1989 1,016 1970 to 1979 1,278 Before 1970
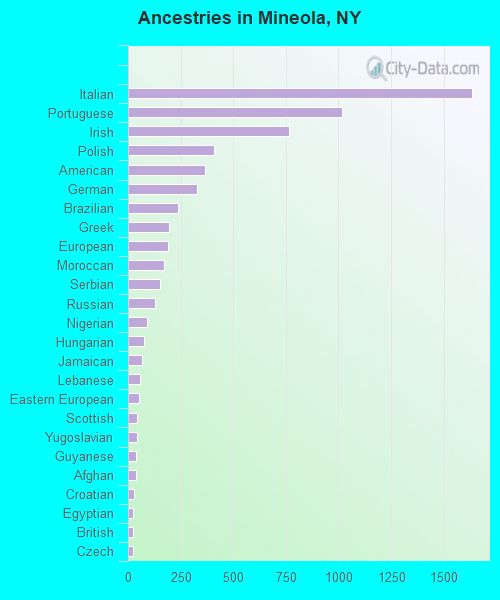
First ancestries reported:
Italian: 1,634 (14.8%)
Portuguese: 1,017 (9.2%)
Irish: 767 (6.9%)
Polish: 409 (3.7%)
American: 364 (3.3%)
German: 327 (3.0%)
Brazilian: 237 (2.1%)
Greek: 197 (1.8%)
European: 190 (1.7%)
Moroccan: 173 (1.6%)
Serbian: 152 (1.4%)
Russian: 127 (1.1%)
Nigerian: 88 (0.8%)
Hungarian: 78 (0.7%)
Jamaican: 68 (0.6%)
Lebanese: 58 (0.5%)
Eastern European: 54 (0.5%)
Scottish: 45 (0.4%)
Yugoslavian: 44 (0.4%)
Guyanese: 38 (0.3%)
Afghan: 37 (0.3%)
Croatian: 29 (0.3%)
Egyptian: 25 (0.2%)
British: 24 (0.2%)
Czech: 22 (0.2%)
Czechoslovakian: 21 (0.2%)
Scotch-Irish: 17 (0.2%)
French: 15 (0.1%)
Dutch: 12 (0.1%)
Swedish: 10 (0.09%)
Iranian: 9 (0.08%)
Cypriot: 8 (0.07%)
Armenian: 7 (0.06%)
Slovak: 6 (0.05%)
Maltese: 4 (0.04%) Most common places of birth for foreign-born residents (%): Portugal Mineola:
14.5% (887)New York:
0.2% (10,519)
Brazil Mineola:
8.0% (488)New York:
0.7% (30,658)
Pakistan Mineola:
5.8% (352)New York:
1.4% (62,442)
Philippines Mineola:
5.1% (314)New York:
2.0% (91,070)
China, excluding Hong Kong and Taiwan Mineola:
4.9% (298)New York:
9.1% (410,910)
Honduras Mineola:
4.4% (271)New York:
1.2% (55,571)
Hong Kong Mineola:
4.1% (253)New York:
0.9% (42,220)
India Mineola:
3.6% (222)New York:
3.5% (158,432)
Indonesia Mineola:
3.3% (202)New York:
0.1% (6,729)
Serbia Mineola:
3.1% (192)New York:
0.1% (5,010)
Poland Mineola:
3.0% (182)New York:
1.4% (65,102)
Dominican Republic Mineola:
2.8% (174)New York:
11.1% (501,040)
El Salvador Mineola:
2.8% (170)New York:
2.4% (108,067)
Korea Mineola:
2.5% (153)New York:
1.8% (82,786)
Italy Mineola:
2.0% (125)New York:
1.8% (81,374)
Japan Mineola:
2.0% (124)New York:
0.6% (28,472)
Other Eastern Europe Mineola:
1.9% (118)New York:
0.7% (30,173)
Taiwan Mineola:
1.9% (115)New York:
0.7% (30,619)
Belarus Mineola:
1.8% (113)New York:
0.4% (17,813)
Colombia Mineola:
1.7% (106)New York:
2.5% (111,920)
Hungary Mineola:
1.6% (97)New York:
0.2% (8,808)
Place of birth for U.S.-born residents:
This state: 12,765Other state: 1,497Northeast: 467Midwest: 166South: 528West: 339 90.0% of Mineola residents lived in the same house 1 years ago.
Out of people who lived in different houses, 34.2% lived in this county.
Out of people who lived in different counties, 54.2% lived in New York.
Mineola:
90.0%State average:
89.6%
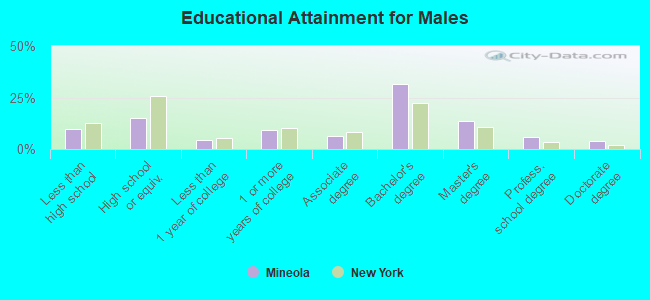
Education attainment for males 25 years and older:
No schooling: 157Nursery to 4th grade: 1655th and 6th grade: 1277th and 8th grade: 699th grade: 910th grade: 13011th grade: 5612th grade, no diploma: 87High school graduate (or equivalency): 1,244Less than 1 year of college: 365Some college more than 1 year, no degree: 762Associate degree: 501Bachelor's degree: 2,605Master's degree: 1,126Professional school degree: 487Doctorate degree: 305
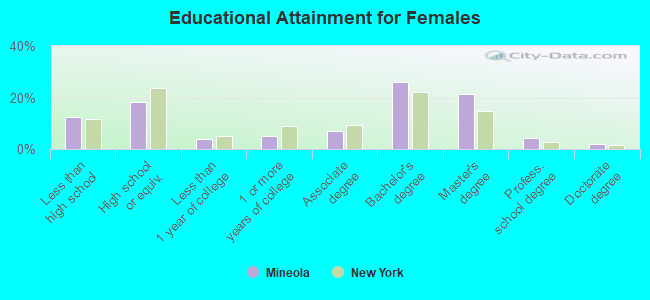
Education attainment for females 25 years and older:
No schooling: 203Nursery to 4th grade: 825th and 6th grade: 1757th and 8th grade: 929th grade: 1510th grade: 11511th grade: 2112th grade, no diploma: 307High school graduate (or equivalency): 1,455Less than 1 year of college: 310Some college more than 1 year, no degree: 405Associate degree: 549Bachelor's degree: 2,098Master's degree: 1,718Professional school degree: 332Doctorate degree: 144
Housing units in structures:
One, detached: 4,955One, attached: 93Two: 6473 or 4: 2965 to 9: 46310 to 19: 23120 to 49: 48350 or more: 1,719Mobile homes: 13Housing units lacking complete plumbing facilities in 2022: 0.2%Housing units lacking complete kitchen facilities in 2022: 0.7%House/condo owner moved in on average 15 years ago
Renter moved in on average 3 years ago
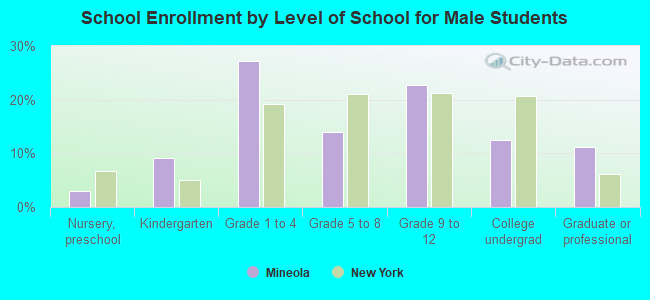
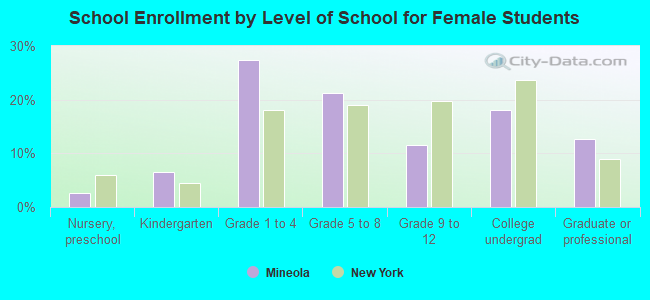
Private vs. public school enrollment:
Students in private schools in grades 1 to 8 (elementary and middle school): 235 Students in private schools in grades 9 to 12 (high school): 86 Students in private undergraduate colleges: 317