Mineral Wells, TX (Texas) Houses and Residents
| Mineral Wells: | $151,701 |
| Texas: | $275,400 |
Mean price in 2022:
Detached houses: $170,684
Here: $170,684 State: $369,058 Townhouses or other attached units: $107,361
Here: $107,361 State: $327,631 Mobile homes: $67,299
Here: $67,299 State: $124,413
Total population: 15,362 (Urban population: 14,172 (all inside urban clusters), Rural population: 2,757 (15 farm, 2,742 nonfarm))
Houses: 6,292 (5,423 occupied: 3,226 owner occupied, 2,278 renter occupied)
| % of renters here: | 41% |
| State: | 38% |
Housing density: 308 houses/condos per square mile
Median price asked for vacant for-sale houses and condos in 2022: $228,874.
Median contract rent in 2022: $759 (lower quartile is $613, upper quartile is $927)
Median rent asked for vacant for-rent units in 2022: $785
Median gross rent in Mineral Wells, TX in 2022: $990
Housing units in Mineral Wells with a mortgage: 1,273 (33 second mortgage, 0 home equity loan, 36 both second mortgage and home equity loan)
Houses without a mortgage: 6
Median household income for houses/condos with a mortgage: $94,407
Median household income for apartments without a mortgage: $50,537
Median monthly housing costs: $920
Compare current foreclosures near Mineral Wells, TX:
| Photo | Address | Area | Beds / Baths | Price | Details |
|---|---|---|---|---|---|

|
#1
NW 11th St
Mineral Wells, TX 76067
|
1,316 sq. feet
|
2 baths 3 beds |
show details | |

|
#2
NW 1st Ave
Mineral Wells, TX 76067
|
- sq. feet
|
- baths - beds |
show details | |

|
#3
SW 5th Ave
Mineral Wells, TX 76067
|
1,536 sq. feet
|
- baths - beds |
show details | |

|
#4
Highway 180 W Apt 203
Mineral Wells, TX 76067
|
- sq. feet
|
- baths - beds |
show details | |

|
#5
Highway 180 W Apt 1301
Mineral Wells, TX 76067
|
- sq. feet
|
- baths - beds |
show details | |

|
#6
SE 18th St
Mineral Wells, TX 76067
|
- sq. feet
|
- baths - beds |
show details | |

|
#7
NW 7th Ave
Mineral Wells, TX 76067
|
1,632 sq. feet
|
- baths - beds |
show details | |

|
#8
Shattles Rd
Mineral Wells, TX 76067
|
- sq. feet
|
- baths - beds |
show details | |

|
#9
Sam Houston Ave
Mineral Wells, TX 76067
|
- sq. feet
|
- baths - beds |
show details | |

|
#10
SW 1st St
Mineral Wells, TX 76067
|
- sq. feet
|
- baths - beds |
show details |
| Photo | Address | Area | Beds / Baths | Price | Details |
|---|---|---|---|---|---|

|
#11
Southwind Rd
Mineral Wells, TX 76067
|
- sq. feet
|
- baths - beds |
show details | |

|
#12
Johnson Bend Rd
Weatherford, TX 76088
|
1,968 sq. feet
|
- baths - beds |
show details | |

|
#13
Fm 920
Poolville, TX 76487
|
- sq. feet
|
- baths - beds |
show details | |

|
#14
Dixie Rd
Weatherford, TX 76087
|
1,624 sq. feet
|
- baths - beds |
show details | |

|
#15
Mineral Wells Hwy
Weatherford, TX 76088
|
- sq. feet
|
- baths - beds |
show details | |

|
#16
Johnson Bend Rd
Weatherford, TX 76088
|
2,112 sq. feet
|
- baths - beds |
show details | |

|
#17
Lora Ln
Weatherford, TX 76088
|
1,690 sq. feet
|
- baths - beds |
show details | |

|
#18
Jolin Ln
Weatherford, TX 76088
|
- sq. feet
|
- baths - beds |
show details | |

|
#19
Jordan Rd
Poolville, TX 76487
|
- sq. feet
|
- baths - beds |
show details | |

|
#20
Monterrey Rd
Weatherford, TX 76088
|
- sq. feet
|
- baths - beds |
show details |
| Photo | Address | Area | Beds / Baths | Price | Details |
|---|---|---|---|---|---|

|
#21
Old Dennis Rd
Weatherford, TX 76087
|
- sq. feet
|
- baths - beds |
show details | |

|
#22
E Dry Creek Rd
Poolville, TX 76487
|
- sq. feet
|
- baths - beds |
show details | |

|
#23
N Blue Jay Ct
Weatherford, TX 76088
|
- sq. feet
|
- baths - beds |
show details | |

|
#24
Oakridge Dr
Weatherford, TX 76086
|
1,210 sq. feet
|
- baths - beds |
show details | |

|
#25
Greenwood Cut Off Rd
Weatherford, TX 76088
|
2,800 sq. feet
|
- baths - beds |
show details | |

|
#26
W Lee Ave
Graford, TX 76449
|
- sq. feet
|
- baths - beds |
show details | |

|
#27
Ballard Rd
Weatherford, TX 76088
|
2,611 sq. feet
|
- baths - beds |
show details | |

|
#28
Giles Ln
Santo, TX 76472
|
1,470 sq. feet
|
- baths - beds |
show details | |

|
#29
Russell Bend Rd
Weatherford, TX 76088
|
- sq. feet
|
- baths - beds |
show details | |

|
#30
Red Fox Ct
Weatherford, TX 76088
|
2,432 sq. feet
|
- baths - beds |
show details |
| Photo | Address | Area | Beds / Baths | Price | Details |
|---|---|---|---|---|---|

|
#31
Gopher Rd
Weatherford, TX 76088
|
- sq. feet
|
- baths - beds |
show details | |

|
#32
Olive Branch Rd
Weatherford, TX 76087
|
1,423 sq. feet
|
- baths - beds |
show details | |

|
#33
Advance Rd
Weatherford, TX 76088
|
- sq. feet
|
- baths - beds |
show details | |

|
#34
Fm 1885
Weatherford, TX 76088
|
- sq. feet
|
- baths - beds |
show details | |

|
#35
S Fm 113
Millsap, TX 76066
|
1,200 sq. feet
|
- baths - beds |
show details | |

|
#36
River View Rd
Millsap, TX 76066
|
160 sq. feet
|
- baths - beds |
show details | |

|
#37
Cambridge Park Trl
Weatherford, TX 76088
|
- sq. feet
|
- baths - beds |
show details | |

|
#38
River View Rd
Millsap, TX 76066
|
- sq. feet
|
- baths - beds |
show details | |

|
#39
Cool Jct
Millsap, TX 76066
|
1,120 sq. feet
|
- baths - beds |
show details | |

|
#40
Cottongame Dr
Weatherford, TX 76088
|
- sq. feet
|
- baths - beds |
show details |
| Photo | Address | Area | Beds / Baths | Price | Details |
|---|---|---|---|---|---|

|
#41
Paradise Pkwy
Poolville, TX 76487
|
- sq. feet
|
- baths - beds |
show details | |

|
#42
N Fm 52
Weatherford, TX 76088
|
- sq. feet
|
- baths - beds |
show details | |

|
Check over 1 million property listings on Foreclosure.com!
|
browse all offers | |||


 | Mineral Wells Tx Job Opportunity (5 replies) |
| Run of the mill cookie cutter houses (53 replies) |
| Suburbs of Dallas/Fort Worth (17 replies) |
| Need advice: Boston or DFW (213 replies) |
| Connecticut, and D/FW (29 replies) |
| Weatherford, Mineral Wells, Fort Worth, TX (9 replies) |

Median year apartment built: 1973
Household type by relationship:
Households: 15,453- Male householders: 2,540 (607 living alone), Female householders: 2,808 (805 living alone)
2,247 spouses (2,233 opposite-sex spouses), 613 unmarried partners, (590 opposite-sex unmarried partners), 4,835 children (4,360 natural, 247 adopted, 227 stepchildren), 332 grandchildren, 192 brothers or sisters, 345 parents, 26 foster children, 497 other relatives, 667 non-relatives
- In group quarters: 347
Size of family households: 1,528 2-persons, 725 3-persons, 676 4-persons, 362 5-persons, 177 6-persons, 138 7-or-more-persons.
Size of nonfamily households: 1,488 1-person, 282 2-persons, 125 3-persons.
2,052 married couples with children.
1,247 single-parent households (211 men, 1,036 women).
80.6% of residents of Mineral Wells speak English at home.
17.0% of residents speak Spanish at home (72% speak English very well, 16% speak English well, 10% speak English not well, 2% don't speak English at all).
1.3% of residents speak other Indo-European language at home (70% speak English very well, 3% speak English well, 27% speak English not well).
0.8% of residents speak Asian or Pacific Island language at home (88% speak English very well, 3% speak English well, 8% speak English not well).
Foreign born population: 1,188 (7.7%)
(41.7% of them are naturalized citizens)
| Here: | 5.9 |
| State: | 6.3 |
| Here: | 4.5 |
| State: | 4.0 |

- Bedrooms in owner-occupied houses and condos in Mineral Wells, Texas
- 22no bedroom
- 631 bedroom
- 5972 bedrooms
- 1,8123 bedrooms
- 5654 bedrooms
- 1675+ bedrooms

- Bedrooms in renter-occupied apartments in Mineral Wells, Texas
- 56no bedroom
- 3171 bedroom
- 1,0372 bedrooms
- 7763 bedrooms
- 904 bedrooms
- 35+ bedrooms

- Cars and other vehicles available in Mineral Wells in owner-occupied houses/condos
- 113no vehicle
- 9061 vehicle
- 1,2692 vehicles
- 5543 vehicles
- 2344 vehicles
- 1515+ vehicles

- Cars and other vehicles available in Mineral Wells in renter-occupied apartments
- 260no vehicle
- 1,0691 vehicle
- 6622 vehicles
- 1593 vehicles
- 974 vehicles
- 335+ vehicles

- Rooms in owner-occupied houses in Mineral Wells, Texas
- 221 room
- 02 rooms
- 813 rooms
- 4514 rooms
- 6935 rooms
- 8206 rooms
- 5657 rooms
- 3398 rooms
- 2549+ rooms

- Rooms in renter-occupied apartments in Mineral Wells, Texas
- 561 room
- 812 rooms
- 1743 rooms
- 7564 rooms
- 5605 rooms
- 3946 rooms
- 1637 rooms
- 618 rooms
- 339+ rooms


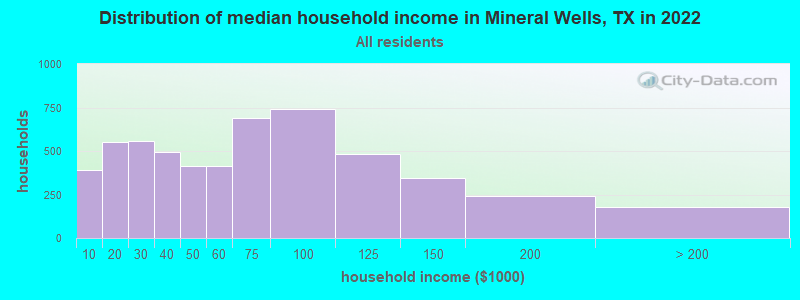
Mineral Wells, TX household income distribution

- 388Less than $10,000
- 554$10,000 to $19,999
- 558$20,000 to $29,999
- 496$30,000 to $39,999
- 416$40,000 to $49,999
- 415$50,000 to $59,999
- 690$60,000 to $74,999
- 741$75,000 to $99,999
- 482$100,000 to $124,999
- 343$125,000 to $149,999
- 243$150,000 to $199,999
- 177$200,000 or more
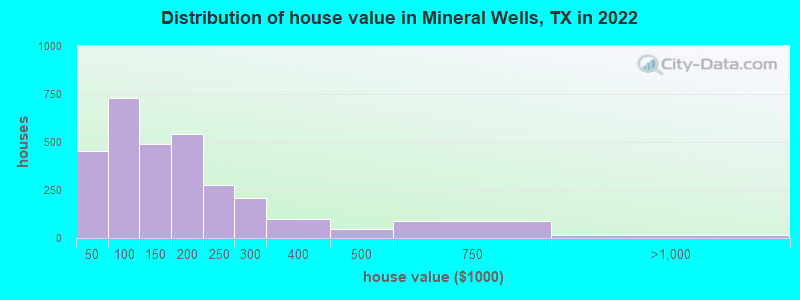
Home value of owner - occupied houses in 2022 in Mineral Wells, TX
-
- 39Less than $10,000
- 29$10,000 to $14,999
- 14$15,000 to $19,999
- 46$20,000 to $24,999
- 47$25,000 to $29,999
- 74$30,000 to $34,999
- 35$35,000 to $39,999
- 163$40,000 to $49,999
- 150$50,000 to $59,999
- 107$60,000 to $69,999
- 112$70,000 to $79,999
- 132$80,000 to $89,999
- 62$90,000 to $99,999
- 250$100,000 to $124,999
- 237$125,000 to $149,999
- 386$150,000 to $174,999
- 155$175,000 to $199,999
- 275$200,000 to $249,999
- 205$250,000 to $299,999
- 97$300,000 to $399,999
- 47$400,000 to $499,999
- 86$500,000 to $749,999
- 13$750,000 to $999,999
Rent paid by renters in 2022 in Mineral Wells, TX
-
- 22$150 to $199
- 23$200 to $249
- 25$250 to $299
- 32$300 to $349
- 49$350 to $399
- 94$400 to $449
- 17$450 to $499
- 122$500 to $549
- 95$550 to $599
- 231$600 to $649
- 162$650 to $699
- 279$700 to $749
- 145$750 to $799
- 312$800 to $899
- 166$900 to $999
- 197$1,000 to $1,249
- 75$1,250 to $1,499
- 47$1,500 to $1,999
- 2$2,500 to $2,999
- 8$3,000 to $3,499
- 95No cash rent


Percentage of workers working in this county: 61.2%
Number of people working at home: 475 (7.2% of all workers)
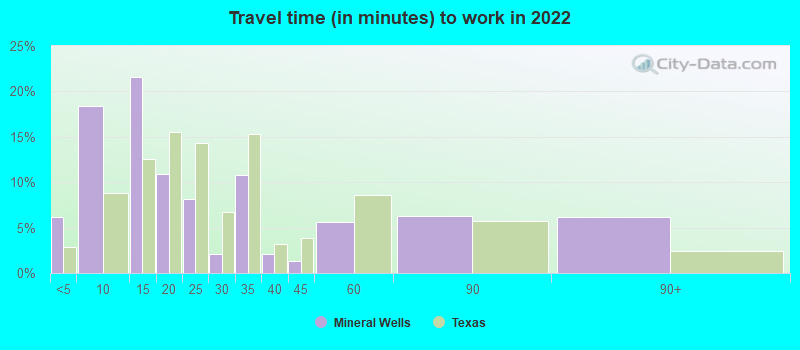
Travel time to work (commute)
- Less than 5 minutes: 451
- 5 to 9 minutes: 1,034
- 10 to 14 minutes: 957
- 15 to 19 minutes: 621
- 20 to 24 minutes: 310
- 25 to 29 minutes: 208
- 30 to 34 minutes: 714
- 35 to 39 minutes: 125
- 40 to 44 minutes: 348
- 45 to 59 minutes: 401
- 60 to 89 minutes: 368
- 90 or more minutes: 475
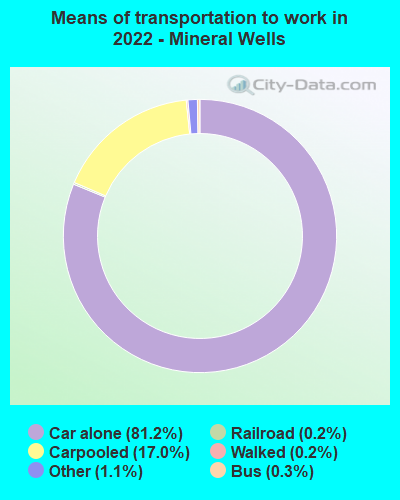
Means of transportation to work:
- Drove a car alone: 4,590 (72.6%)
- Carpooled: 1,042 (16.5%)
- Bus: 14 (0.2%)
- Light rail, streetcar or trolley: 14 (0.2%)
- Taxi: 75 (1.2%)
- Walked: 14 (0.2%)
- Worked at home: 475 (7.5%)

- Unemployment by race in 2022
- Unemployment rate for White non-Hispanic residents
- 5.4%Males
- 5.4%Females
- Unemployment rate for Asian residents
- 15.5%Males
- Unemployment rate for other race residents
- 16.1%Males
- 19.7%Females
- Unemployment rate for two or more race residents
- 33.3%Females
- Unemployment rate for Hispanic or Latino residents
- 5.7%Males
- 14.2%Females
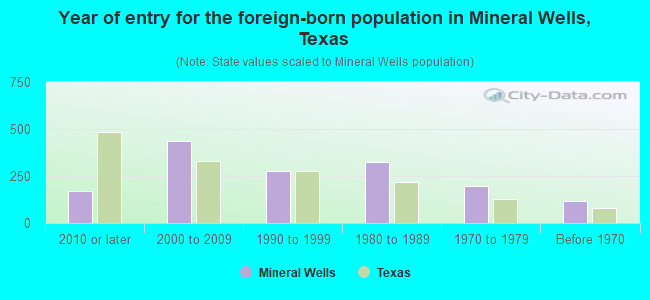
- Year of entry for the foreign-born population in Mineral Wells, Texas
- 1692010 or later
- 4382000 to 2009
- 2751990 to 1999
- 3221980 to 1989
- 1971970 to 1979
- 115Before 1970

First ancestries reported:
- English: 936 (12.4%)
- American: 921 (12.2%)
- Irish: 789 (10.4%)
- German: 292 (3.9%)
- Scotch-Irish: 118 (1.6%)
- European: 108 (1.4%)
- Norwegian: 40 (0.5%)
- Italian: 31 (0.4%)
- Scottish: 28 (0.4%)
- Welsh: 18 (0.2%)
- African: 10 (0.1%)
- British: 8 (0.1%)
- Dutch: 8 (0.1%)
- French Canadian: 7 (0.09%)
- Northern European: 7 (0.09%)
- Austrian: 5 (0.07%)
- Dutch West Indian: 5 (0.07%)
- French: 2 (0.03%)
- Swedish: 2 (0.03%)
- Polish: 1 (0.01%)
Most common places of birth for foreign-born residents (%):
| Mineral Wells: | 67.3% (800) |
| Texas: | 48.4% (2,411,723) |
| Mineral Wells: | 16.5% (196) |
| Texas: | 6.1% (306,347) |
| Mineral Wells: | 6.6% (78) |
| Texas: | 4.5% (224,455) |
| Mineral Wells: | 2.1% (25) |
| Texas: | 0.8% (37,989) |
Place of birth for U.S.-born residents:
- This state: 11,917
- Other state: 1,999
- Northeast: 104
- Midwest: 540
- South: 642
- West: 721
86.0% of Mineral Wells residents lived in the same house 1 years ago.
Out of people who lived in different houses, 39.6% lived in this county.
Out of people who lived in different counties, 71.3% lived in Texas.
| Mineral Wells: | 86.0% |
| State average: | 85.7% |
Education attainment for males 25 years and older:
- No schooling: 136
- Nursery to 4th grade: 25
- 5th and 6th grade: 48
- 7th and 8th grade: 154
- 9th grade: 93
- 10th grade: 106
- 11th grade: 103
- 12th grade, no diploma: 131
- High school graduate (or equivalency): 1,977
- Less than 1 year of college: 455
- Some college more than 1 year, no degree: 534
- Associate degree: 310
- Bachelor's degree: 462
- Master's degree: 142
- Professional school degree: 49
- Doctorate degree: 13

Education attainment for females 25 years and older:
- No schooling: 175
- Nursery to 4th grade: 34
- 5th and 6th grade: 57
- 7th and 8th grade: 67
- 9th grade: 110
- 10th grade: 90
- 11th grade: 98
- 12th grade, no diploma: 183
- High school graduate (or equivalency): 1,859
- Less than 1 year of college: 405
- Some college more than 1 year, no degree: 732
- Associate degree: 608
- Bachelor's degree: 478
- Master's degree: 156
- Professional school degree: 19
- Doctorate degree: 0


Housing units in structures:
- One, detached: 4,432
- One, attached: 69
- Two: 302
- 3 or 4: 314
- 5 to 9: 160
- 10 to 19: 120
- 20 to 49: 116
- 50 or more: 281
- Mobile homes: 493
Median worth of mobile homes: $52,394
Housing units lacking complete kitchen facilities in 2022: 6.4%
House/condo owner moved in on average 12 years ago
Renter moved in on average 4 years ago

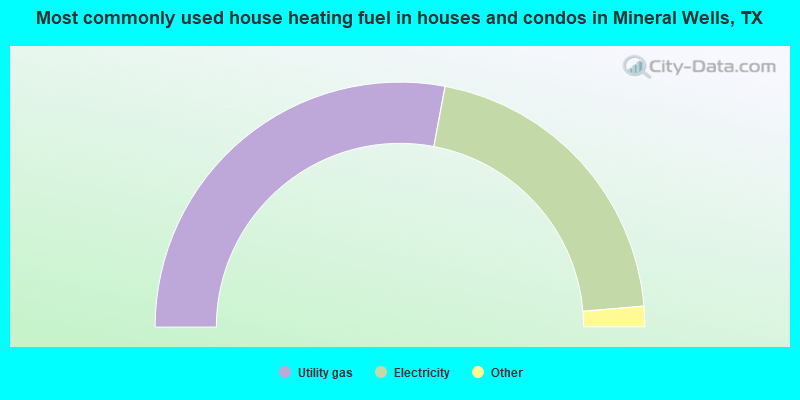
- 55.9%Utility gas
- 41.4%Electricity
- 2.2%Bottled, tank, or LP gas
- 0.3%No fuel used
- 0.1%Wood
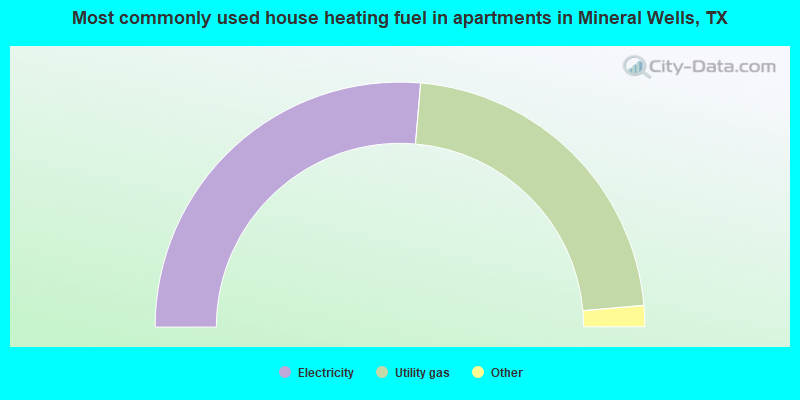
- 52.7%Electricity
- 44.5%Utility gas
- 2.2%No fuel used
- 0.6%Bottled, tank, or LP gas
Private vs. public school enrollment:
| Here: | 8.8% |
| Texas: | 8.8% |
| Here: | 10.6% |
| Texas: | 8.0% |
| Here: | 21.1% |
| Texas: | 16.2% |


