Minot, ND (North Dakota) Houses and Residents
Estimated median house or condo value in 2022: $233,862 (it was $74,900 in 2000 )
Minot:
$233,862North Dakota:
$243,100
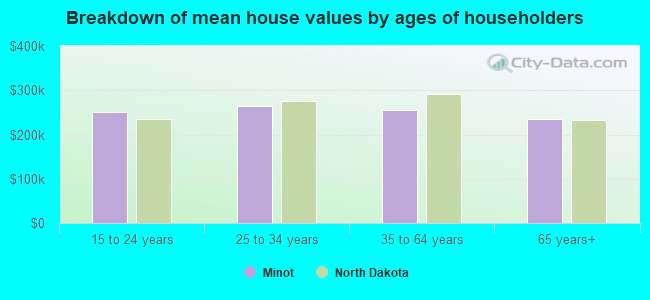
Lower value quartile - upper value quartile: $149,728 - $314,945Mean price in 2022: Detached houses: $304,790 Here:
$304,790State:
$284,144
Townhouses or other attached units: $261,234 Here:
$261,234State:
$250,572
In 2-unit structures: $607,321 Here:
$607,321State:
$200,034
In 3-to-4-unit structures: $191,444 Here:
$191,444State:
$229,360
In 5-or-more-unit structures: $272,572 Here:
$272,572State:
$231,934
Mobile homes: $42,928 Here:
$42,928State:
$85,388
Total population: 47,997 (Urban population: 36,477 (all inside urban clusters), Rural population: 103 (all nonfarm) )
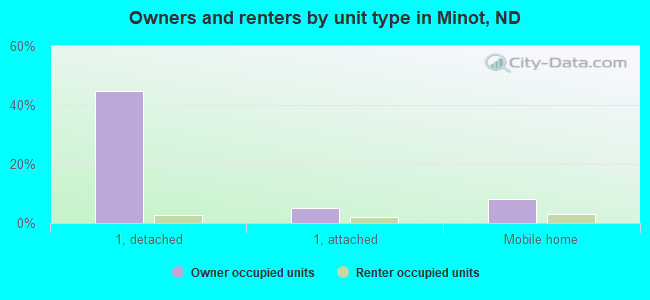
Houses: 23,861 (21,295 occupied: 12,380 owner occupied, 9,489 renter occupied )
% of renters here:
43%State:
35%
Housing density: 1,640 houses/condos per square mile
Median price asked for vacant for-sale houses and condos in 2022: $137,210.
Median contract rent in 2022: $774 (lower quartile is $561, upper quartile is $861)
Median rent asked for vacant for-rent units in 2022: $1,293
Median gross rent in Minot, ND in 2022: $863
Housing units in Minot with a mortgage: 8,259 (500 second mortgage, 0 home equity loan, 246 both second mortgage and home equity loan )Houses without a mortgage: 87
Median household income for houses/condos with a mortgage: $100,805
Median household income for apartments without a mortgage: $74,654
Median monthly housing costs: $989
Data:
Median house or condo value ($)
Median house or condo value ($ change since 2000)
Median house or condo value ($) - White
Median house or condo value ($) - Black or African American
Median house or condo value ($) - Asian
Median house or condo value ($) - Hispanic or Latino
Median house or condo value ($) - American Indian and Alaska Native
Median house or condo value ($) - Multirace
Median house or condo value ($) - Other Race
Median price asked for mobile homes ($)
Household density (households per square mile)
Mean house or condo value by units in structure - 1, detached ($)
Mean house or condo value by units in structure - 1, attached ($)
Mean house or condo value by units in structure - 2 ($)
Mean house or condo value by units in structure by units in structure - 3 or 4 ($)
Mean house or condo value by units in structure - 5 or more ($)
Mean house or condo value by units in structure - Boat, RV, van, etc. ($)
Mean house or condo value by units in structure - Mobile home ($)
Median contract rent ($)
Median contract rent - Lower quartile ($)
Median contract rent - Upper quartile ($)
Median gross rent ($)
Urban houses (%)
Rural houses (%)
Houses occupied (%)
Houses occupied (% change since 2000)
Houses owner occupied (%)
Houses owner occupied (% change since 2000)
Houses renter occupied (%)
Houses renter occupied (% change since 2000)
Vacant housing units - For rent (%)
Vacant housing units - For rent (% change since 2000)
Vacant housing units - For sale only (%)
Vacant housing units - For sale only (% change since 2000)
Vacant housing units - Rented or sold, not occupied (%)
Vacant housing units - Rented or sold, not occupied (% change since 2000)
Vacant housing units - For seasonal, recreational, or occasional use (%)
Vacant housing units - For seasonal, recreational, or occasional use (% change since 2000)
Vacant housing units - For migrant workers (%)
Vacant housing units - For migrant workers (% change since 2000)
Vacant housing units - Other vacant (%)
Vacant housing units - Other vacant (% change since 2000)
Median monthly housing costs ($)
Median household income for houses/condos with a mortgage ($)
Median household income for houses/condos without a mortgage ($)
Median household income ($)
Median household income ($) - White
Median household income ($) - Black or African American
Median household income ($) - Asian
Median household income ($) - Hispanic or Latino
Median household income ($) - American Indian and Alaska Native
Median household income ($) - Multirace
Median household income ($) - Other Race
Mortgage status - with mortgage (%)
Mortgage status - with second mortgage (%)
Mortgage status - with home equity loan (%)
Mortgage status - with both second mortgage and home equity loan (%)
Mortgage status - without a mortgage (%)
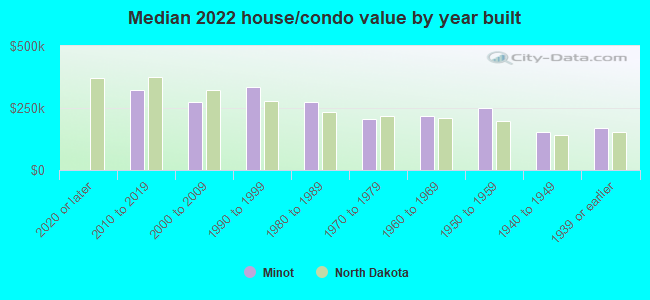
Median year house/condo built
Median year apartment built
Household type by relationship - Male householder living alone (%)
Household type by relationship - Male householder not living alone (%)
Household type by relationship - Female householder living alone (%)
Household type by relationship - Female householder not living alone (%)
Household type by relationship - Opposite-Sex spouse (%)
Household type by relationship - Same-Sex spouse (%)
Household type by relationship - Opposite-Sex unmarried partner (%)
Household type by relationship - Same-Sex unmarried partner (%)
Household type by relationship - In group quarters (%)
Size of family households - 2-person household (%)
Size of family households - 3-person household (%)
Size of family households - 4-person household (%)
Size of family households - 5-person household (%)
Size of family households - 6-person household (%)
Size of family households - 7-or-more-person household (%)
Size of nonfamily households - 1-person household (%)
Size of nonfamily households - 2-person household (%)
Size of nonfamily households - 3-person household (%)
Size of nonfamily households - 4-person household (%)
Size of nonfamily households - 5-person household (%)
Size of nonfamily households - 6-person household (%)
Size of nonfamily households - 7-or-moreperson household (%)
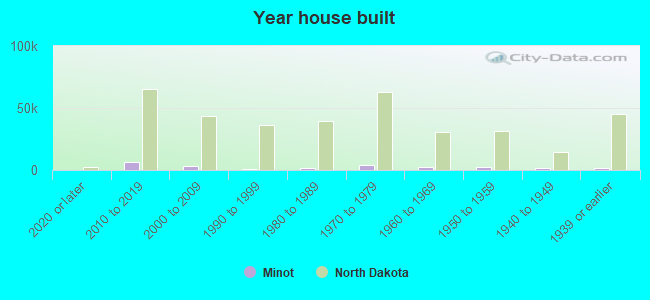
Year house built - Built 2010 or later (%)
Year house built - Built 2000 to 2009 (%)
Year house built - Built 1990 to 1999 (%)
Year house built - Built 1980 to 1989 (%)
Year house built - Built 1970 to 1979 (%)
Year house built - Built 1960 to 1969 (%)
Year house built - Built 1950 to 1959 (%)
Year house built - Built 1940 to 1949 (%)
Year house built - Built 1939 or earlier (%)
Median number of rooms in houses and condos
Median number of rooms in apartments
Median number of bedrooms in owner occupied houses
Mean number of bedrooms in owner occupied houses
Median number of bedrooms in renter occupied houses
Mean number of bedrooms in renter occupied houses
Median number of vehichles in owner occupied houses
Mean number of vehichles in owner occupied houses
Median number of vehichles in renter occupied houses
Mean number of vehichles in renter occupied houses
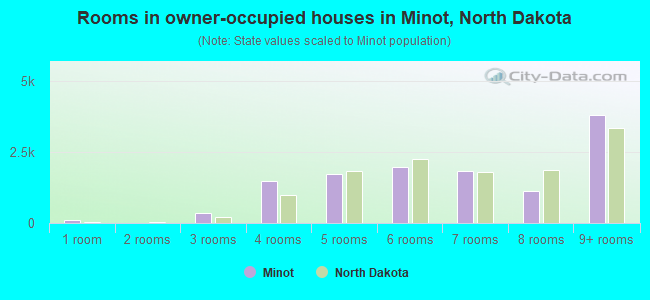
Rooms in owner-occupied houses - 1 room (%)
Rooms in owner-occupied houses - 2 rooms (%)
Rooms in owner-occupied houses - 3 rooms (%)
Rooms in owner-occupied houses - 4 rooms (%)
Rooms in owner-occupied houses - 5 rooms (%)
Rooms in owner-occupied houses - 6 rooms (%)
Rooms in owner-occupied houses - 7 rooms (%)
Rooms in owner-occupied houses - 8 rooms (%)
Rooms in owner-occupied houses - 9+ rooms (%)
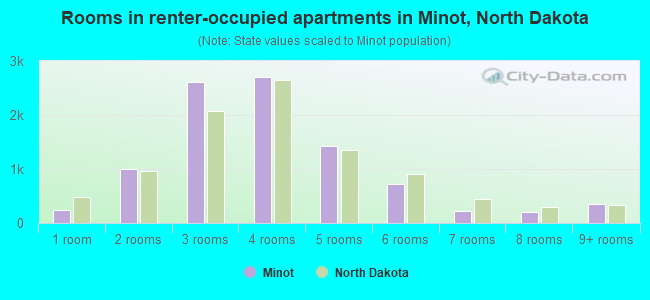
Rooms in renter-occupied houses - 1 room (%)
Rooms in renter-occupied houses - 2 rooms (%)
Rooms in renter-occupied houses - 3 rooms (%)
Rooms in renter-occupied houses - 4 rooms (%)
Rooms in renter-occupied houses - 5 rooms (%)
Rooms in renter-occupied houses - 6 rooms (%)
Rooms in renter-occupied houses - 7 rooms (%)
Rooms in renter-occupied houses - 8 rooms (%)
Rooms in renter-occupied houses - 9+ rooms (%)
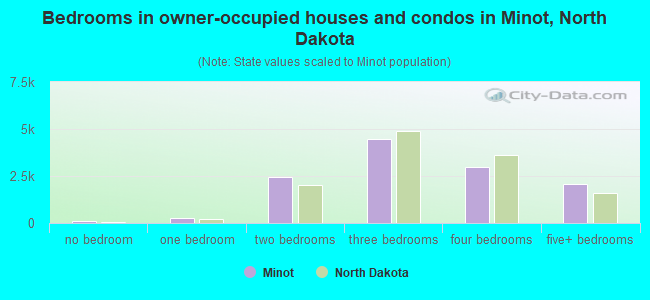
Bedrooms in owner-occupied houses - no bedrooms (%)
Bedrooms in owner-occupied houses - 1 bedroom (%)
Bedrooms in owner-occupied houses - 2 bedrooms (%)
Bedrooms in owner-occupied houses - 3 bedrooms (%)
Bedrooms in owner-occupied houses - 4 bedrooms (%)
Bedrooms in owner-occupied houses - 5+ bedrooms (%)
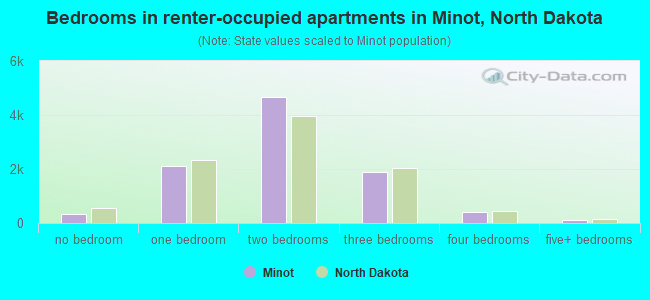
Bedrooms in renter-occupied houses - no bedrooms (%)
Bedrooms in renter-occupied houses - 1 bedroom (%)
Bedrooms in renter-occupied houses - 2 bedrooms (%)
Bedrooms in renter-occupied houses - 3 bedrooms (%)
Bedrooms in renter-occupied houses - 4 bedrooms (%)
Bedrooms in renter-occupied houses - 5+ bedrooms (%)
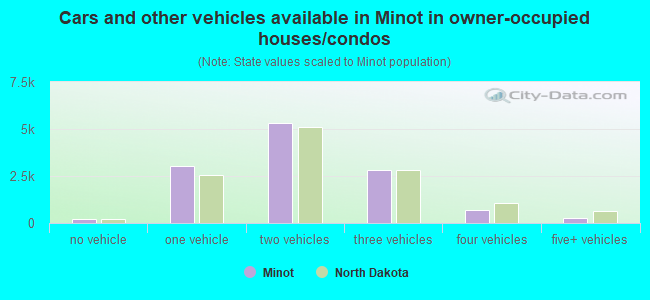
Vehicles available in owner-occupied houses - no vehicle available (%)
Vehicles available in owner-occupied houses - 1 vehicle available(%)
Vehicles available in owner-occupied houses - 2 Vehicles available (%)
Vehicles available in owner-occupied houses - 3 Vehicles available (%)
Vehicles available in owner-occupied houses - 4 Vehicles available (%)
Vehicles available in owner-occupied houses - 5+ Vehicles available (%)
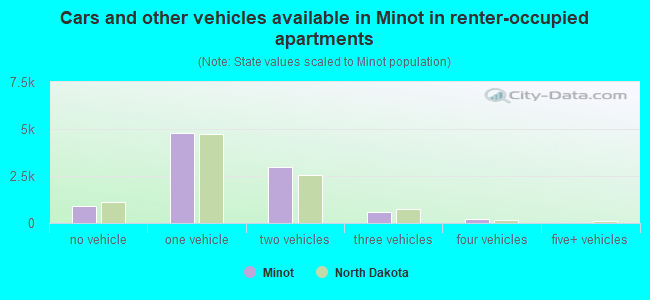
Vehicles available in renter-occupied houses - no vehicle available (%)
Vehicles available in renter-occupied houses - 1 vehicle available (%)
Vehicles available in renter-occupied houses - 2 Vehicles available (%)
Vehicles available in renter-occupied houses - 3 Vehicles available (%)
Vehicles available in renter-occupied houses - 4 Vehicles available (%)
Vehicles available in renter-occupied houses - 5+ Vehicles available (%)
Housing units in structures - 1, detached (%)
Housing units in structures - 1, attached (%)
Housing units in structures - 2 (%)
Housing units in structures - 3 or 4 (%)
Housing units in structures - 5 to 9 (%)
Housing units in structures - 10 to 19 (%)
Housing units in structures - 20 to 49 (%)
Housing units in structures - 50 or more (%)
Housing units in structures - Mobile home (%)
Housing units in structures - Boat, RV, van, etc. (%)
Housing units in structures - Owners - 1, detached (%)
Housing units in structures - Owners - 1, attached (%)
Housing units in structures - Owners - 2 (%)
Housing units in structures - Owners - 3 or 4 (%)
Housing units in structures - Owners - 5 to 9 (%)
Housing units in structures - Owners - 10 to 19 (%)
Housing units in structures - Owners - 20 to 49 (%)
Housing units in structures - Owners - 50 or more (%)
Housing units in structures - Owners - Mobile home (%)
Housing units in structures - Owners - Boat, RV, van, etc. (%)
Housing units in structures - Renters - 1, detached (%)
Housing units in structures - Renters - 1, attached (%)
Housing units in structures - Renters - 2 (%)
Housing units in structures - Renters - 3 or 4 (%)
Housing units in structures - Renters - 5 to 9 (%)
Housing units in structures - Renters - 10 to 19 (%)
Housing units in structures - Renters - 20 to 49 (%)
Housing units in structures - Renters - 50 or more (%)
Housing units in structures - Renters - Mobile home (%)
Housing units in structures - Renters - Boat, RV, van, etc. (%)
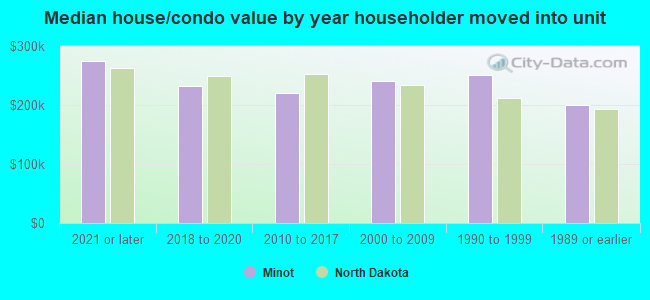
House/condo owner moved in on average (years ago)
Renter moved in on average (years ago)
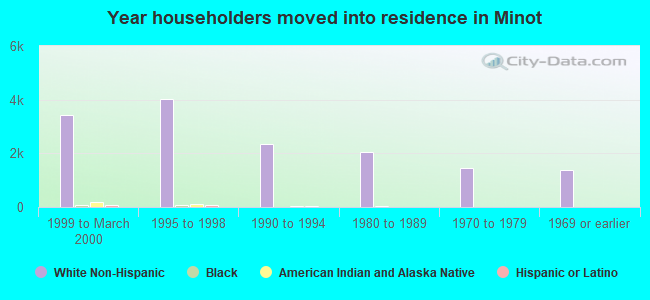
Year householder moved into unit - Moved in 1999 to March 2000 (%)
Year householder moved into unit - Moved in 1999 to March 2000 (%) - White
Year householder moved into unit - Moved in 1999 to March 2000 (%) - Black or African American
Year householder moved into unit - Moved in 1999 to March 2000 (%) - Asian
Year householder moved into unit - Moved in 1999 to March 2000 (%) - Hispanic or Latino
Year householder moved into unit - Moved in 1999 to March 2000 (%) - American Indian and Alaska Native
Year householder moved into unit - Moved in 1999 to March 2000 (%) - Multirace
Year householder moved into unit - Moved in 1999 to March 2000 (%) - Other Race
Year householder moved into unit - Moved in 1995 to 1998 (%)
Year householder moved into unit - Moved in 1995 to 1998 (%) - White
Year householder moved into unit - Moved in 1995 to 1998 (%) - Black or African American
Year householder moved into unit - Moved in 1995 to 1998 (%) - Asian
Year householder moved into unit - Moved in 1995 to 1998 (%) - Hispanic or Latino
Year householder moved into unit - Moved in 1995 to 1998 (%) - American Indian and Alaska Native
Year householder moved into unit - Moved in 1995 to 1998 (%) - Multirace
Year householder moved into unit - Moved in 1995 to 1998 (%) - Other Race
Year householder moved into unit - Moved in 1990 to 1994 (%)
Year householder moved into unit - Moved in 1990 to 1994 (%) - White
Year householder moved into unit - Moved in 1990 to 1994 (%) - Black or African American
Year householder moved into unit - Moved in 1990 to 1994 (%) - Asian
Year householder moved into unit - Moved in 1990 to 1994 (%) - Hispanic or Latino
Year householder moved into unit - Moved in 1990 to 1994 (%) - American Indian and Alaska Native
Year householder moved into unit - Moved in 1990 to 1994 (%) - Multirace
Year householder moved into unit - Moved in 1990 to 1994 (%) - Other Race
Year householder moved into unit - Moved in 1980 to 1989 (%)
Year householder moved into unit - Moved in 1980 to 1989 (%) - White
Year householder moved into unit - Moved in 1980 to 1989 (%) - Black or African American
Year householder moved into unit - Moved in 1980 to 1989 (%) - Asian
Year householder moved into unit - Moved in 1980 to 1989 (%) - Hispanic or Latino
Year householder moved into unit - Moved in 1980 to 1989 (%) - American Indian and Alaska Native
Year householder moved into unit - Moved in 1980 to 1989 (%) - Multirace
Year householder moved into unit - Moved in 1980 to 1989 (%) - Other Race
Year householder moved into unit - Moved in 1970 to 1979 (%)
Year householder moved into unit - Moved in 1970 to 1979 (%) - White
Year householder moved into unit - Moved in 1970 to 1979 (%) - Black or African American
Year householder moved into unit - Moved in 1970 to 1979 (%) - Asian
Year householder moved into unit - Moved in 1970 to 1979 (%) - Hispanic or Latino
Year householder moved into unit - Moved in 1970 to 1979 (%) - American Indian and Alaska Native
Year householder moved into unit - Moved in 1970 to 1979 (%) - Multirace
Year householder moved into unit - Moved in 1970 to 1979 (%) - Other Race
Year householder moved into unit - Moved in 1969 or earlier (%)
Year householder moved into unit - Moved in 1969 or earlier (%) - White
Year householder moved into unit - Moved in 1969 or earlier (%) - Black or African American
Year householder moved into unit - Moved in 1969 or earlier (%) - Asian
Year householder moved into unit - Moved in 1969 or earlier (%) - Hispanic or Latino
Year householder moved into unit - Moved in 1969 or earlier (%) - American Indian and Alaska Native
Year householder moved into unit - Moved in 1969 or earlier (%) - Multirace
Year householder moved into unit - Moved in 1969 or earlier (%) - Other Race
Housing units lacking complete plumbing facilities (%)
Housing units lacking complete kitchen facilities (%)
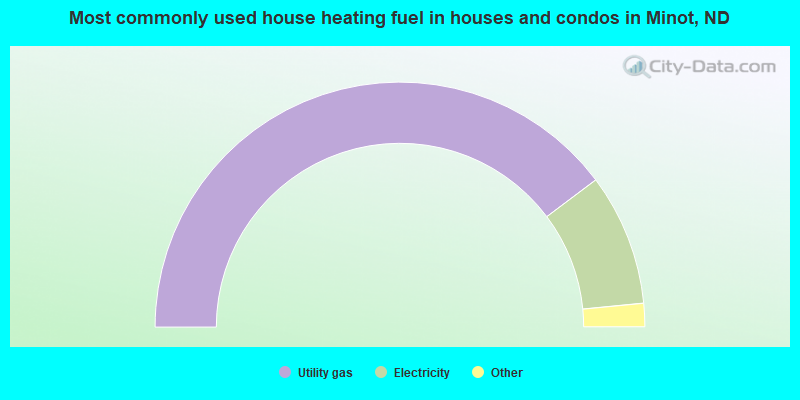
House heating fuel used in houses and condos - Utility gas (%)
House heating fuel used in houses and condos - Bottled, tank, or LP gas (%)
House heating fuel used in houses and condos - Electricity (%)
House heating fuel used in houses and condos - Fuel oil, kerosene, etc. (%)
House heating fuel used in houses and condos - Coal or coke (%)
House heating fuel used in houses and condos - Wood (%)
House heating fuel used in houses and condos - Solar energy (%)
House heating fuel used in houses and condos - Other fuel (%)
House heating fuel used in houses and condos - No fuel used (%)
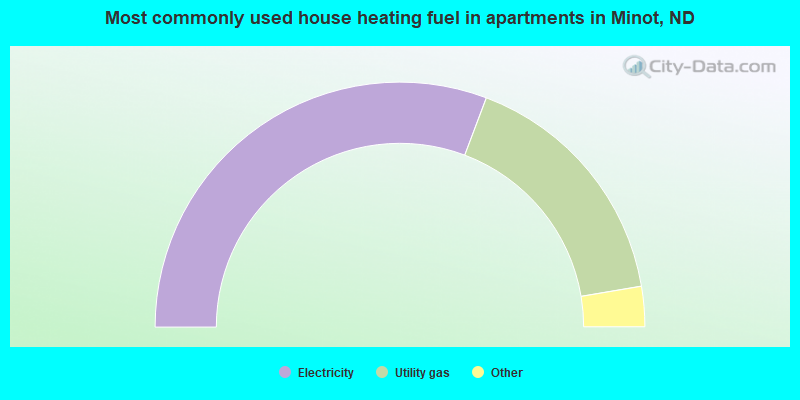
House heating fuel used in apartments - Utility gas (%)
House heating fuel used in apartments - Bottled, tank, or LP gas (%)
House heating fuel used in apartments - Electricity (%)
House heating fuel used in apartments - Fuel oil, kerosene, etc. (%)
House heating fuel used in apartments - Coal or coke (%)
House heating fuel used in apartments - Wood (%)
House heating fuel used in apartments - Solar energy (%)
House heating fuel used in apartments - Other fuel (%)
House heating fuel used in apartments - No fuel used (%)
Latest news about housing in Minot, ND collected exclusively by city-data.com from local newspapers, TV, and radio stations
Median year house/condo built: 1975Median year apartment built: 2006Household type by relationship:
Households: 47,580
Male householders: 12,350 (4,297 living alone ), Female householders: 8,609 (3,448 living alone )8,640 spouses (8,555 opposite-sex spouses ), 1,804 unmarried partners , (1,793 opposite-sex unmarried partners ), 11,565 children (10,804 natural , 181 adopted , 580 stepchildren ), 676 grandchildren , 391 brothers or sisters , 201 parents , 30 foster children , 522 other relatives , 1,495 non-relatives In group quarters: 1,291
Size of family households: 5,066 2-persons , 2,642 3-persons , 1,729 4-persons , 1,205 5-persons , 160 6-persons , 156 7-or-more-persons .
Size of nonfamily households: 8,213 1-person , 1,943 2-persons , 491 3-persons , 30 4-persons , 31 6-persons .
7,517 married couples with children. single-parent households (691 men , 1,391 women ).
92.9% of residents of Minot speak English at home. of residents speak Spanish at home (63% speak English very well , 23% speak English well , 14% speak English not well ).of residents speak other Indo-European language at home (92% speak English very well , 7% speak English well , 1% speak English not well ).of residents speak Asian or Pacific Island language at home (75% speak English very well , 20% speak English well , 5% speak English not well ).of residents speak other language at home (44% speak English very well , 19% speak English well , 37% speak English not well ).
Foreign born population: 2,765 (5.8%)of them are naturalized citizens )
Median number of rooms in houses and condos:
Median number of rooms in apartments
Owner-occupied Renter-occupied
Rooms in owner-occupied houses in Minot, North Dakota
122 1 room 9 2 rooms 341 3 rooms 1,462 4 rooms 1,736 5 rooms 1,980 6 rooms 1,815 7 rooms 1,110 8 rooms 3,804 9+ rooms
Rooms in renter-occupied apartments in Minot, North Dakota
245 1 room 1,009 2 rooms 2,607 3 rooms 2,711 4 rooms 1,431 5 rooms 717 6 rooms 214 7 rooms 199 8 rooms 357 9+ rooms
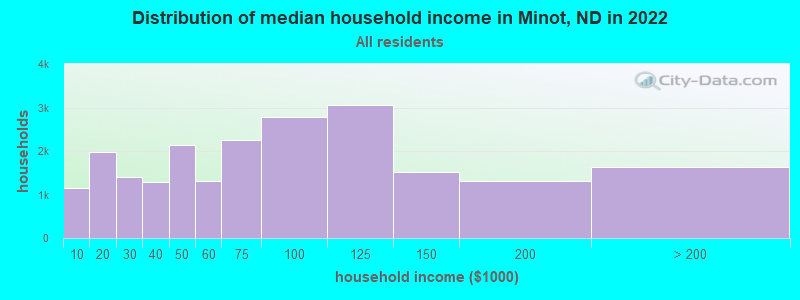
Minot, ND household income distribution 1,160 Less than $10,0001,974 $10,000 to $19,9991,413 $20,000 to $29,9991,293 $30,000 to $39,9992,141 $40,000 to $49,9991,312 $50,000 to $59,9992,245 $60,000 to $74,9992,788 $75,000 to $99,9993,046 $100,000 to $124,9991,512 $125,000 to $149,9991,307 $150,000 to $199,9991,634 $200,000 or more
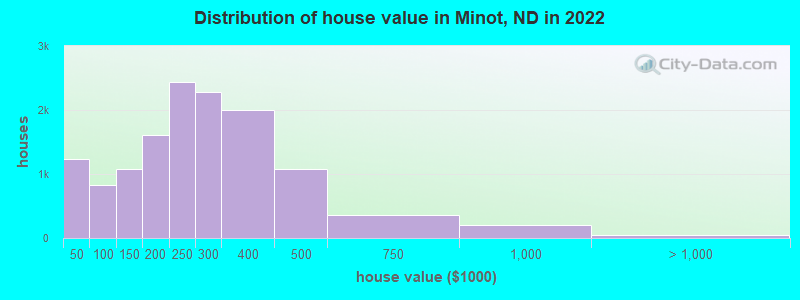
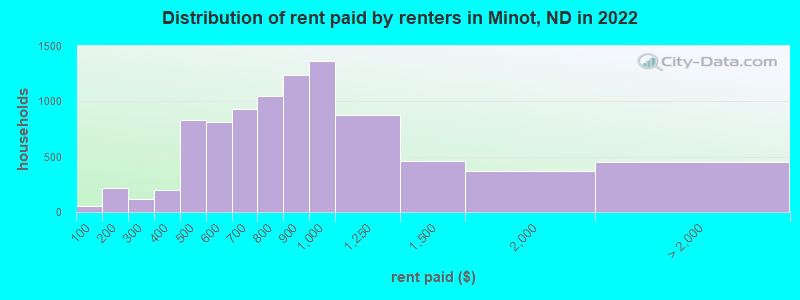
Home value of owner - occupied houses in 2022 in Minot, ND 466 Less than $10,000181 $10,000 to $14,99981 $15,000 to $19,999318 $20,000 to $24,99925 $25,000 to $29,99956 $30,000 to $34,9991 $35,000 to $39,999105 $40,000 to $49,999198 $50,000 to $59,999184 $60,000 to $69,99978 $70,000 to $79,99993 $80,000 to $89,999172 $90,000 to $99,999677 $100,000 to $124,999396 $125,000 to $149,999743 $150,000 to $174,999863 $175,000 to $199,9992,432 $200,000 to $249,9992,289 $250,000 to $299,9992,003 $300,000 to $399,9991,079 $400,000 to $499,999360 $500,000 to $749,999202 $750,000 to $999,99916 $1,000,000 to $1,499,99931 $2,000,000 or moreRent paid by renters in 2022 in Minot, ND 57 Less than $100183 $100 to $14931 $150 to $19955 $200 to $24960 $250 to $299154 $300 to $34947 $350 to $399253 $400 to $449572 $450 to $499420 $500 to $549390 $550 to $599364 $600 to $649570 $650 to $699302 $700 to $749747 $750 to $7991,235 $800 to $8991,362 $900 to $999875 $1,000 to $1,249460 $1,250 to $1,499368 $1,500 to $1,99982 $2,000 to $2,49924 $2,500 to $2,999104 $3,500 or more239 No cash rent
Percentage of workers working in this county: 89.6%Number of people working at home: 1,453 (5.3% of all workers )
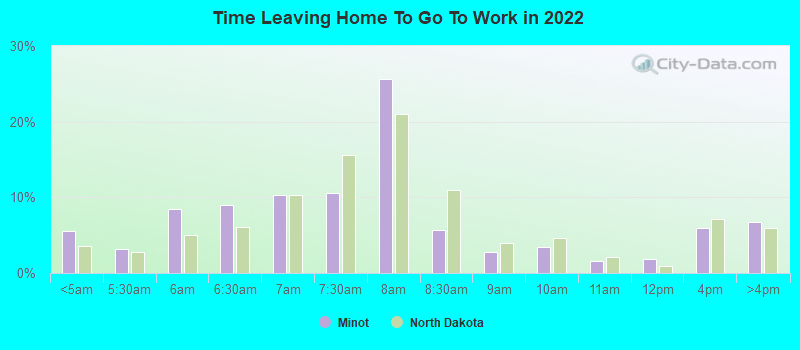
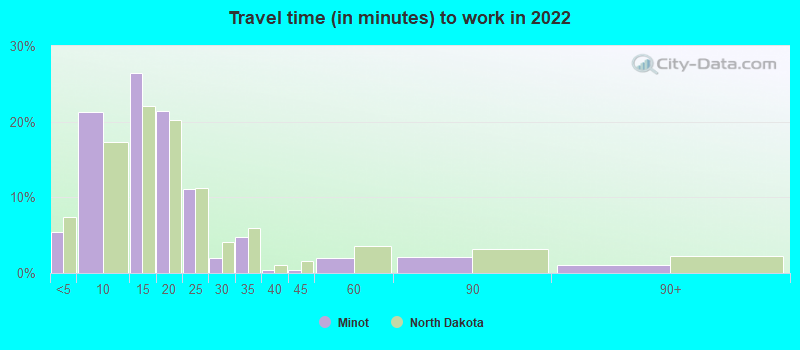
Travel time to work (commute)
Less than 5 minutes: 1,1815 to 9 minutes: 5,18910 to 14 minutes: 6,15715 to 19 minutes: 4,82620 to 24 minutes: 3,12525 to 29 minutes: 56430 to 34 minutes: 1,74935 to 39 minutes: 13640 to 44 minutes: 8245 to 59 minutes: 37060 to 89 minutes: 75490 or more minutes: 1,234
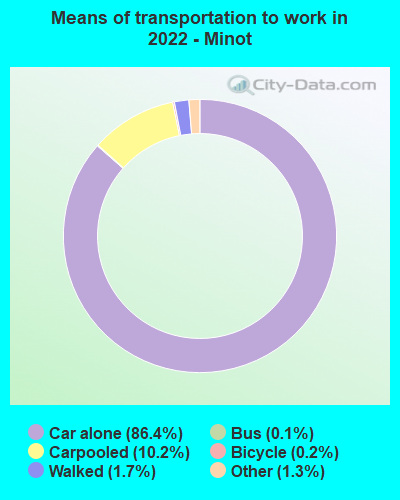
Means of transportation to work:
Drove a car alone: 20,773 (81.0%)Carpooled: 2,564 (10.0%)Bus : 20 (0.1%)Long-distance train or commuter rail : 9 (0.0%)Taxi: 246 (1.0%)Bicycle: 66 (0.3%)Walked: 457 (1.8%)Worked at home: 1,453 (5.7%)
Unemployment by race in 2022
Unemployment rate for White non-Hispanic residents 2.3% Males3.2% FemalesUnemployment rate for Black residents 5.8% Males6.7% FemalesUnemployment rate for American Indian and Alaska Native residents 3.3% Males10.3% FemalesUnemployment rate for other race residents 8.0% Males7.2% FemalesUnemployment rate for two or more race residents 1.1% Males5.0% FemalesUnemployment rate for Hispanic or Latino residents 3.2% Males14.7% Females
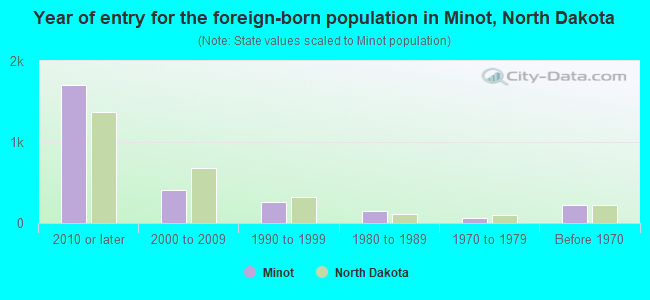
Year of entry for the foreign-born population in Minot, North Dakota
1,706 2010 or later 411 2000 to 2009 263 1990 to 1999 143 1980 to 1989 58 1970 to 1979 223 Before 1970
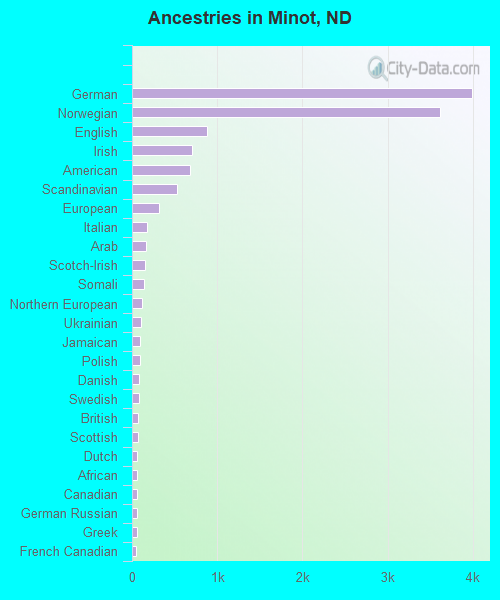
First ancestries reported:
German: 3,991 (22.1%)
Norwegian: 3,617 (20.1%)
English: 877 (4.9%)
Irish: 706 (3.9%)
American: 684 (3.8%)
Scandinavian: 523 (2.9%)
European: 314 (1.7%)
Italian: 173 (1.0%)
Arab: 167 (0.9%)
Scotch-Irish: 147 (0.8%)
Somali: 135 (0.7%)
Northern European: 123 (0.7%)
Ukrainian: 111 (0.6%)
Jamaican: 94 (0.5%)
Polish: 90 (0.5%)
Danish: 84 (0.5%)
Swedish: 79 (0.4%)
British: 69 (0.4%)
Scottish: 68 (0.4%)
Dutch: 60 (0.3%)
African: 58 (0.3%)
Canadian: 57 (0.3%)
German Russian: 55 (0.3%)
Greek: 55 (0.3%)
French Canadian: 47 (0.3%)
Lithuanian: 38 (0.2%)
Russian: 34 (0.2%)
Liberian: 34 (0.2%)
Romanian: 30 (0.2%)
Finnish: 28 (0.2%)
French: 24 (0.1%)
Hungarian: 22 (0.1%)
Nigerian: 19 (0.1%)
Lebanese: 18 (0.10%)
Icelander: 18 (0.10%)
Czech: 16 (0.09%)
Swiss: 14 (0.08%)
Belgian: 13 (0.07%)
Welsh: 11 (0.06%)
Haitian: 2 (0.01%) Most common places of birth for foreign-born residents (%): Philippines Minot:
11.6% (279)North Dakota:
6.9% (2,472)
Canada Minot:
10.5% (251)North Dakota:
8.7% (3,118)
Pakistan Minot:
6.6% (159)North Dakota:
1.0% (353)
Mexico Minot:
6.5% (156)North Dakota:
8.0% (2,889)
Cameroon Minot:
6.2% (148)North Dakota:
0.7% (240)
Somalia Minot:
6.0% (143)North Dakota:
4.2% (1,514)
Nepal Minot:
3.9% (94)North Dakota:
3.0% (1,073)
Japan Minot:
3.7% (88)North Dakota:
1.3% (464)
England Minot:
3.6% (87)North Dakota:
0.6% (217)
Chile Minot:
3.0% (72)North Dakota:
0.2% (88)
Liberia Minot:
2.8% (67)North Dakota:
8.6% (3,094)
Indonesia Minot:
2.7% (64)North Dakota:
0.2% (66)
China, excluding Hong Kong and Taiwan Minot:
2.6% (63)North Dakota:
2.2% (778)
Africa, n.e.c. Minot:
2.3% (54)North Dakota:
1.3% (456)
Egypt Minot:
2.2% (52)North Dakota:
0.6% (206)
Cuba Minot:
2.0% (49)North Dakota:
0.2% (60)
Senegal Minot:
1.9% (46)North Dakota:
0.2% (68)
Other South Central Asia Minot:
1.8% (43)North Dakota:
0.1% (39)
Syria Minot:
1.8% (42)North Dakota:
0.6% (225)
Saudi Arabia Minot:
1.8% (42)North Dakota:
0.3% (122)
Thailand Minot:
1.7% (41)North Dakota:
0.8% (271)
Germany Minot:
1.7% (40)North Dakota:
2.1% (740)
Nigeria Minot:
1.5% (37)North Dakota:
3.0% (1,068)
Place of birth for U.S.-born residents:
This state: 24,704Other state: 18,582Northeast: 1,985Midwest: 5,755South: 4,332West: 6,361 79.3% of Minot residents lived in the same house 1 years ago.
Out of people who lived in different houses, 37.0% lived in this county.
Out of people who lived in different counties, 50.0% lived in North Dakota.
Minot:
79.3%State average:
84.2%
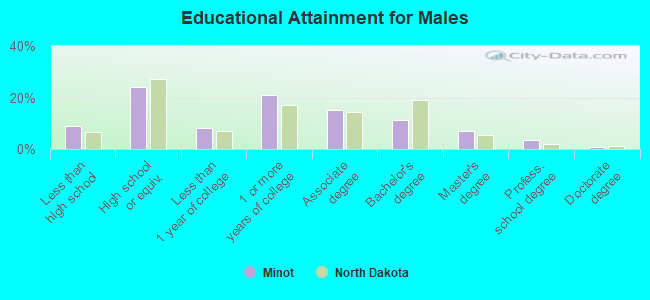
Education attainment for males 25 years and older:
No schooling: 594Nursery to 4th grade: 05th and 6th grade: 77th and 8th grade: 2019th grade: 9610th grade: 16811th grade: 8912th grade, no diploma: 336High school graduate (or equivalency): 3,923Less than 1 year of college: 1,356Some college more than 1 year, no degree: 3,471Associate degree: 2,480Bachelor's degree: 1,877Master's degree: 1,140Professional school degree: 573Doctorate degree: 104
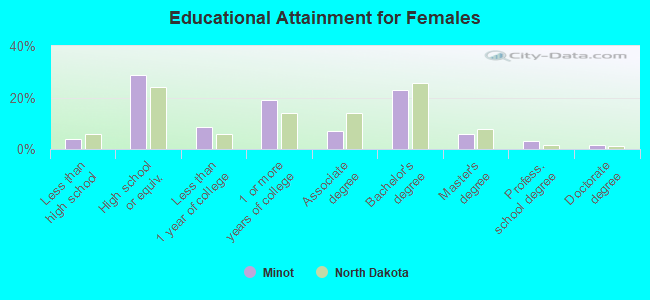
Education attainment for females 25 years and older:
No schooling: 107Nursery to 4th grade: 335th and 6th grade: 667th and 8th grade: 1189th grade: 6110th grade: 6211th grade: 3612th grade, no diploma: 122High school graduate (or equivalency): 4,555Less than 1 year of college: 1,334Some college more than 1 year, no degree: 2,997Associate degree: 1,112Bachelor's degree: 3,610Master's degree: 903Professional school degree: 499Doctorate degree: 249
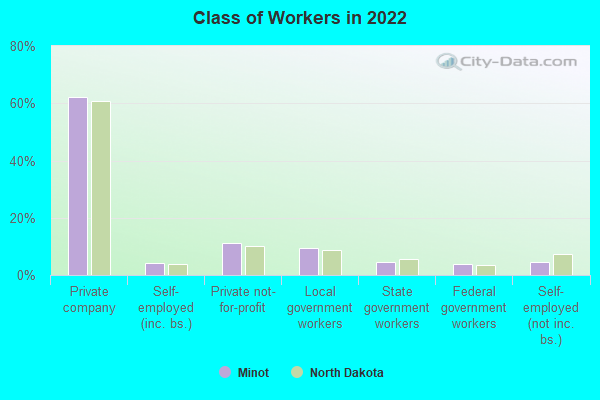
Housing units in structures:
One, detached: 11,122One, attached: 1,707Two: 5663 or 4: 1,4725 to 9: 92910 to 19: 1,61720 to 49: 2,86650 or more: 1,638Mobile homes: 1,940Median worth of mobile homes: $17,095
Housing units lacking complete plumbing facilities in 2022: 1.5%Housing units lacking complete kitchen facilities in 2022: 0.5%House/condo owner moved in on average 8 years ago
Renter moved in on average 1 years ago
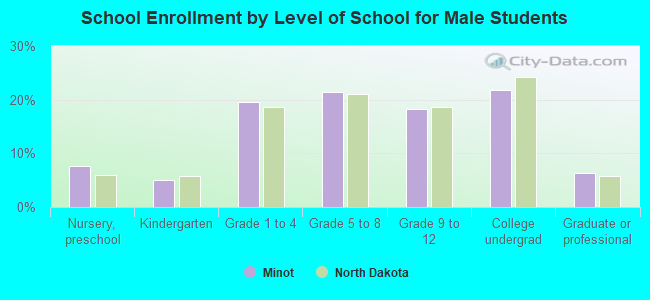
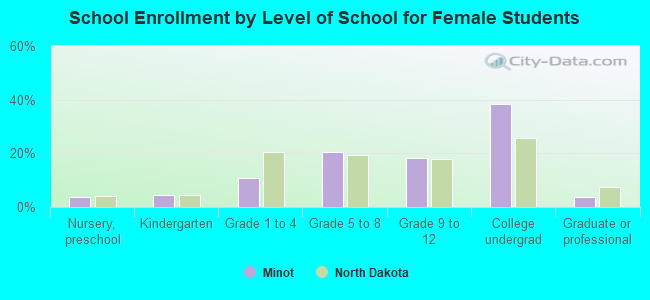
Private vs. public school enrollment:
Students in private schools in grades 1 to 8 (elementary and middle school): 314 Here:
7.5%North Dakota:
8.4%
Students in private schools in grades 9 to 12 (high school): 471 Here:
22.8%North Dakota:
8.2%
Students in private undergraduate colleges: 233 Here:
6.8%North Dakota:
14.3%