Mira Monte, CA (California) Houses and Residents
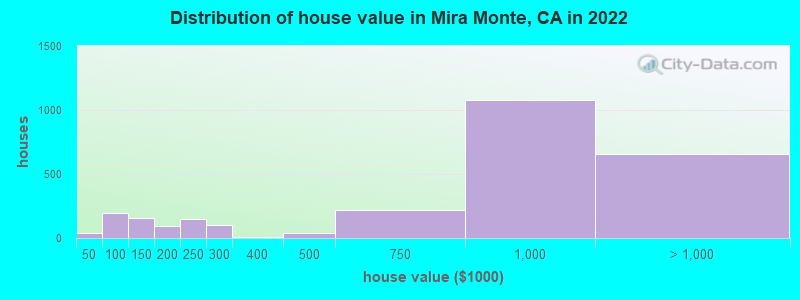
Estimated median house or condo value in 2022: $879,130 (it was $238,200 in 2000 )
Mira Monte:
$879,130California:
$715,900
Lower value quartile - upper value quartile: $270,808 - $1,017,669Mean price in 2022: Detached houses: $1,220,444 Here:
$1,220,444State:
$988,808
Townhouses or other attached units: $1,090,462 Here:
$1,090,462State:
$838,546
Mobile homes: $254,035 Here:
$254,035State:
$184,506
Total population: 6,854 (Urban population: 6,334, Rural population: 581 (all nonfarm) )
Houses: 3,102 (2,863 occupied: 2,471 owner occupied, 397 renter occupied )
% of renters here:
14%State:
44%
Housing density: 737 houses/condos per square mile
Median price asked for vacant for-sale houses and condos in 2022 in this county: $1,328,053.
Median contract rent in 2022: $1,872 (lower quartile is $1,210, upper quartile is over $2,000)
Median rent asked for vacant for-rent units in 2022: $1,515
Median gross rent in Mira Monte, CA in 2022: $1,878
Housing units in Mira Monte with a mortgage: 1,234 (136 second mortgage, 0 home equity loan, 126 both second mortgage and home equity loan )Houses without a mortgage: 36
Median household income for houses/condos with a mortgage: $123,436
Median household income for apartments without a mortgage: $47,756
Median monthly housing costs: $1,621
Data:
Median house or condo value ($)
Median house or condo value ($ change since 2000)
Median house or condo value ($) - White
Median house or condo value ($) - Black or African American
Median house or condo value ($) - Asian
Median house or condo value ($) - Hispanic or Latino
Median house or condo value ($) - American Indian and Alaska Native
Median house or condo value ($) - Multirace
Median house or condo value ($) - Other Race
Median price asked for mobile homes ($)
Household density (households per square mile)
Mean house or condo value by units in structure - 1, detached ($)
Mean house or condo value by units in structure - 1, attached ($)
Mean house or condo value by units in structure - 2 ($)
Mean house or condo value by units in structure by units in structure - 3 or 4 ($)
Mean house or condo value by units in structure - 5 or more ($)
Mean house or condo value by units in structure - Boat, RV, van, etc. ($)
Mean house or condo value by units in structure - Mobile home ($)
Median contract rent ($)
Median contract rent - Lower quartile ($)
Median contract rent - Upper quartile ($)
Median gross rent ($)
Urban houses (%)
Rural houses (%)
Houses occupied (%)
Houses occupied (% change since 2000)
Houses owner occupied (%)
Houses owner occupied (% change since 2000)
Houses renter occupied (%)
Houses renter occupied (% change since 2000)
Vacant housing units - For rent (%)
Vacant housing units - For rent (% change since 2000)
Vacant housing units - For sale only (%)
Vacant housing units - For sale only (% change since 2000)
Vacant housing units - Rented or sold, not occupied (%)
Vacant housing units - Rented or sold, not occupied (% change since 2000)
Vacant housing units - For seasonal, recreational, or occasional use (%)
Vacant housing units - For seasonal, recreational, or occasional use (% change since 2000)
Vacant housing units - For migrant workers (%)
Vacant housing units - For migrant workers (% change since 2000)
Vacant housing units - Other vacant (%)
Vacant housing units - Other vacant (% change since 2000)
Median monthly housing costs ($)
Median household income for houses/condos with a mortgage ($)
Median household income for houses/condos without a mortgage ($)
Median household income ($)
Median household income ($) - White
Median household income ($) - Black or African American
Median household income ($) - Asian
Median household income ($) - Hispanic or Latino
Median household income ($) - American Indian and Alaska Native
Median household income ($) - Multirace
Median household income ($) - Other Race
Mortgage status - with mortgage (%)
Mortgage status - with second mortgage (%)
Mortgage status - with home equity loan (%)
Mortgage status - with both second mortgage and home equity loan (%)
Mortgage status - without a mortgage (%)
Median year house/condo built
Median year apartment built
Household type by relationship - Male householder living alone (%)
Household type by relationship - Male householder not living alone (%)
Household type by relationship - Female householder living alone (%)
Household type by relationship - Female householder not living alone (%)
Household type by relationship - Opposite-Sex spouse (%)
Household type by relationship - Same-Sex spouse (%)
Household type by relationship - Opposite-Sex unmarried partner (%)
Household type by relationship - Same-Sex unmarried partner (%)
Household type by relationship - In group quarters (%)
Size of family households - 2-person household (%)
Size of family households - 3-person household (%)
Size of family households - 4-person household (%)
Size of family households - 5-person household (%)
Size of family households - 6-person household (%)
Size of family households - 7-or-more-person household (%)
Size of nonfamily households - 1-person household (%)
Size of nonfamily households - 2-person household (%)
Size of nonfamily households - 3-person household (%)
Size of nonfamily households - 4-person household (%)
Size of nonfamily households - 5-person household (%)
Size of nonfamily households - 6-person household (%)
Size of nonfamily households - 7-or-moreperson household (%)
Year house built - Built 2010 or later (%)
Year house built - Built 2000 to 2009 (%)
Year house built - Built 1990 to 1999 (%)
Year house built - Built 1980 to 1989 (%)
Year house built - Built 1970 to 1979 (%)
Year house built - Built 1960 to 1969 (%)
Year house built - Built 1950 to 1959 (%)
Year house built - Built 1940 to 1949 (%)
Year house built - Built 1939 or earlier (%)
Median number of rooms in houses and condos
Median number of rooms in apartments
Median number of bedrooms in owner occupied houses
Mean number of bedrooms in owner occupied houses
Median number of bedrooms in renter occupied houses
Mean number of bedrooms in renter occupied houses
Median number of vehichles in owner occupied houses
Mean number of vehichles in owner occupied houses
Median number of vehichles in renter occupied houses
Mean number of vehichles in renter occupied houses
Rooms in owner-occupied houses - 1 room (%)
Rooms in owner-occupied houses - 2 rooms (%)
Rooms in owner-occupied houses - 3 rooms (%)
Rooms in owner-occupied houses - 4 rooms (%)
Rooms in owner-occupied houses - 5 rooms (%)
Rooms in owner-occupied houses - 6 rooms (%)
Rooms in owner-occupied houses - 7 rooms (%)
Rooms in owner-occupied houses - 8 rooms (%)
Rooms in owner-occupied houses - 9+ rooms (%)
Rooms in renter-occupied houses - 1 room (%)
Rooms in renter-occupied houses - 2 rooms (%)
Rooms in renter-occupied houses - 3 rooms (%)
Rooms in renter-occupied houses - 4 rooms (%)
Rooms in renter-occupied houses - 5 rooms (%)
Rooms in renter-occupied houses - 6 rooms (%)
Rooms in renter-occupied houses - 7 rooms (%)
Rooms in renter-occupied houses - 8 rooms (%)
Rooms in renter-occupied houses - 9+ rooms (%)
Bedrooms in owner-occupied houses - no bedrooms (%)
Bedrooms in owner-occupied houses - 1 bedroom (%)
Bedrooms in owner-occupied houses - 2 bedrooms (%)
Bedrooms in owner-occupied houses - 3 bedrooms (%)
Bedrooms in owner-occupied houses - 4 bedrooms (%)
Bedrooms in owner-occupied houses - 5+ bedrooms (%)
Bedrooms in renter-occupied houses - no bedrooms (%)
Bedrooms in renter-occupied houses - 1 bedroom (%)
Bedrooms in renter-occupied houses - 2 bedrooms (%)
Bedrooms in renter-occupied houses - 3 bedrooms (%)
Bedrooms in renter-occupied houses - 4 bedrooms (%)
Bedrooms in renter-occupied houses - 5+ bedrooms (%)
Vehicles available in owner-occupied houses - no vehicle available (%)
Vehicles available in owner-occupied houses - 1 vehicle available(%)
Vehicles available in owner-occupied houses - 2 Vehicles available (%)
Vehicles available in owner-occupied houses - 3 Vehicles available (%)
Vehicles available in owner-occupied houses - 4 Vehicles available (%)
Vehicles available in owner-occupied houses - 5+ Vehicles available (%)
Vehicles available in renter-occupied houses - no vehicle available (%)
Vehicles available in renter-occupied houses - 1 vehicle available (%)
Vehicles available in renter-occupied houses - 2 Vehicles available (%)
Vehicles available in renter-occupied houses - 3 Vehicles available (%)
Vehicles available in renter-occupied houses - 4 Vehicles available (%)
Vehicles available in renter-occupied houses - 5+ Vehicles available (%)
Housing units in structures - 1, detached (%)
Housing units in structures - 1, attached (%)
Housing units in structures - 2 (%)
Housing units in structures - 3 or 4 (%)
Housing units in structures - 5 to 9 (%)
Housing units in structures - 10 to 19 (%)
Housing units in structures - 20 to 49 (%)
Housing units in structures - 50 or more (%)
Housing units in structures - Mobile home (%)
Housing units in structures - Boat, RV, van, etc. (%)
Housing units in structures - Owners - 1, detached (%)
Housing units in structures - Owners - 1, attached (%)
Housing units in structures - Owners - 2 (%)
Housing units in structures - Owners - 3 or 4 (%)
Housing units in structures - Owners - 5 to 9 (%)
Housing units in structures - Owners - 10 to 19 (%)
Housing units in structures - Owners - 20 to 49 (%)
Housing units in structures - Owners - 50 or more (%)
Housing units in structures - Owners - Mobile home (%)
Housing units in structures - Owners - Boat, RV, van, etc. (%)
Housing units in structures - Renters - 1, detached (%)
Housing units in structures - Renters - 1, attached (%)
Housing units in structures - Renters - 2 (%)
Housing units in structures - Renters - 3 or 4 (%)
Housing units in structures - Renters - 5 to 9 (%)
Housing units in structures - Renters - 10 to 19 (%)
Housing units in structures - Renters - 20 to 49 (%)
Housing units in structures - Renters - 50 or more (%)
Housing units in structures - Renters - Mobile home (%)
Housing units in structures - Renters - Boat, RV, van, etc. (%)
House/condo owner moved in on average (years ago)
Renter moved in on average (years ago)
Year householder moved into unit - Moved in 1999 to March 2000 (%)
Year householder moved into unit - Moved in 1999 to March 2000 (%) - White
Year householder moved into unit - Moved in 1999 to March 2000 (%) - Black or African American
Year householder moved into unit - Moved in 1999 to March 2000 (%) - Asian
Year householder moved into unit - Moved in 1999 to March 2000 (%) - Hispanic or Latino
Year householder moved into unit - Moved in 1999 to March 2000 (%) - American Indian and Alaska Native
Year householder moved into unit - Moved in 1999 to March 2000 (%) - Multirace
Year householder moved into unit - Moved in 1999 to March 2000 (%) - Other Race
Year householder moved into unit - Moved in 1995 to 1998 (%)
Year householder moved into unit - Moved in 1995 to 1998 (%) - White
Year householder moved into unit - Moved in 1995 to 1998 (%) - Black or African American
Year householder moved into unit - Moved in 1995 to 1998 (%) - Asian
Year householder moved into unit - Moved in 1995 to 1998 (%) - Hispanic or Latino
Year householder moved into unit - Moved in 1995 to 1998 (%) - American Indian and Alaska Native
Year householder moved into unit - Moved in 1995 to 1998 (%) - Multirace
Year householder moved into unit - Moved in 1995 to 1998 (%) - Other Race
Year householder moved into unit - Moved in 1990 to 1994 (%)
Year householder moved into unit - Moved in 1990 to 1994 (%) - White
Year householder moved into unit - Moved in 1990 to 1994 (%) - Black or African American
Year householder moved into unit - Moved in 1990 to 1994 (%) - Asian
Year householder moved into unit - Moved in 1990 to 1994 (%) - Hispanic or Latino
Year householder moved into unit - Moved in 1990 to 1994 (%) - American Indian and Alaska Native
Year householder moved into unit - Moved in 1990 to 1994 (%) - Multirace
Year householder moved into unit - Moved in 1990 to 1994 (%) - Other Race
Year householder moved into unit - Moved in 1980 to 1989 (%)
Year householder moved into unit - Moved in 1980 to 1989 (%) - White
Year householder moved into unit - Moved in 1980 to 1989 (%) - Black or African American
Year householder moved into unit - Moved in 1980 to 1989 (%) - Asian
Year householder moved into unit - Moved in 1980 to 1989 (%) - Hispanic or Latino
Year householder moved into unit - Moved in 1980 to 1989 (%) - American Indian and Alaska Native
Year householder moved into unit - Moved in 1980 to 1989 (%) - Multirace
Year householder moved into unit - Moved in 1980 to 1989 (%) - Other Race
Year householder moved into unit - Moved in 1970 to 1979 (%)
Year householder moved into unit - Moved in 1970 to 1979 (%) - White
Year householder moved into unit - Moved in 1970 to 1979 (%) - Black or African American
Year householder moved into unit - Moved in 1970 to 1979 (%) - Asian
Year householder moved into unit - Moved in 1970 to 1979 (%) - Hispanic or Latino
Year householder moved into unit - Moved in 1970 to 1979 (%) - American Indian and Alaska Native
Year householder moved into unit - Moved in 1970 to 1979 (%) - Multirace
Year householder moved into unit - Moved in 1970 to 1979 (%) - Other Race
Year householder moved into unit - Moved in 1969 or earlier (%)
Year householder moved into unit - Moved in 1969 or earlier (%) - White
Year householder moved into unit - Moved in 1969 or earlier (%) - Black or African American
Year householder moved into unit - Moved in 1969 or earlier (%) - Asian
Year householder moved into unit - Moved in 1969 or earlier (%) - Hispanic or Latino
Year householder moved into unit - Moved in 1969 or earlier (%) - American Indian and Alaska Native
Year householder moved into unit - Moved in 1969 or earlier (%) - Multirace
Year householder moved into unit - Moved in 1969 or earlier (%) - Other Race
Housing units lacking complete plumbing facilities (%)
Housing units lacking complete kitchen facilities (%)
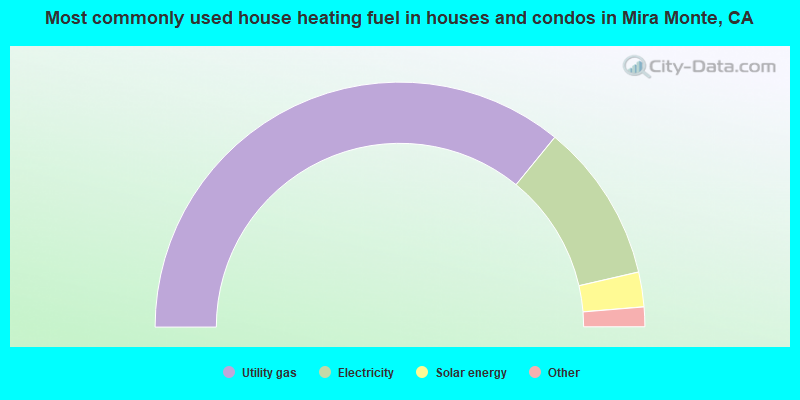
House heating fuel used in houses and condos - Utility gas (%)
House heating fuel used in houses and condos - Bottled, tank, or LP gas (%)
House heating fuel used in houses and condos - Electricity (%)
House heating fuel used in houses and condos - Fuel oil, kerosene, etc. (%)
House heating fuel used in houses and condos - Coal or coke (%)
House heating fuel used in houses and condos - Wood (%)
House heating fuel used in houses and condos - Solar energy (%)
House heating fuel used in houses and condos - Other fuel (%)
House heating fuel used in houses and condos - No fuel used (%)
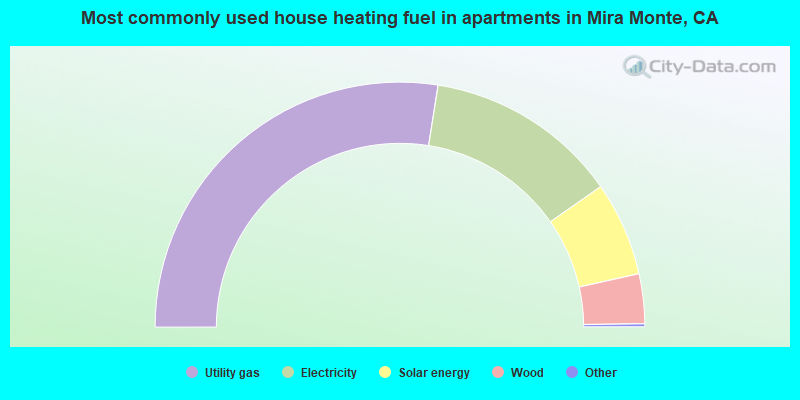
House heating fuel used in apartments - Utility gas (%)
House heating fuel used in apartments - Bottled, tank, or LP gas (%)
House heating fuel used in apartments - Electricity (%)
House heating fuel used in apartments - Fuel oil, kerosene, etc. (%)
House heating fuel used in apartments - Coal or coke (%)
House heating fuel used in apartments - Wood (%)
House heating fuel used in apartments - Solar energy (%)
House heating fuel used in apartments - Other fuel (%)
House heating fuel used in apartments - No fuel used (%)
Median year house/condo built: 1971Median year apartment built: 1974Household type by relationship:
Households: 6,760
Male householders: 1,041 (232 living alone ), Female householders: 1,765 (731 living alone )1,368 spouses (1,367 opposite-sex spouses ), 148 unmarried partners , (141 opposite-sex unmarried partners ), 1,695 children (1,607 natural , 34 adopted , 53 stepchildren ), 168 grandchildren , 47 brothers or sisters , 157 parents , 0 foster children , 13 other relatives , 294 non-relatives In group quarters: 60
Size of family households: 783 2-persons , 429 3-persons , 236 4-persons , 213 5-persons , 29 6-persons .
Size of nonfamily households: 975 1-person , 153 2-persons , 9 3-persons , 3 6-persons .
506 married couples with children. single-parent households (8 men , 151 women ).
78.6% of residents of Mira Monte speak English at home. of residents speak Spanish at home (78% speak English very well , 6% speak English well , 9% speak English not well , 7% don't speak English at all ).of residents speak other Indo-European language at home (84% speak English very well , 16% speak English well ).of residents speak Asian or Pacific Island language at home (100% speak English very well ).
Foreign born population: 828 (12.2%)of them are naturalized citizens )
Median number of rooms in houses and condos:
Median number of rooms in apartments
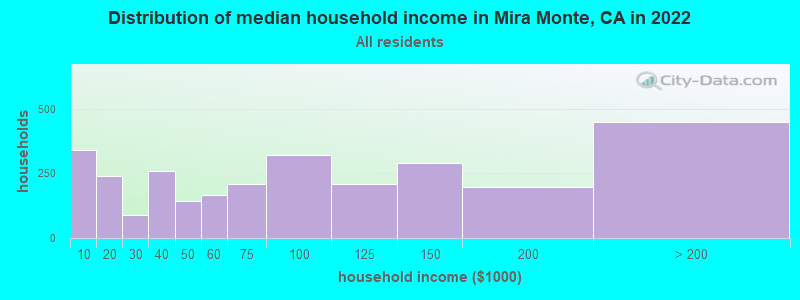
Mira Monte, CA household income distribution 339 Less than $10,000238 $10,000 to $19,99987 $20,000 to $29,999258 $30,000 to $39,999144 $40,000 to $49,999168 $50,000 to $59,999207 $60,000 to $74,999322 $75,000 to $99,999209 $100,000 to $124,999291 $125,000 to $149,999197 $150,000 to $199,999448 $200,000 or more
Home value of owner - occupied houses in 2022 in Mira Monte, CA 1 Less than $10,0003 $15,000 to $19,99932 $40,000 to $49,9998 $50,000 to $59,99910 $60,000 to $69,99964 $70,000 to $79,99938 $80,000 to $89,99938 $90,000 to $99,999125 $100,000 to $124,99931 $125,000 to $149,9995 $150,000 to $174,99988 $175,000 to $199,999145 $200,000 to $249,99999 $250,000 to $299,99910 $300,000 to $399,99938 $400,000 to $499,999219 $500,000 to $749,9991,078 $750,000 to $999,999385 $1,000,000 to $1,499,999154 $1,500,000 to $1,999,999115 $2,000,000 or moreRent paid by renters in 2022 in Mira Monte, CA 10 $650 to $69923 $900 to $99947 $1,000 to $1,24919 $1,250 to $1,49968 $1,500 to $1,99978 $2,000 to $2,49924 $2,500 to $2,99935 $3,500 or more53 No cash rent
Percentage of workers working in this county: 97.1%Number of people working at home: 725 (26.3% of all workers )
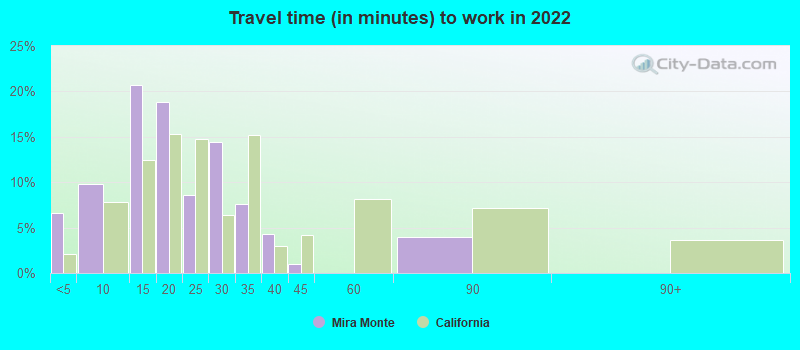
Travel time to work (commute)
Less than 5 minutes: 125 to 9 minutes: 24710 to 14 minutes: 34115 to 19 minutes: 33320 to 24 minutes: 44025 to 29 minutes: 16730 to 34 minutes: 15735 to 39 minutes: 2140 to 44 minutes: 8445 to 59 minutes: 8360 to 89 minutes: 15990 or more minutes: 92
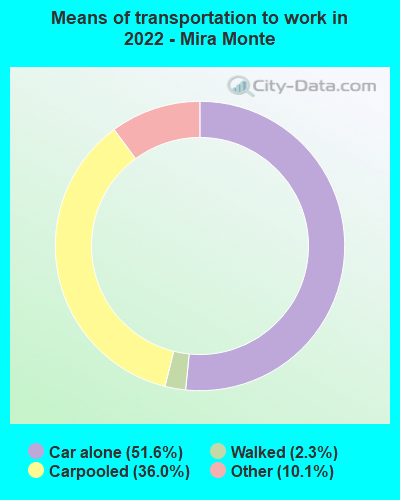
Means of transportation to work:
Drove a car alone: 193 (19.5%)Carpooled: 159 (16.0%)Taxi: 46 (4.6%)Walked: 9 (0.9%)Worked at home: 725 (73.1%)
Unemployment by race in 2022
Unemployment rate for White non-Hispanic residents 4.2% Males6.4% FemalesUnemployment rate for American Indian and Alaska Native residents 100.0% FemalesUnemployment rate for Asian residents 100.0% MalesUnemployment rate for Hispanic or Latino residents 4.9% Males
Year of entry for the foreign-born population in Mira Monte, California
104 2010 or later 47 2000 to 2009 151 1990 to 1999 193 1980 to 1989 81 1970 to 1979 115 Before 1970
First ancestries reported:
English: 349 (15.8%)
German: 281 (12.7%)
Irish: 142 (6.4%)
American: 120 (5.4%)
Italian: 66 (3.0%)
European: 58 (2.6%)
Scottish: 56 (2.5%)
French Canadian: 44 (2.0%)
Russian: 44 (2.0%)
Norwegian: 37 (1.7%)
Swiss: 33 (1.5%)
Scotch-Irish: 20 (0.9%)
Armenian: 17 (0.8%)
Czech: 17 (0.8%)
French: 16 (0.7%)
Polish: 16 (0.7%)
British: 13 (0.6%)
Danish: 10 (0.5%)
Iranian: 9 (0.4%)
Portuguese: 9 (0.4%)
Finnish: 8 (0.4%)
Dutch: 7 (0.3%) Most common places of birth for foreign-born residents (%): Mexico Mira Monte:
37.2% (296)California:
37.2% (3,881,193)
Canada Mira Monte:
16.5% (131)California:
1.2% (127,477)
Fiji Mira Monte:
5.5% (44)California:
0.3% (33,937)
Germany Mira Monte:
5.3% (42)California:
0.7% (73,304)
Other Eastern Europe Mira Monte:
5.0% (40)California:
0.2% (17,699)
Korea Mira Monte:
4.4% (35)California:
3.0% (315,248)
Ireland Mira Monte:
3.9% (31)California:
0.2% (16,042)
Switzerland Mira Monte:
3.6% (29)California:
0.1% (9,159)
Panama Mira Monte:
3.1% (25)California:
0.1% (9,209)
Belgium Mira Monte:
2.1% (17)California:
0.1% (6,176)
Scotland Mira Monte:
1.6% (13)California:
0.1% (8,444)
Dominican Republic Mira Monte:
1.5% (12)California:
0.1% (7,168)
Nicaragua Mira Monte:
1.5% (12)California:
0.6% (58,161)
Place of birth for U.S.-born residents:
This state: 4,193Other state: 1,638Northeast: 258Midwest: 591South: 433West: 350 85.4% of Mira Monte residents lived in the same house 1 years ago.
Out of people who lived in different houses, 39.0% lived in this county.
Out of people who lived in different counties, 87.8% lived in California.
Mira Monte:
85.4%State average:
88.9%
Education attainment for males 25 years and older:
No schooling: 15Nursery to 4th grade: 165th and 6th grade: 487th and 8th grade: 09th grade: 2410th grade: 011th grade: 012th grade, no diploma: 33High school graduate (or equivalency): 380Less than 1 year of college: 171Some college more than 1 year, no degree: 270Associate degree: 365Bachelor's degree: 544Master's degree: 325Professional school degree: 178Doctorate degree: 38
Education attainment for females 25 years and older:
No schooling: 43Nursery to 4th grade: 05th and 6th grade: 537th and 8th grade: 269th grade: 1610th grade: 1011th grade: 012th grade, no diploma: 18High school graduate (or equivalency): 444Less than 1 year of college: 247Some college more than 1 year, no degree: 296Associate degree: 472Bachelor's degree: 650Master's degree: 539Professional school degree: 50Doctorate degree: 95
Housing units in structures:
One, detached: 1,982One, attached: 109Two: 755 to 9: 2650 or more: 55Mobile homes: 852Median worth of mobile homes: $238,718
Housing units lacking complete plumbing facilities in 2022: 1.7%House/condo owner moved in on average 10 years ago
Renter moved in on average 3 years ago
Private vs. public school enrollment:
Students in private schools in grades 1 to 8 (elementary and middle school): 123 Here:
40.2%California:
10.5%
Students in private schools in grades 9 to 12 (high school): 29 Here:
11.6%California:
8.5%
Students in private undergraduate colleges: 51 Here:
10.5%California:
15.9%